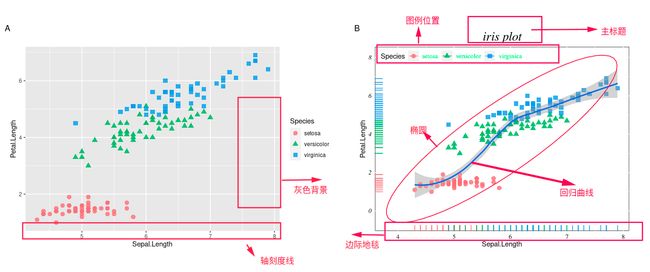
经过前面ggplot2绘图原理的学习,我们了解到ggplot图形的本质都是散点图,因此让我们从一个散点图的案例开始学习,先看下图:
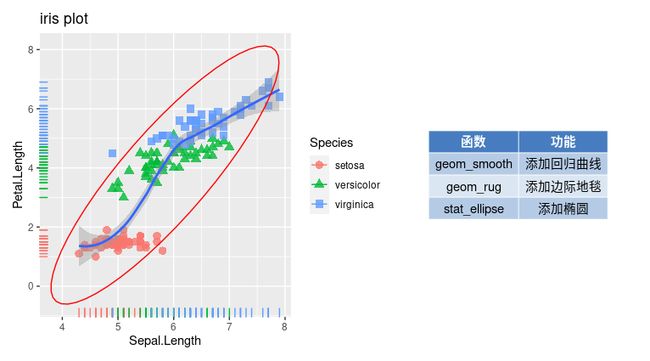
A图为ggplot2默认输出的图形样式,而B图则是在geom_point点图的基础之上添加了边际地毯、回归曲线、椭圆、主标题并进行了theme设置
ggplot2绘图理念如下:
ggplot(data,aes(x=.,y=.,))+geom_* ( )+geom_* ( )+theme( )
library(tidyverse)
library(ggpubr)
library(patchwork)
p1 <- ggplot(iris,aes(Sepal.Length,Petal.Length))+
  geom_point(aes(color=Species,shape=Species),size=3,alpha=0.8)+
  geom_smooth()+
  geom_rug(aes(color=Species))+ggtitle("iris plot")+
  stat_ellipse(type = "norm",color="red")

p2 <- tibble(函数= c("geom_smooth", "geom_rug",
           "stat_ellipse"),
    功能= c("添加回归曲线", "添加边际地毯","添加椭圆")) %>%
  ggtexttable(rows = NULL, theme = ttheme("mBlue"))

p1+p2
通常绘制一张完美的图片,需要在此基础上进行精细加工,例如:
调整图例位置,添加主标题,更改X轴标签、字体类型、字体大小,添加文本注释等等,从这里可以看出用ggplot2绘图我们可以调整图像的任何细节,这些功能的实现都依靠theme()函数
为的保证图片的一致性可以设置一个通用的主题,如下所示
全局主题设置
theme_set(
theme(plot.margin = unit(c(1.2, 1, 1.2, 1),"cm"),
plot.title = element_text(hjust = 0.5,family = "Times",face = "plain",colour ="black",size = 20),
axis.text.x = element_text(angle =0,hjust = 0.5, vjust = 0.5,family = "Times",face = "plain",colour = "black",size = 10),
axis.text.y = element_text(angle =0,hjust =0.5,vjust = 0.5,family ="Times",face ="plain",colour = "black",size = 10),
legend.text = element_text(face ="plain",family ="Times",colour = "black",size = 10),
axis.ticks.x = element_blank(),
axis.ticks.y = element_blank(),
panel.background = element_rect(fill="white",colour="black"))
)
设置完全局主题后继续运行上面的绘图代码,ggplot2会将此主题应用到每张图上
rm(list = ls())
library(tidyverse)
library(ggpubr)
library(patchwork)
p1 <- ggplot(iris,aes(Sepal.Length,Petal.Length))+
  geom_point(aes(color=Species,shape=Species),size=3,alpha=0.8)+
  geom_smooth()+
  geom_rug(aes(color=Species))+ggtitle("iris plot")+
  stat_ellipse(type = "norm",color="red")

p2 <- tibble(函数= c("plot.margin", "plot.title",
             "axis.text.x","legend.text","panel.background",
             "axis.ticks.x"),
         功能= c("设置图边距 unit(c(上,右,下,左),cm))","主标题","X轴文本类型",
               "图例文本类型","图象背景","X轴刻度条")) %>%
  ggtexttable(rows = NULL, theme = ttheme("mBlue"))
p1+p2
如果要对某一张图片进行局部修改,比如X轴文本设置90度,则只需要在+ geom_*() 后继续 + theme( ),填写相关设置参数即可
ggplot(iris,aes(Sepal.Length,Petal.Length))+
  geom_point(aes(color=Species,shape=Species),size=3,alpha=0.8)+
  geom_smooth()+
  geom_rug(aes(color=Species))+ggtitle("iris plot")+
  stat_ellipse(type = "norm",color="red")+
  theme(axis.text.x = element_text(angle =90,
  hjust = 0.5, vjust = 0.5,family = "Times",
  face = "plain",colour = "black",size = 10))
下一节开始具体绘图案例的展示


