R语言之可视化(30)扫地僧easystats(1)
介绍
相关性是一个专注于相关性分析的easystats软件包。 它轻巧,易于使用,并允许计算许多不同类型的相关性,例如偏相关性,贝叶斯相关性,多级相关性,或Sheperd的Pi相关性(鲁棒相关性的类型),距离相关(一种非线性相关性)等等,还允许它们之间进行组合(例如,贝叶斯局部多级相关性)。
不同的相关方法
- Pearson’s correlation:两个变量的协方差除以其标准偏差的乘积。
- Spearman’s rank correlation:等级相关性的非参数度量(两个变量的等级之间的统计相关性)。两个变量>之间的Spearman相关性等于这两个变量的等级值之间的Pearson相关性;皮尔森的相关性评估线性关系,而>斯皮尔曼的相关性评估单调关系(无论线性与否)。
- Kendall’s rank correlation:在正常情况下,肯德尔相关性比Spearman相关性更可取,因为它的总差错敏感度(GES)较小,而渐近方差(AV)较小,从而使其更健壮和更有效。但是,从某种意义上说,肯德尔的tau的解释比斯皮尔曼的rho的解释不那么直接,因为它可以量化所有可能的成对事件中一致和不一致对的百分比之间的差异。
- Biweight midcorrelation:基于中位数而不是基于均值的样本之间相似度的一种度量,因此对异常值不那么敏感,并且可以作为其他相似度度量(例如Pearson相关)的可靠替代。
- Distance correlation距离相关:距离相关可测量两个随机变量或随机矢量之间的线性和非线性关联。这与Pearson的相关性相反,后者只能检测两个随机变量之间的线性关联。
- Percentage bend correlation折弯百分比相关性:Wilcox(1994)引入的折弯相关性是基于特定百分比的边际观测值的权重偏低(偏离默认值20%)而得出的。
- Shepherd’s Pi correlation关联:等同于剔除异常值后的Spearman等级关联(通过自举马氏距离)。
- Multilevel correlation多级相关:多级相关是部分相关的一种特殊情况,其中要调整的变量是一个因素,并作为随机效应包含在混合模型中。
安装和加载包
devtools::install_github("easystats/correlation")

library(correlation)
library(bayestestR)
library(see)

library(ggplot2)
library(tidyr)
library(dplyr)
cor <- correlation(iris)
cor
Parameter1   |   Parameter2 |     r |         95% CI |     t |  df |      p |  Method | n_Obs
---------------------------------------------------------------------------------------------
Sepal.Length |  Sepal.Width | -0.12 | [-0.27,  0.04] | -1.44 | 148 | 0.152  | Pearson |   150
Sepal.Length | Petal.Length |  0.87 | [ 0.83,  0.91] | 21.65 | 148 | < .001 | Pearson |   150
Sepal.Length |  Petal.Width |  0.82 | [ 0.76,  0.86] | 17.30 | 148 | < .001 | Pearson |   150
Sepal.Width  | Petal.Length | -0.43 | [-0.55, -0.29] | -5.77 | 148 | < .001 | Pearson |   150
Sepal.Width  |  Petal.Width | -0.37 | [-0.50, -0.22] | -4.79 | 148 | < .001 | Pearson |   150
Petal.Length |  Petal.Width |  0.96 | [ 0.95,  0.97] | 43.39 | 148 | < .001 | Pearson |   150
Parameter1 为列1, Parameter2为列2,从上面表格我们可以出看出一些必要的相关信息,包括相关系数r,P值、相关检验的方法Method和观察值数量。
summary(cor)
Parameter    | Petal.Width | Petal.Length | Sepal.Width
-------------------------------------------------------
Sepal.Length |     0.82*** |      0.87*** |       -0.12
Sepal.Width  |    -0.37*** |     -0.43*** |
Petal.Length |     0.96*** |              |
通过数据框的形式来展示
> summary(cor, redundant = TRUE)
Parameter    | Sepal.Length | Sepal.Width | Petal.Length | Petal.Width
----------------------------------------------------------------------
Sepal.Length |      1.00*** |       -0.12 |      0.87*** |     0.82***
Sepal.Width  |        -0.12 |     1.00*** |     -0.43*** |    -0.37***
Petal.Length |      0.87*** |    -0.43*** |      1.00*** |     0.96***
Petal.Width  |      0.82*** |    -0.37*** |      0.96*** |     1.00***
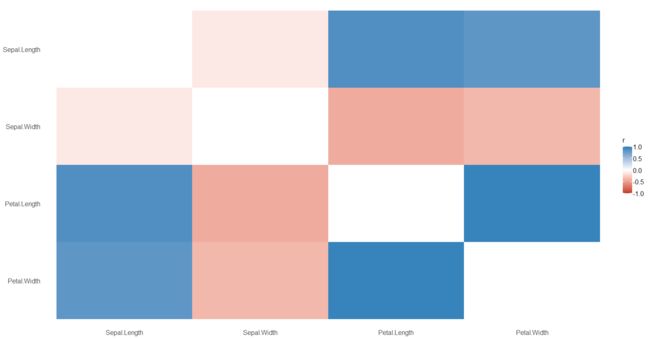
绘图
library(dplyr)
library(see)

cor %>%
  summary( redundant = TRUE) %>%
  plot()
分组后相关分析
> iris %>%
+   select(Species, Sepal.Length, Sepal.Width, Petal.Width) %>%
+   group_by(Species) %>%
+   correlation()
Group      |   Parameter1 |  Parameter2 |    r |        95% CI |    t | df |      p |  Method | n_Obs
-----------------------------------------------------------------------------------------------------
setosa     | Sepal.Length | Sepal.Width | 0.74 | [ 0.59, 0.85] | 7.68 | 48 | < .001 | Pearson |    50
setosa     | Sepal.Length | Petal.Width | 0.28 | [ 0.00, 0.52] | 2.01 | 48 | 0.101  | Pearson |    50
setosa     |  Sepal.Width | Petal.Width | 0.23 | [-0.05, 0.48] | 1.66 | 48 | 0.104  | Pearson |    50
versicolor | Sepal.Length | Sepal.Width | 0.53 | [ 0.29, 0.70] | 4.28 | 48 | < .001 | Pearson |    50
versicolor | Sepal.Length | Petal.Width | 0.55 | [ 0.32, 0.72] | 4.52 | 48 | < .001 | Pearson |    50
versicolor |  Sepal.Width | Petal.Width | 0.66 | [ 0.47, 0.80] | 6.15 | 48 | < .001 | Pearson |    50
virginica  | Sepal.Length | Sepal.Width | 0.46 | [ 0.20, 0.65] | 3.56 | 48 | 0.002  | Pearson |    50
virginica  | Sepal.Length | Petal.Width | 0.28 | [ 0.00, 0.52] | 2.03 | 48 | 0.048  | Pearson |    50
virginica  |  Sepal.Width | Petal.Width | 0.54 | [ 0.31, 0.71] | 4.42 | 48 | < .001 | Pearson |    50
>
自动选择检验方法的相关分析
> correlation(iris, include_factors = TRUE, method = "auto")
For i = 2 j = 1  A cell entry of 0 was replaced with correct =  0.5.  Check your data!
For i = 2 j = 1  A cell entry of 0 was replaced with correct =  0.5.  Check your data!
For i = 2 j = 1  A cell entry of 0 was replaced with correct =  0.5.  Check your data!
Parameter1         |         Parameter2 |     r |         95% CI |      t |  df |      p |         Method | n_Obs
-----------------------------------------------------------------------------------------------------------------
Sepal.Length       |        Sepal.Width | -0.12 | [-0.27,  0.04] |  -1.44 | 148 | 0.452  |        Pearson |   150
Sepal.Length       |       Petal.Length |  0.87 | [ 0.83,  0.91] |  21.65 | 148 | < .001 |        Pearson |   150
Sepal.Length       |        Petal.Width |  0.82 | [ 0.76,  0.86] |  17.30 | 148 | < .001 |        Pearson |   150
Sepal.Length       |     Species.setosa | -0.72 | [-0.79, -0.63] | -12.53 | 148 | < .001 | Point-biserial |   150
Sepal.Length       | Species.versicolor |  0.08 | [-0.08,  0.24] |   0.97 | 148 | 0.452  | Point-biserial |   150
Sepal.Length       |  Species.virginica |  0.64 | [ 0.53,  0.72] |  10.08 | 148 | < .001 | Point-biserial |   150
Sepal.Width        |       Petal.Length | -0.43 | [-0.55, -0.29] |  -5.77 | 148 | < .001 |        Pearson |   150
Sepal.Width        |        Petal.Width | -0.37 | [-0.50, -0.22] |  -4.79 | 148 | < .001 |        Pearson |   150
Sepal.Width        |     Species.setosa |  0.60 | [ 0.49,  0.70] |   9.20 | 148 | < .001 | Point-biserial |   150
Sepal.Width        | Species.versicolor | -0.47 | [-0.58, -0.33] |  -6.44 | 148 | < .001 | Point-biserial |   150
Sepal.Width        |  Species.virginica | -0.14 | [-0.29,  0.03] |  -1.67 | 148 | 0.392  | Point-biserial |   150
Petal.Length       |        Petal.Width |  0.96 | [ 0.95,  0.97] |  43.39 | 148 | < .001 |        Pearson |   150
Petal.Length       |     Species.setosa | -0.92 | [-0.94, -0.89] | -29.13 | 148 | < .001 | Point-biserial |   150
Petal.Length       | Species.versicolor |  0.20 | [ 0.04,  0.35] |   2.51 | 148 | 0.066  | Point-biserial |   150
Petal.Length       |  Species.virginica |  0.72 | [ 0.63,  0.79] |  12.66 | 148 | < .001 | Point-biserial |   150
Petal.Width        |     Species.setosa | -0.89 | [-0.92, -0.85] | -23.41 | 148 | < .001 | Point-biserial |   150
Petal.Width        | Species.versicolor |  0.12 | [-0.04,  0.27] |   1.44 | 148 | 0.452  | Point-biserial |   150
Petal.Width        |  Species.virginica |  0.77 | [ 0.69,  0.83] |  14.66 | 148 | < .001 | Point-biserial |   150
Species.setosa     | Species.versicolor | -0.88 | [-0.91, -0.84] | -22.35 | 148 | < .001 |    Tetrachoric |   150
Species.setosa     |  Species.virginica | -0.88 | [-0.91, -0.84] | -22.35 | 148 | < .001 |    Tetrachoric |   150
Species.versicolor |  Species.virginica | -0.88 | [-0.91, -0.84] | -22.35 | 148 | < .001 |    Tetrachoric |   150
>
相关分析示例:
> library(correlation)
>
> data <- simulate_simpson(n=100, groups=10)
>
>
>
> library(ggplot2)
>
> ggplot(data, aes(x=V1, y=V2)) +
+   geom_point() +
+   geom_smooth(colour="black", method="lm", se=FALSE) +
+   theme_classic()
`geom_smooth()` using formula 'y ~ x'
>
>
> correlation(data)
Parameter1 | Parameter2 |     r |         95% CI |      t |  df |      p |  Method | n_Obs
------------------------------------------------------------------------------------------
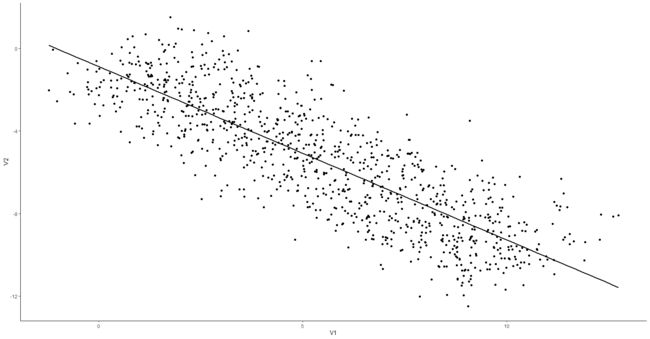
V1         |         V2 | -0.84 | [-0.86, -0.82] | -48.77 | 998 | < .001 | Pearson |  1000
>
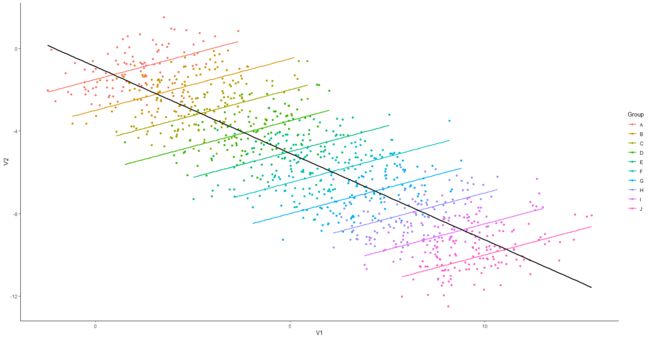
发现数据总的趋势是负相关
library(ggplot2)

ggplot(data, aes(x=V1, y=V2)) +
  geom_point(aes(colour=Group)) +
  geom_smooth(aes(colour=Group), method="lm", se=FALSE) +
  geom_smooth(colour="black", method="lm", se=FALSE) +
  theme_classic()
但是分组后,发现组内是正相关


