机器学习逻辑回归:算法兑现为python代码
作者:alg-flody
编辑:Emily
0 回顾
昨天推送了逻辑回归的基本原理:从逻辑回归的目标任务,到二分类模型的构建,再到如何用梯度下降求出二分类模型的权重参数。今天,我们将对这个算法兑现为代码,包括用于模拟数据集的生成,到模型的创建,权重参数的求解。这个过程是动手实践写代码的过程,这很有趣!
1 生成模拟的数据集
为了编写代码模拟二分类任务,我们的第一步工作是先生成用于测试的数据集,当然这一步也可以从网上找相关二分类任务的实际数据集。
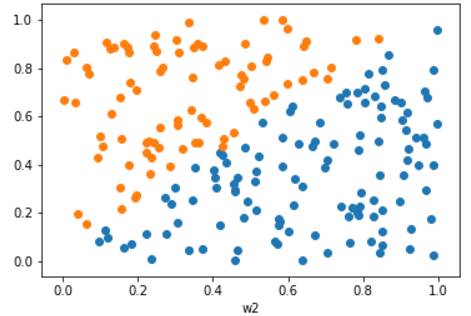
首先看下生成的用于模拟的数据集长得样子,它有两个特征w1,w2组成,共有200个样本点,现在的任务是要对这个数据集进行分类。
下面是用于模拟上图数据的代码:
import numpy as np
import matplotlib.pyplot as plt
#按照一定规律均匀分布含有两个特征的数据点
def createData(samplecnt,coef=1.0,intercept=0.05):
x1 = np.random.uniform(0,1,samplecnt)
x2 = np.random.uniform(0,1,samplecnt)
index = (x2-intercept)/x1
x1_pos = x1[index]
x2_pos = x2[index]
index = (x2-intercept)/x1 >=coef
x1_neg = x1[index]
x2_neg = x2[index]
plt.xlabel("w1")
plt.ylabel("w2")
plt.scatter(x1_pos,x2_pos)
plt.scatter(x1_neg,x2_neg)
regx = np.linspace(0,1,samplecnt)
regy = coef*regx+intercept
#plt.plot(regx,regy,color='g')
plt.show()
return x1_pos,x1_neg,x2_pos,x2_neg
#组合成原始数据
def combine_data(x1_pos,x1_neg,x2_pos,x2_neg):
x1_pos_1 = x1_pos.reshape(-1,1)
x2_pos_1 = x2_pos.reshape(-1,1)
x_pos = np.concatenate((x1_pos_1,x2_pos_1),axis=1)
x_pos_shape = np.shape(x_pos)
y_pos = np.ones(x_pos_shape[0])
y_pos = y_pos.reshape(-1,1)
data_pos = np.concatenate((x_pos,y_pos),axis=1)
x1_neg_1 = x1_neg.reshape(-1,1)
x2_neg_1 = x2_neg.reshape(-1,1)
x_neg = np.concatenate((x1_neg_1,x2_neg_1),axis=1)
x_neg_shape = np.shape(x_neg)
y_neg = np.zeros(x_neg_shape[0])
y_neg = y_neg.reshape(-1,1)
data_neg = np.concatenate((x_neg,y_neg),axis=1)
data = np.vstack((data_pos,data_neg))
data = np.random.permutation(data)
return data
因此data表示以上所有的样本点和标签值组成的数据集,下面看下前10天长的样子:
w1 w2 y
array([[ 0.78863156, 0.45879449, 1. ],
[ 0.70291388, 0.03437041, 1. ],
[ 0.89775764, 0.24842968, 1. ],
[ 0.92674416, 0.13579184, 1. ],
[ 0.80332783, 0.71211063, 1. ],
[ 0.7208047 , 0.48432214, 1. ],
[ 0.8523947 , 0.06768344, 1. ],
[ 0.49226351, 0.24969169, 1. ],
[ 0.85094261, 0.79031018, 1. ],
[ 0.76426901, 0.07703571, 1. ]])
下面介绍,如何用梯度下降法,求出两个特征对应的权重参数,进而能正确的预测,当一个新的样本点来的时候,能预测出属于0类,还是1类。
2 梯度下降求权重参数
逻辑回归的模型,代价函数,梯度,昨天我们都已经准备好了,接下来,就是编写python 代码实现梯度下降的求解。
设定一个学习率迭代参数,当与前一时步的代价函数与当前的代价函数的差小于阈值时,计算结束,我们将得到3个权重参数,其中包括两个特征的权重参数,和偏置项的权重参数。
假定模型的决策边界为线性模型,梯度下降求逻辑回归模型的权重参数的基本思路如下:
'model' 建立的逻辑回归模型:包括Sigmoid映射
'cost' 代价函数
'gradient' 梯度公式
'theta update' 参数更新公式
'stop stratege' 迭代停止策略:代价函数小于阈值法
下面分别将昨天准备好的公式,兑现为相应的代码:
不要忘记初始化一列偏置项:
做一个偏移量和2个特征的组合,这样与前面推送的理论部分衔接在一起,组合的代码如下所示:
'偏移量 b shape=(200,1)'
b = np.ones(200)
'将偏移量与2个特征值组合 shape = (200,3)'
X = np.hstack((b,X))
'model'
def sigmoid(x):
return 1/(1+ np.exp(-x))
def model(theta,X):
theta = np.array(theta)
return sigmoid( X.dot(theta) )
'cost'
def cost(m,theta,X,y):
ele = y*np.log(model(theta,X)) + (1-y)*np.log(1-model(theta,X))
item_sum = np.sum(ele)
return -item_sum/m
'gradient'
def gradient(m,theta,X,y,cols):
grad_theta = []
for j in range(cols):
grad = (model(theta,X) - y).dot(X[:,j])
grad_sum = np.sum(grad)
grad_theta.append(grad_sum/m)
return np.array(grad_theta)
'theta update'
def theta_update(grad_theta,theta,sigma):
return theta - sigma * grad_theta
'stop stratege'
def stop_stratege(cost,cost_update,threshold):
return cost-cost_update < threshold
'逻辑回归算法'
def LogicRegression(X,y,threshold,m,xcols):
start = time.clock()
'设置权重参数的初始值'
theta = np.zeros(xcols)
'迭代步数'
iters = 0;
'记录代价函数的值'
cost_record=[]
'学习率'
sigma = 0.01
cost_val = cost(m,theta,X,y)
cost_record.append(cost_val)
while True:
grad = gradient(m,theta,X,y,xcols)
'参数更新'
theta = theta_update(grad,theta,sigma)
cost_update = cost(m,theta,X,y)
if stop_stratege(cost_val,cost_update,threshold):
break
iters=iters+1
cost_val = cost_update
print("cost_val:%f" %cost_val)
cost_record.append(cost_val)
end = time.clock()
print("LogicRegressionconvergence duration: %f s" % (end - start))
return cost_record, iters,theta
3 分析结果
调用逻辑回归函数:LogicRegression(data[:,[0,1,2]],data[:,3],0.00001,200,3)
结果显示经过,逻辑回归梯度下降经过如下时间得到初步收敛,LogicRegression convergence duration:18.076398 s,经过 56172万 多个时步迭代,每个时步计算代价函数的取值,如下图所示:
收敛时,得到的权重参数为:
array([ 0.48528656, 9.48593954, -9.42256868])
参数的含义:第一个权重参数为偏置项,第二、三个权重参数相当,只不过贡献方向相反而已。
下面画出,二分类的决策边界,
plt.scatter(x1_pos,x2_pos)
plt.scatter(x1_neg,x2_neg)
wp = np.linspace(0.0,1.0,200)
plt.plot(wp,-(theta[0]+theta[1]*wp)/theta[2],color='g')
plt.show()
可以看到分类效果非常不错。
4 总结
以上是逻辑回归的梯度下降求解思路和代码实现,在梯度下降的过程中,学习率和迭代终止的阈值属于这个算法的超参数,在本次调试过程中,心得如下:
1. 如果代价函数的最后稳定的值,确认比较大,比如0.5,说明模型中一定存在某些bug,比如在我调试过程中,将标签值错误地被赋值了第三列,实际应该为第四列,所以导致最后迭代终止时的成本值为0.50。
2. 学习率直接关系到迭代速度,如果学习率太小,迭代下降的会很慢,相反会比较快。
3. 迭代终止的策略选取,一般会根据迭代次数,成本函数前后两次的差小于某个阈值等,如果选取的终止策略不当,会导致看似收敛,实际成本值还很大的情况。
明天,让我们一起探讨下另一种分类策略,决策树的分类原理吧。
![]()
让我们看一下远边的大海,和海边优美的风景,先放松一下吧!
谢谢您的阅读,期待您的到来。
欢迎关注《算法channel》
主要推送关于算法的分析过程及应用的消息。培养思维能力,注重过程,挖掘背后的原理,刨根问底。本着严谨和准确的态度,目标是撰写实用和启发性的文章,欢迎您的关注。


