使用决策树预测西瓜类型_使用决策树与随机深林预测糖尿病(python)
(一)算法简介
决策树是一种树形结构,其中每一个内部节点表示在一个特征(属性)上的测试,每个分支代表一个测试输出,每个叶子节点代表一种类别。


(二)代码实例
使用决策树预测糖尿病
数据源: https://www.kaggle.com/uciml/pima-indians-diabetes-database#diabetes.csv
相关数据与代码下载:https://github.com/GreedyAIAcademy/Machine-Learning/tree/master/6.%20DecisionTree.RandomForest/homework
参考引用于:贪心学院
注意: 需要使用如下命令安装额外两个包用于画图
conda install python-graphviz
conda install pydotplus
导入数据包
import pandas as pd
import matplotlib.pyplot as plt
import seaborn as sns
from sklearn.metrics import roc_auc_score
from sklearn.metrics import classification_report
from sklearn.tree import DecisionTreeClassifier
from sklearn.model_selection import train_test_split
from sklearn import tree
from sklearn import metrics
特征项命名与导入数据
col_names = ['pregnant', 'glucose', 'bp', 'skin', 'insulin', 'bmi', 'pedigree', 'age', 'label']
pima = pd.read_csv("pima-indians-diabetes.csv", header=None, names=col_names)

pima.head()
分析数据
- 768 条数据, 每一条数据包含 9 个特征
- 糖尿病发病率 35%
- ……
print(pima.shape)
# 特征数据类型.
pima.dtypes
label_rate = pima.label.value_counts() / len(pima)
label_rate
pima.describe()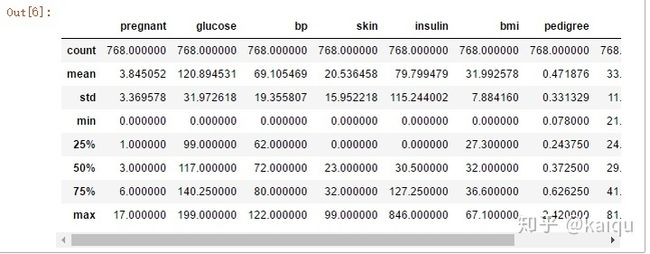
# 分组的平均数据统计
label_Summary = pima.groupby('label')
label_Summary.mean()
相关性分析
- 正相关的特征:
pregnant VS age: 0.544341
bmi VS skin: 0.392573
label VS glucose: 0.466581
- 负相关的特征:
age VS skin: -0.113970
# 相关性矩阵
corr = pima.corr()
#corr = (corr)
sns.heatmap(corr,
            xticklabels=corr.columns.values,
            yticklabels=corr.columns.values)
corr

# 比较糖尿病患者与正常人之间的胰岛素量
emp_population = pima['insulin'][pima['label'] == 0].mean()
emp_diabetic_insulin = pima[pima['label']==1]['insulin'].mean()

print( '正常人胰岛素: ' + str(emp_population))
print( '糖尿病患者胰岛素: ' + str(emp_diabetic_insulin))
进行 T-Test
进行一个 t-test, 看糖尿病患者与正常人之间的胰岛素量是不是明显不同
import scipy.stats as stats
stats.ttest_1samp(a = pima[pima['label']==1]['insulin'], # 糖尿病患者的胰岛素样本
                  popmean = emp_population)  #正常人的胰岛素均值
T-Test 显示pvalue (0) 很小, 所以他们之间是明显不同的
degree_freedom = len(pima[pima['label']==1])

LQ = stats.t.ppf(0.025,degree_freedom)  # 95%致信区间的左边界

RQ = stats.t.ppf(0.975,degree_freedom)  # 95%致信区间的右边界

print ('The t-分布 左边界: ' + str(LQ))
print ('The t-分布 右边界: ' + str(RQ))
# 概率密度函数估计
fig = plt.figure(figsize=(15,4),)
ax=sns.kdeplot(pima.loc[(pima['label'] == 0),'bp'] , color='b',shade=True,label='normal guy')
ax=sns.kdeplot(pima.loc[(pima['label'] == 1),'bp'] , color='r',shade=True, label='dabetic')
ax.set(xlabel='bp', ylabel='Frequency')
plt.title('dabetic Evaluation Distribution - Dabetic V.S. Normal guy')
# 概率密度函数估计
fig = plt.figure(figsize=(15,4),)
ax=sns.kdeplot(pima.loc[(pima['label'] == 0),'pregnant'] , color='b',shade=True,label='normal guy')
ax=sns.kdeplot(pima.loc[(pima['label'] == 1),'pregnant'] , color='r',shade=True, label='dabetic')
ax.set(xlabel='pregnant number', ylabel='Frequency')
plt.title('dabetic Evaluation Distribution - Dabetic V.S. Normal guy')
制作数据集
# 选择预测所需的特征(为了简化,也可全选)
feature_cols = ['pregnant', 'insulin', 'bmi', 'age','glucose','bp','pedigree']
X = pima[feature_cols] # 特征
y = pima.label # 类别标签

# 将数据分为训练和测试数据
X_train, X_test, y_train, y_test = train_test_split(X, y, test_size=0.3, random_state=1) # 70% training and 30% test
使用无优化决策树模型0
# 创建决策树分类器
clf0 = DecisionTreeClassifier(criterion='entropy'
                            )
# 训练模型
clf0 = clf0.fit(X_train,y_train)

# 使用训练好的模型做预测
y_pred = clf0.predict(X_test)

dt_roc_auc0 = roc_auc_score(y_test, y_pred)
print ("nn ---决策树0---")
print ("决策树0 AUC = %2.2f" % dt_roc_auc0)
print(classification_report(y_test, y_pred))

# 模型的准确性?
print("Accuracy:",metrics.accuracy_score(y_test, y_pred))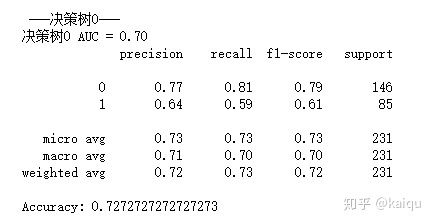
可视化训练好的决策树模型
from sklearn.tree import export_graphviz
from sklearn.externals.six import StringIO
from IPython.display import Image
import pydotplus

import os
os.environ["PATH"] += os.pathsep + 'E:/Anaconda/graphviz/release/bin/' #将GraphViz安装目录的bin目录放到环境变量的path路径中

dot_data = StringIO()
export_graphviz(clf0, out_file=dot_data,
                filled=True, rounded=True,
                special_characters=True,feature_names = feature_cols,class_names=['0','1'])
graph = pydotplus.graph_from_dot_data(dot_data.getvalue())
graph.write_png('diabetes.png')
Image(graph.create_png())
使用优化的决策树模型1
# 创建新的决策树, 限定树的最大深度, 减少过拟合

clf1 =tree.DecisionTreeClassifier(
    criterion='entropy',
    max_depth=3, # 定义树的深度, 可以用来防止过拟合
    #min_weight_fraction_leaf=0.01 # 定义叶子节点最少需要包含多少个样本(使用百分比表达), 防止过拟合
    )

# 训练模型
clf1 = clf1.fit(X_train, y_train)

# 预测
y_pred = clf1.predict(X_test)

dt_roc_auc1 = roc_auc_score(y_test, y_pred)
print ("nn ---决策树1---")
print ("决策树1 AUC = %2.2f" % dt_roc_auc1)
print(classification_report(y_test, y_pred))

# 模型的性能
print("Accuracy:",metrics.accuracy_score(y_test, y_pred))
from sklearn.externals.six import StringIO
from IPython.display import Image
from sklearn.tree import export_graphviz
import pydotplus

import os
os.environ["PATH"] += os.pathsep + 'E:/Anaconda/graphviz/release/bin/'

dot_data = StringIO()
export_graphviz(clf1, out_file=dot_data,
                filled=True, rounded=True,
                special_characters=True, feature_names = feature_cols,class_names=['0','1'])
graph = pydotplus.graph_from_dot_data(dot_data.getvalue())

graph.write_png('diabetes2.png')
Image(graph.create_png())
使用随机森林做预测
from sklearn.ensemble import RandomForestClassifier

# 随机森林, 通过调整参数来获取更好的结果
rf = RandomForestClassifier(
    criterion='entropy',
    n_estimators=1000,
    max_depth=None, # 定义树的深度, 可以用来防止过拟合
    min_samples_split=10, # 定义至少多少个样本的情况下才继续分叉
    #min_weight_fraction_leaf=0.02 # 定义叶子节点最少需要包含多少个样本(使用百分比表达), 防止过拟合
    )

# 训练模型
rf.fit(X_train, y_train)

# 做预测
y_pred = rf.predict(X_test)

print ("nn ---随机森林---")
rf_roc_auc = roc_auc_score(y_test, y_pred)
print ("随机森林 AUC = %2.2f" % rf_roc_auc)
print(classification_report(y_test, y_pred))


# 模型的准确率
print("Accuracy:",metrics.accuracy_score(y_test, y_pred))
ROC 图
# ROC 图
from sklearn.metrics import roc_curve
rf_fpr, rf_tpr, rf_thresholds = roc_curve(y_test, rf.predict_proba(X_test)[:,1])
dt_fpr1, dt_tpr1, dt_thresholds1 = roc_curve(y_test, clf1.predict_proba(X_test)[:,1])
dt_fpr0, dt_tpr0, dt_thresholds0 = roc_curve(y_test, clf0.predict_proba(X_test)[:,1])

plt.figure()

# 随机森林 ROC
plt.plot(rf_fpr, rf_tpr, label='Random Forest (area = %0.2f)' % rf_roc_auc)

# 决策树1 ROC
plt.plot(dt_fpr1, dt_tpr1, label='Decision Tree1 (area = %0.2f)' % dt_roc_auc1)

# 决策树0 ROC
plt.plot(dt_fpr0, dt_tpr0, label='Decision Tree0 (area = %0.2f)' % dt_roc_auc0)

plt.xlim([0.0, 1.0])
plt.ylim([0.0, 1.05])
plt.xlabel('False Positive Rate')
plt.ylabel('True Positive Rate')
plt.title('ROC Graph')
plt.legend(loc="lower right")
plt.show()
通过决策树分析不同的特征的重要性
## 画出随机特征的重要性 ##
import numpy as np

importances = rf.feature_importances_
feat_names = pima.drop(['label'],axis=1).columns

indices = np.argsort(importances)[::-1]
plt.figure(figsize=(12,6))
plt.title("Feature importances by DecisionTreeClassifier")
plt.bar(range(len(indices)), importances[indices], color='lightblue',  align="center")
plt.step(range(len(indices)), np.cumsum(importances[indices]), where='mid', label='Cumulative')
plt.xticks(range(len(indices)), feat_names[indices], rotation='vertical',fontsize=14)
plt.xlim([-1, len(indices)])
plt.show()
由此可以看出影响糖尿病最大的前四个特征分别为:insulin/bp/skin/prdigree
实例中除了算法的调用外也有许多分析数据的方法值得学习与思考。