北京温度可视化实例
# 安装库专用

# 通过如下命令设定镜像
options(repos = 'http://mirrors.ustc.edu.cn/CRAN/')
# 查看镜像是否修改
getOption('repos')
# 尝试下载R包
#若有需要,进行安装
install.packages('beanplot')
‘http://mirrors.ustc.edu.cn/CRAN/’
Installing package into 'C:/Users/天涯过客/Documents/R/win-library/4.0'
(as 'lib' is unspecified)


package 'beanplot' successfully unpacked and MD5 sums checked

The downloaded binary packages are in
	C:\Users\天涯过客\AppData\Local\Temp\RtmpgBff4W\downloaded_packages
#设置工作路径
setwd("D:/LengPY")
#导入数据
library(readxl)
data<- read_excel("datatao.xlsx")
head(data)
A tibble: 6 × 4
| 年份 |
月份 |
日 |
温度 |
|
|
|
|
| 2009 |
1 |
1 |
-4.1 |
| 2009 |
1 |
2 |
-3.8 |
| 2009 |
1 |
3 |
-1.8 |
| 2009 |
1 |
4 |
-4.0 |
| 2009 |
1 |
5 |
-3.9 |
| 2009 |
1 |
6 |
-2.3 |
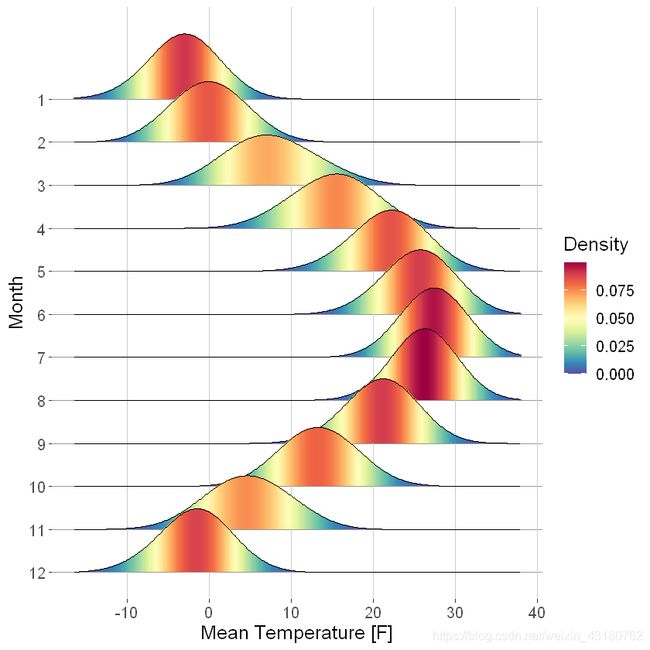
按月份进行分类,进行温度分布可视化
library(reshape2)
library(ggplot2)
library(ggridges)
library(RColorBrewer)
colormap <- colorRampPalette(rev(brewer.pal(11,'Spectral')))(32)
dt<-data[,c(2,4)]
colnames(dt)<-c("Month","Mean Temperature [F]")
splitdata<-split(dt,dt$Month)
xmax<-max(dt$`Mean Temperature [F]`)*1.1
xmin<-min(dt$`Mean Temperature [F]`)*1.1


N<-length(splitdata)
labels_y<-names(splitdata)

mydata<-data.frame(x=numeric(),y=numeric(),variable=numeric()) #?????յ?Data.Frame

for (i in 1:N){
  tempy<-density(splitdata[[i]][2]$`Mean Temperature [F]`,bw = 3.37,from=xmin, to=xmax)
  newdata<-data.frame(x=tempy$x,y=tempy$y)
  newdata$variable<-i
  mydata<-rbind(mydata,newdata)
}

Step<-max(mydata$y)*0.6
mydata$offest<--as.numeric(mydata$variable)*Step
mydata$V1_density_offest<-mydata$y+mydata$offest

p<-ggplot()
for (i in 1:N){
  p<-p+ geom_linerange(data=mydata[mydata$variable==i,],aes(x=x,ymin=offest,ymax=V1_density_offest,group=variable,color=y),size =1, alpha =1) +
        geom_line(data=mydata[mydata$variable==i,],aes(x=x, y=V1_density_offest),color="black",size=0.5)
}

p+scale_color_gradientn(colours=colormap,name="Density")+
  scale_y_continuous(breaks=seq(-Step,-Step*N,-Step),labels=labels_y)+
  xlab("Mean Temperature [F]")+
  ylab("Month")+
  theme_classic()+
  theme(
    panel.background=element_rect(fill="white",colour=NA),
    panel.grid.major.x = element_line(colour = "grey80",size=.25),
    panel.grid.major.y = element_line(colour = "grey60",size=.25),
    axis.line = element_blank(),
    text=element_text(size=15,colour = "black"),
    plot.title=element_text(size=15,hjust=.5),
    legend.position="right"
  )

根据年份进行温度分布可视化
library(reshape2)
library(ggplot2)
library(ggridges)
library(RColorBrewer)
colormap <- colorRampPalette(rev(brewer.pal(11,'Spectral')))(32)
dt<-data[,c(1,4)]
colnames(dt)<-c("Year","Mean Temperature [F]")
splitdata<-split(dt,dt$Year)
xmax<-max(dt$`Mean Temperature [F]`)*1.1
xmin<-min(dt$`Mean Temperature [F]`)*1.1


N<-length(splitdata)
labels_y<-names(splitdata)

mydata<-data.frame(x=numeric(),y=numeric(),variable=numeric()) #?????յ?Data.Frame

for (i in 1:N){
  tempy<-density(splitdata[[i]][2]$`Mean Temperature [F]`,bw = 3.37,from=xmin, to=xmax)
  newdata<-data.frame(x=tempy$x,y=tempy$y)
  newdata$variable<-i
  mydata<-rbind(mydata,newdata)
}

Step<-max(mydata$y)*0.6
mydata$offest<--as.numeric(mydata$variable)*Step
mydata$V1_density_offest<-mydata$y+mydata$offest

p<-ggplot()
for (i in 1:N){
  p<-p+ geom_linerange(data=mydata[mydata$variable==i,],aes(x=x,ymin=offest,ymax=V1_density_offest,group=variable,color=y),size =1, alpha =1) +
        geom_line(data=mydata[mydata$variable==i,],aes(x=x, y=V1_density_offest),color="black",size=0.5)
}

p+scale_color_gradientn(colours=colormap,name="Density")+
  scale_y_continuous(breaks=seq(-Step,-Step*N,-Step),labels=labels_y)+
  xlab("Mean Temperature [F]")+
  ylab("Year")+
  theme_classic()+
  theme(
    panel.background=element_rect(fill="white",colour=NA),
    panel.grid.major.x = element_line(colour = "grey80",size=.25),
    panel.grid.major.y = element_line(colour = "grey60",size=.25),
    axis.line = element_blank(),
    text=element_text(size=15,colour = "black"),
    plot.title=element_text(size=15,hjust=.5),
    legend.position="right"
  )

#再次导入
#导入数据
library(readxl)
data<- read_excel("datatao.xlsx")
head(data)
A tibble: 6 × 5
| 年份 |
月份 |
日 |
温度 |
date |
|
|
|
|
|
| 2009 |
1 |
1 |
-4.1 |
2009-01-01 |
| 2009 |
1 |
2 |
-3.8 |
2009-01-02 |
| 2009 |
1 |
3 |
-1.8 |
2009-01-03 |
| 2009 |
1 |
4 |
-4.0 |
2009-01-04 |
| 2009 |
1 |
5 |
-3.9 |
2009-01-05 |
| 2009 |
1 |
6 |
-2.3 |
2009-01-06 |
summary(data$温度)
   Min. 1st Qu.  Median    Mean 3rd Qu.    Max.
 -14.90    2.10   14.70   13.22   23.90   34.50
绘制日历图
#绘制日历图
library(openair)
data<-data[which(data$年份==2020),]
data1<-data.frame(data$date,data$温度)
colnames(data1)<-c('date','temp')
head(data1)
A data.frame: 6 × 2
|
date |
temp |
|
|
|
| 1 |
2020-01-01 |
-6.5 |
| 2 |
2020-01-02 |
-2.7 |
| 3 |
2020-01-03 |
-1.4 |
| 4 |
2020-01-04 |
0.2 |
| 5 |
2020-01-05 |
0.0 |
| 6 |
2020-01-06 |
0.5 |
calendarPlot(data1,
             pollutant = "temp",
             breaks = c(-15, 2.1, 14.7, 23.9, 34.5),
             labels = c("Very low", "Low", "High", "Very High"),
             cols = c("lightblue", "skyblue", "gold2",  "brown"),
             statistic="sum",
             year = 2020)

Sys.setlocale(category = "LC_ALL", locale = "English_United States.1252")
Sys.setlocale("LC_CTYPE", "Chinese")
‘LC_COLLATE=English_United States.1252;LC_CTYPE=English_United States.1252;LC_MONETARY=English_United States.1252;LC_NUMERIC=C;LC_TIME=English_United States.1252’
‘Chinese (Simplified)_China.936’
绘制多年份日历图
library(ggplot2)
library(data.table) #提供data.table()函数
library(ggTimeSeries)
library(RColorBrewer)
set.seed(1234)
dat <- data.table(
  date = seq(as.Date("1/01/2009", "%d/%m/%Y"),as.Date("31/12/2020", "%d/%m/%Y"),"days"),
  ValueCol = data1$temp
)
dat[, ValueCol := ValueCol + (strftime(date,"%u") %in% c(6,7) * runif(1) * 0.75), .I]
dat[, ValueCol := ValueCol + (abs(as.numeric(strftime(date,"%m")) - 6.5)) * runif(1) * 0.75, .I]

dat$Year<- as.integer(strftime(dat$date, '%Y'))   #年份
dat$month <- as.integer(strftime(dat$date, '%m')) #月份
dat$week<- as.integer(strftime(dat$date, '%W'))   #周数

MonthLabels <- dat[,list(meanWkofYr = mean(week)), by = c('month') ]
MonthLabels$month <-month.abb[MonthLabels$month]

ggplot(data=dat,aes(date=date,fill=ValueCol))+
  stat_calendar_heatmap()+
  scale_fill_gradientn(colours= rev(brewer.pal(11,'Spectral')))+
  facet_wrap(~Year, ncol = 1,strip.position = "right")+
  scale_y_continuous(breaks=seq(7, 1, -1),labels=c("Mon","Tue","Wed","Thu","Fri","Sat","Sun"))+
  scale_x_continuous(breaks = MonthLabels[,meanWkofYr], labels = MonthLabels[, month],expand = c(0, 0)) +
  xlab(NULL)+
  ylab(NULL)+
  theme( panel.background = element_blank(),
         panel.border = element_rect(colour="grey60",fill=NA),
         strip.background = element_blank(),
         strip.text = element_text(size=13,face="plain",color="black"),
         axis.line=element_line(colour="black",size=0.25),
         axis.title=element_text(size=10,face="plain",color="black"),
         axis.text = element_text(size=10,face="plain",color="black"))

绘制堆积图
library(ggplot2)
library(RColorBrewer)
library(reshape2)
#导入数据
library(readxl)
mydata<- read_excel("taoData.xlsx")
head(mydata)
A tibble: 6 × 3
| date |
temp |
var |
|
|
|
| 2012-01-01 |
-6.70 |
平谷 |
| 2012-02-01 |
-4.37 |
平谷 |
| 2012-03-01 |
3.32 |
平谷 |
| 2012-04-01 |
13.62 |
平谷 |
| 2012-05-01 |
20.18 |
平谷 |
| 2012-06-01 |
22.53 |
平谷 |
mydata$date<-as.Date(mydata$date)
head(mydata)
A tibble: 6 × 3
| date |
temp |
var |
|
|
|
| 2012-01-01 |
-6.70 |
平谷 |
| 2012-02-01 |
-4.37 |
平谷 |
| 2012-03-01 |
3.32 |
平谷 |
| 2012-04-01 |
13.62 |
平谷 |
| 2012-05-01 |
20.18 |
平谷 |
| 2012-06-01 |
22.53 |
平谷 |
ggplot(mydata, aes(x =date, y = temp,fill=var) )+
  geom_area(position="stack",alpha=1)+
  geom_line(position="stack",size=0.25,color="black")+
  scale_x_date(date_labels = "%Y",date_breaks = "1 year")+
  xlab("Year")+
  ylab("Temp")+
  theme( axis.title=element_text(size=10,face="plain",color="black"),
         axis.text = element_text(size=10,face="plain",color="black"),
         legend.position = "right",
         legend.background = element_blank())

绘制多类别对比箱型图(带分布情况)
library(beanplot)
par(mai=c(0.5,0.5,0.25,1.2))
beanplot(temp~var, mydata,col = list("#FF6B5E", "#00C3C2"),
         side = "both",xlab ="city",ylab ="value")


