1、部署架构图

2、安装配置
2.1 下载安装包(如果下载慢,可以挂代理下载)
[root@ops001 ~]# ifconfig eth0
eth0: flags=4163  mtu 1500
        inet 172.18.23.253  netmask 255.255.240.0  broadcast 172.18.31.255
        ether 00:16:3e:08:aa:35  txqueuelen 1000  (Ethernet)
        RX packets 157447  bytes 200080723 (190.8 MiB)
        RX errors 0  dropped 0  overruns 0  frame 0
        TX packets 65973  bytes 15198101 (14.4 MiB)
        TX errors 0  dropped 0 overruns 0  carrier 0  collisions 0
[root@ops001 ~]# wget https://github.com/prometheus/prometheus/releases/download/v2.4.3/prometheus-2.4.3.linux-amd64.tar.gz
[root@ops001 ~]# wget https://github.com/prometheus/alertmanager/releases/download/v0.15.2/alertmanager-0.15.2.linux-amd64.tar.gz
[root@ops001 ~]# wget https://s3-us-west-2.amazonaws.com/grafana-releases/release/grafana-5.2.4.linux-amd64.tar.gz
[root@ops001 ~]# wget https://github.com/prometheus/node_exporter/releases/download/v0.16.0/node_exporter-0.16.0.linux-amd64.tar.gz
2.2 安装 prometheus(注意修改参数 --web.external-url= 的地址)
[root@ops001 ~]# tar xvf prometheus-2.4.3.linux-amd64.tar.gz -C /usr/local/
[root@ops001 ~]# vim /etc/systemd/system/prometheus.service
[Unit]
Description=Prometheus Server
Documentation=https://prometheus.io/docs/introduction/overview/
After=network-online.target

[Service]
Restart=on-failure
ExecStart=/usr/local/prometheus-2.4.3.linux-amd64/prometheus --config.file=/usr/local/prometheus-2.4.3.linux-amd64/prometheus.yml --storage.tsdb.path=/var/lib/prometheus --web.external-url=http://172.18.23.253:9090

[Install]
WantedBy=multi-user.target

[root@ops001  ~]# systemctl daemon-reload
[root@ops001  ~]# systemctl start prometheus
// 如果启动有问题,可以通过  /var/log/messages 查看报错原因
[root@ops001  ~]# systemctl status prometheus
[root@ops001  ~]# netstat -nltup|grep 9090
tcp6       0      0 :::9090                 :::*                    LISTEN      1352/prometheus

2.3 安装 Alertmanager
[root@ops001 ~]# tar xvf alertmanager-0.15.2.linux-amd64.tar.gz -C /usr/local/
[root@ops001 ~]# vim /etc/systemd/system/alertmanager.service
[Unit]
Description=Alertmanager
After=network-online.target

[Service]
Restart=on-failure
ExecStart=/usr/local/alertmanager-0.15.2.linux-amd64/alertmanager --config.file=/usr/local/alertmanager-0.15.2.linux-amd64/alertmanager.yml

[Install]
WantedBy=multi-user.target

[root@ops001  ~]# systemctl daemon-reload
[root@ops001  ~]# systemctl start alertmanager
[root@ops001  ~]# systemctl status alertmanager
[root@ops001  ~]# netstat -nltup|grep 9093
tcp6       0      0 :::9093                 :::*                    LISTEN      10597/alertmanager

2.4 安装 grafana
[root@ops001 ~]# tar xvf grafana-5.2.4.linux-amd64.tar.gz -C /usr/local/
[root@ops001 ~]# vim /etc/systemd/system/grafana-server.service
[Unit]
Description=Grafana Server
After=network-online.target

[Service]
Restart=on-failure
ExecStart=/usr/local/grafana-5.2.4/bin/grafana-server -config /usr/local/grafana-5.2.4/conf/defaults.ini -homepath /usr/local/grafana-5.2.4

[Install]
WantedBy=multi-user.target

[root@ops001  ~]# systemctl daemon-reload
[root@ops001  ~]# systemctl start grafana-server
[root@ops001  ~]# systemctl status grafana-server
[root@ops001  ~]# netstat -nltup|grep 3000
tcp6       0      0 :::3000                 :::*                    LISTEN      10760/grafana-serve

grafana 初始账号密码:admin/admin
3、告警配置
3.1 安装 node_exporter
[root@ops001 ~]# tar xvf node_exporter-0.16.0.linux-amd64.tar.gz -C /usr/local/
[root@ops001 ~]# vim /etc/systemd/system/node_exporter.service
[Unit]
Description=node_exporter
After=network.target

[Service]
Restart=on-failure
ExecStart=/usr/local/node_exporter-0.16.0.linux-amd64/node_exporter

[Install]
WantedBy=multi-user.target

[root@ops001  ~]# systemctl daemon-reload
[root@ops001  ~]# systemctl start node_exporter
[root@ops001  ~]# systemctl status node_exporter
[root@ops001  ~]# netstat -nltup|grep 9100
tcp6       0      0 :::9100                 :::*                    LISTEN      10808/node_exporter
3.2 实现钉钉告警相关配置
开通钉钉告警机器人


钉钉告警会用到上图的 接收群组的值:SRE 和 webhook 的值 :https://oapi.dingtalk.com/robot/send?access_token=分配的 token 值
配置 prometheus-webhook-dingtalk
[root@ops001 ~]# wget https://github.com/timonwong/prometheus-webhook-dingtalk/releases/download/v0.3.0/prometheus-webhook-dingtalk-0.3.0.linux-amd64.tar.gz
[root@ops001 ~]# tar xvf prometheus-webhook-dingtalk-0.3.0.linux-amd64.tar.gz -C /usr/local/
// 使用方法:prometheus-webhook-dingtalk --ding.profile=钉钉接收群组的值=webhook的值
[root@ops001 ~]# vim /etc/systemd/system/prometheus-webhook-dingtalk.service
[Unit]
Description=prometheus-webhook-dingtalk
After=network-online.target

[Service]
Restart=on-failure
ExecStart=/usr/local/prometheus-webhook-dingtalk-0.3.0.linux-amd64/prometheus-webhook-dingtalk --ding.profile=sre=https://oapi.dingtalk.com/robot/send?access_token=分配的 token 值

[Install]
WantedBy=multi-user.target

[root@ops001 ~]# systemctl daemon-reload
[root@ops001 ~]# systemctl start prometheus-webhook-dingtalk
[root@ops001 ~]# systemctl status prometheus-webhook-dingtalk
[root@ops001 ~]# netstat -nltup|grep 8060
tcp6       0      0 :::8060                 :::*                    LISTEN      10973/prometheus-we
3.3 prometheus 配置连通 alertmanager,配置告警规则
[root@ops001 ~]# cd /usr/local/prometheus-2.4.3.linux-amd64/
[root@ops001 prometheus-2.4.3.linux-amd64]# vim prometheus.yml
# my global config
global:
  scrape_interval:     15s # Set the scrape interval to every 15 seconds. Default is every 1 minute.
  evaluation_interval: 15s # Evaluate rules every 15 seconds. The default is every 1 minute.
  # scrape_timeout is set to the global default (10s).

# Alertmanager configuration
alerting:
  alertmanagers:
  - static_configs:
    - targets:
      - 'localhost:9093'    # 配置连通 alertmanager

# Load rules once and periodically evaluate them according to the global 'evaluation_interval'.
rule_files:
  - "rules/host_rules.yml"    # 配置告警规则目录文件
  # - "second_rules.yml"

# A scrape configuration containing exactly one endpoint to scrape:
# Here it's Prometheus itself.
scrape_configs:
  # The job name is added as a label `job=` to any timeseries scraped from this config.
  - job_name: 'prometheus'

    # metrics_path defaults to '/metrics'
    # scheme defaults to 'http'.

    static_configs:
    - targets: ['localhost:9090']    # 收集 prometheus 服务本身的信息

  - file_sd_configs:
    - files:
      - 'configs/host.yml'    # 配置 node_exporter 要收集信息的主机列表
    job_name: Host
    metrics_path: /metrics
    relabel_configs:
    - source_labels: [__address__]
      regex: (.*)
      target_label: instance
      replacement: $1
    - source_labels: [__address__]
      regex: (.*)
      target_label: __address__
      replacement: $1:9100

[root@ops001 prometheus-2.4.3.linux-amd64]# mkdir {configs,rules}
// 配置告警规则,如果主机 down 了,就触发告警
[root@ops001 prometheus-2.4.3.linux-amd64]# vim rules/host_rules.yml
groups:
- name: 'Linux Instances'
  rules:
  - alert: InstanceDown
    expr: up == 0
    for: 5s
    labels:
      severity: page
    # Prometheus templates apply here in the annotation and label fields of the alert.
    annotations:
      description: '{{ $labels.instance }} of job {{ $labels.job }} has been down for more than 5 s.'


// 配置 node_exporter 要收集 172.18.23.253 的主机信息
[root@ops001 prometheus-2.4.3.linux-amd64]# vim configs/host.yml
- labels:
    service: test
  targets:
  - 172.18.23.253

[root@ops001 prometheus-2.4.3.linux-amd64]# systemctl restart prometheus
[root@ops001 prometheus-2.4.3.linux-amd64]# systemctl status prometheus

3.4 配置 alertmanager 的邮件发送方和对接钉钉 webhook
[root@ops001 ~]# cd /usr/local/alertmanager-0.15.2.linux-amd64/
[root@ops001 alertmanager-0.15.2.linux-amd64]# vim alertmanager.yml
global:
  resolve_timeout: 5m
  # 配置邮件发送方信息
  smtp_smarthost: 'smtp.sina.com:465'
  smtp_from: '[email protected]'
  smtp_auth_username: '[email protected]'
  smtp_auth_password: 'xxx'
  smtp_require_tls: false

templates:
 - '/usr/local/alertmanager-0.15.2.linux-amd64/template/*.tmpl'

route:
  group_by: ['alertname', 'cluster', 'service']
  group_wait: 30s
  group_interval: 5m
  repeat_interval: 10m
  receiver: 'default-receiver'

receivers:
- name: 'default-receiver'
  email_configs:
  # 配置邮件接收方
  - to: '[email protected]'
    send_resolved: true
  # 配置连接 prometheus-webhook-dingtalk 启动的服务
  webhook_configs:
  - url: 'http://localhost:8060/dingtalk/sre/send'
    send_resolved: true
[root@ops001 alertmanager-0.15.2.linux-amd64]# systemctl start alertmanager
[root@ops001 alertmanager-0.15.2.linux-amd64]# systemctl status alertmanager
至此,简单的告警部分配置完成了
3.5、配置 grafana 展示 prometheus 的信息
从这个地址下载 node_exporter 的 grafana 模板文件:https://grafana.com/dashboards/405,导入 grafana 中,具体步骤如下

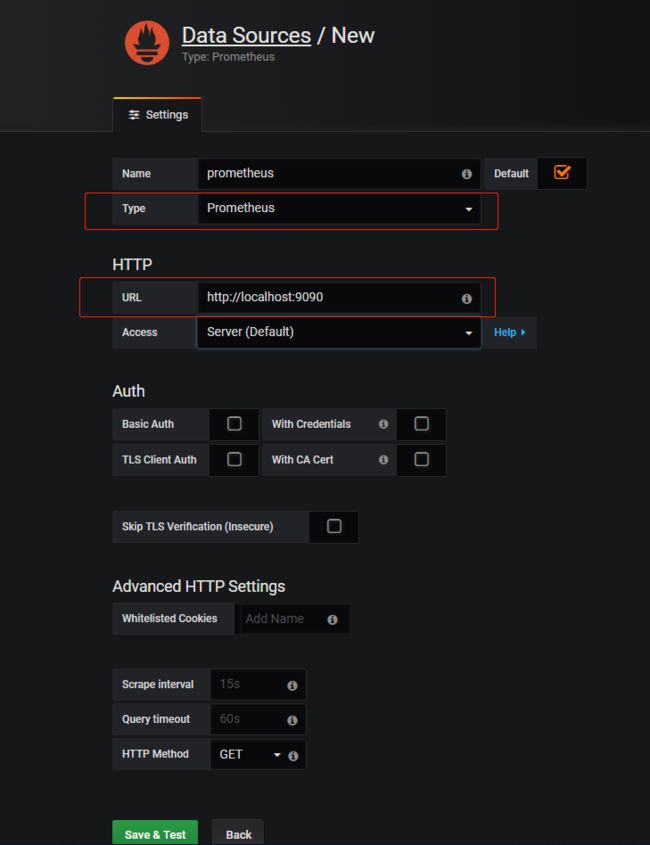


可以看到 grafana 展示的 prometheus 主机信息了
3.6、测试告警是否配置生效,通过停止 node_exporter 来模拟主机宕机
[root@ops001 ~]# systemctl stop node_exporter
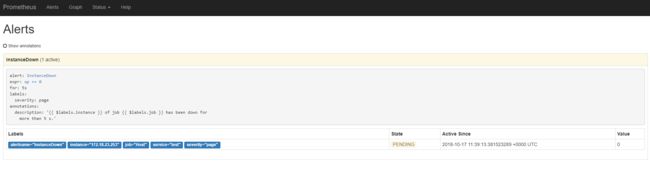


18.png

可以看到邮件和钉钉告警都生效了
重新启动 node_exporter,模拟主机恢复正常
[root@ops001 ~]# systemctl start node_exporter

