Hotel booking酒店预订——数据分析与建模:https://zhuanlan.zhihu.com/p/196757364?utm_source=wechat_session

数据源:
https://www.sciencedirect.com/science/article/pii/S2352340918315191
字段解释:
- hotel 酒店
- is_canceled 是否取消
- lead_time 预订时间
- arrival_date_year 入住年份
- arrival_date_month 入住月份
- arrival_date_week_number 入住周次
- arrival_date_day_of_month 入住天号
- stays_in_weekend_nights 周末夜晚数
- stays_in_week_nights 工作日夜晚数
- adults 成人数量
- children 儿童数量
- babies 幼儿数量
- meal 餐食
- country 国家
- market_segment 细分市场
- distribution_channel 分销渠道
- is_repeated_guest 是否是回头客
- previous_cancellations 先前取消数
- previous_bookings_not_canceled 先前未取消数
- reserved_room_type 预订房间类型
- assigned_room_type 实际房间类型
- booking_changes 预订更改数
- deposit_type 押金方式
- agent 代理
- company 公司
- days_in_waiting_list 排队天数
- customer_type 客户类型
- adr 每日房间均价 (Average Daily Rate)
- required_car_parking_spaces 停车位数量
- total_of_special_requests 特殊需求数(例如高层或双床)
- reservation_status 订单状态
- reservation_status_date 订单状态确定日期
一. 探索性数据分析(EDA)
该数据集包含两家酒店的数据,一家假日酒店,一家城市酒店。从数据集发布地址的介绍来看,这两家酒店均位于葡萄牙。第一家酒店位于阿尔加夫市的度假区。第二家酒店位于首都里斯本的市区。两家酒店距离280公里的车程,并且均位于北大西洋海沿岸。
该数据集包括从2015年7月1日到2017年8月31日酒店的订单信息
注意:对于大多数问题,要用那些未取消的订单来计算实际的客人数量。显而易见,这点非常重要。
从该数据集中我们能得到解答的问题如下:
- 顾客来自于哪里?
- 房客每晚会花费多少钱?
- 一年中的过夜房价如何变动?
- 最忙的月份是几月?
- 人们会在酒店住多久?
- 订单的市场渠道构成
- 有多少订单被取消了?
- 那个月份的订单取消率最高?
你是否有其他问题?可以随时记录下来,并尝试用数据解答它们。
二. 取消率预测(Predicting cancelations)
酒店的管理者期望能够建立一个预测顾客是否实际入住的模型。
这个模型将有助于酒店提前规划所需人力和提供餐饮。
通常为了利益最大化,有些酒店利用这个模型去超额接收订单。
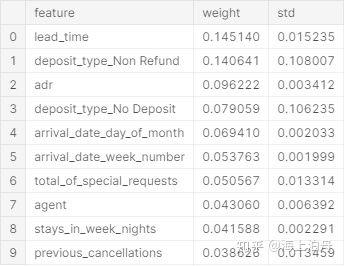
三. 评估特征重要性(Evaluate Feature importance)
得出哪些特征对于取消率预测来说最重要?
1.探索性数据分析
1.1模块导入及数据概览
# 通用模块
import pandas as pd
import matplotlib.pyplot as plt
import seaborn as sns
import numpy as np
import plotly.express as px
import folium
# 机器学习
from sklearn.model_selection import train_test_split, KFold, cross_validate, cross_val_score
from sklearn.pipeline import Pipeline
from sklearn.compose import ColumnTransformer
from sklearn.preprocessing import LabelEncoder, OneHotEncoder
from sklearn.impute import SimpleImputer
from sklearn.ensemble import RandomForestClassifier
from xgboost import XGBClassifier
from sklearn.linear_model import LogisticRegression
from sklearn.tree import DecisionTreeClassifier
from sklearn.metrics import accuracy_score
import eli5 # Feature importance evaluation
设定sns风格和DataFrame最大显示列数
sns.set(style=“whitegrid”)
pd.set_option(“display.max_columns”, 36)
导入数据(119391条)
file_path = “E:/源文件备份/Kaggle练/hotel_booking/hotel_bookings.csv”
full_data = pd.read_csv(file_path)
#预览数据
full_data.head()
#查看各字段属性
full_data.info
#查看数据大小
full_data.shape
#查看数据数据及分布
full_data.describe()
1.2数据分析前的预处理
#查看缺失项

full_data.isnull().sum()

#得出children,country,agent,company四个字段含有缺失项
替换缺失值
#agent一栏若是缺失的,那么这个订单很可能没有代理。
#company一栏若是缺失的,可能是私人预订。
#其他列比较简单,无需说明。
#构造映射字典
nan_replacements = {“children:”: 0.0,“country”: “Unknown”, “agent”: 0, “company”: 0}
#替换缺失项得到新数据
full_data_cln = full_data.fillna(nan_replacements)
#替换full_data_cln中不规范值
#meal字段包含’Undefined’意味着自带食物SC
#关于meal字段缩写代表的意义,########333
full_data_cln[“meal”].replace(“Undefined”, “SC”, inplace=True)
#目前full_data_cln中一些记录的总人数为0,因此要将这些记录行去掉
#取得入住人数为0的行号
#将这些行在full_data_cln中删除
zero_guests = list(full_data_cln.loc[full_data_cln[“adults”]
+ full_data_cln[“children”]
+ full_data_cln[“babies”]==0].index)
full_data_cln.drop(full_data_cln.index[zero_guests], inplace=True)
#查看清洗后的数据大小:
full_data_cln.shape
#要计算实际的订单数就要去除那些被取消的订单
#为了好理解,数据清洗后,将两家酒店的数据分开
#从full_data_cln中分出两个酒店的未取消订单数据rh和ch
rh = full_data_cln.loc[(full_data_cln[“hotel”] == “Resort Hotel”) & (full_data_cln[“is_canceled”] == 0)]
ch = full_data_cln.loc[(full_data_cln[“hotel”] == “City Hotel”) & (full_data_cln[“is_canceled”] == 0)]
1.3数据分析及可视化
1.3.1顾客来自于哪里?(饼图、地图)
country_data = pd.DataFrame(full_data_cln.loc[full_data_cln[“is_canceled”] == 0][“country”].value_counts())
#得出不同国家的顾客人数
country_data = pd.DataFrame(full_data_cln.loc[full_data_cln[“is_canceled”] == 0][“country”].value_counts())
country_data.rename(columns={“country”: “Number of Guests”}, inplace=True)
total_guests = country_data[“Number of Guests”].sum()
country_data[“Guests in %”] = round(country_data[“Number of Guests”] / total_guests * 100, 2)
country_data[“country”] = country_data.index
pie plot 制作饼图
fig = px.pie(country_data,
values=“Number of Guests”,
names=“country”,
title=“Home country of guests”,
template=“seaborn”)
fig.update_traces(textposition=“inside”, textinfo=“value+percent+label”)
fig.show()

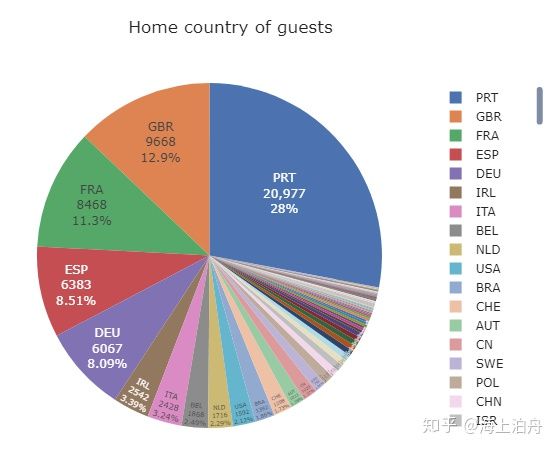
可以看出大部分订单来自葡萄牙本国及英国、法国、西班牙、德国等欧洲邻国。
# show on map  制作地图

guest_map = px.choropleth(country_data,

locations=country_data.index,

color=country_data[“Guests in %”],

hover_name=country_data.index,

color_continuous_scale=px.colors.sequential.Plasma,

title=“Home country of guests”)

guest_map.show()
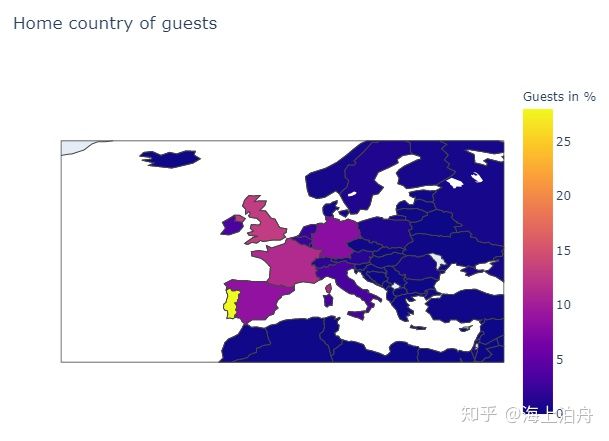

可以看出大部分订单来自葡萄牙本地及英国、法国、西班牙、德国等欧洲邻国。
1.3.2哪家酒店价格平均价格更高些?每个房客在不同类型的房间每晚会花费多少钱?(箱型图)
rh[‘adr_pp’] = rh[‘adr’]/(rh[‘adults’]+rh[‘children’])

ch[‘adr_pp’] = ch[‘adr’]/(ch[‘adults’]+ch[‘children’])
rh.head()
print(""“计入人数与餐饮得出的人均价格为
Resort hotel: {:.2f} € per night and person.
City hotel: {:.2f} € per night and person.”"".format(rh[‘adr_pp’].mean(),ch[‘adr_pp’].mean()))


城市酒店平均价格比度假酒店平均价格要高。(城市酒店一般处在市中心,所以房价贵些)
#标准化adr字段

full_data_cln[“adr_pp”] = full_data_cln[“adr”] / (full_data_cln[“adults”] + full_data_cln[“children”])

#full_data_cln此前已经去掉了入住人数为0的记录,此处只需把取消订单筛选掉再赋给full_data_guests

full_data_guests = full_data_cln.loc[full_data_cln[“is_canceled”] == 0]

room_prices = full_data_guests[[“hotel”, “reserved_room_type”, “adr_pp”]].sort_values(“reserved_room_type”)
#作箱型图
plt.figure(figsize=(12, 8))
sns.boxplot(x=“reserved_room_type”,
y=“adr_pp”,
hue=“hotel”,
data=room_prices,
hue_order=[“City Hotel”, “Resort Hotel”],
fliersize=0)
plt.title(“Price of room types per night and person”, fontsize=16)
plt.xlabel(“Room type”, fontsize=16)
plt.ylabel(“Price [EUR]”, fontsize=16)
plt.legend(loc=“upper right”)
plt.ylim(0, 160)
plt.show()


1.3.3 一年中的过夜房价如何变动?(有标准差带的折线图)
# 简单起见,这里不考虑房间类型和餐食,直接按照每人每天的价格取平均值代表当月均价
筛选关键字段
room_prices_mothly = full_data_guests[[“hotel”, “arrival_date_month”, “adr_pp”]].sort_values(“arrival_date_month”)
生成月份排序列表
ordered_months = [“January”, “February”, “March”, “April”, “May”, “June”,
“July”, “August”, “September”, “October”, “November”, “December”]
#将room_prices_mothly中的arrival_date_month转换成带顺序的格式
room_prices_mothly[“arrival_date_month”] = pd.Categorical(room_prices_mothly[“arrival_date_month”], categories=ordered_months, ordered=True)
制作折线图
注意:这里ci=“sd”,选用当月adr_pp标准差的2倍作为置信带的宽度
plt.figure(figsize=(12, 8))
sns.lineplot(x = “arrival_date_month”, y=“adr_pp”, hue=“hotel”, data=room_prices_mothly,
hue_order = [“City Hotel”, “Resort Hotel”], ci=“sd”, size=“hotel”, sizes=(2.5, 2.5))
plt.title(“Room price per night and person over the year”, fontsize=16)
plt.xlabel(“Month”, fontsize=16)
plt.xticks(rotation=45)
plt.ylabel(“Price [EUR]”, fontsize=16)
plt.show()


可以看出度假酒店6、7、8月份(夏天)价格较高,在其他月份价格较低。城市酒店全年价格变动不大,在春季和秋季价格最高。
1.3.4最忙的月份是几月?(折线图)
# 构造数据(由于rh和ch先前已经去掉了人数为0和被取消的订单,所以直接按照入住月聚合计数即可)

resort_guests_monthly = rh.groupby(“arrival_date_month”)[“hotel”].count()

city_guests_monthly = ch.groupby(“arrival_date_month”)[“hotel”].count()
resort_guest_data = pd.DataFrame({“month”: list(resort_guests_monthly.index),
“hotel”: “Resort hotel”,
“guests”: list(resort_guests_monthly.values)})
city_guest_data = pd.DataFrame({“month”: list(city_guests_monthly.index),
“hotel”: “City hotel”,
“guests”: list(city_guests_monthly.values)})
#合并数据
full_guest_data = pd.concat([resort_guest_data,city_guest_data], ignore_index=True)
#生成月份排序列表
ordered_months = [“January”, “February”, “March”, “April”, “May”, “June”,
“July”, “August”, “September”, “October”, “November”, “December”]
full_guest_data[“month”] = pd.Categorical(full_guest_data[“month”], categories=ordered_months, ordered=True)
#由于该数据集包括从2015年7月1日到2017年8月31日酒店的订单信息。
#因此,需要特别注意:由此聚合而来的数据,七月和八月包括15、16、17三年的订单,其他月份都是两年的订单。所以需要分别计算平均值。
full_guest_data.loc[(full_guest_data[“month”] == “July”) | (full_guest_data[“month”] == “August”),
“guests”] /= 3
full_guest_data.loc[~((full_guest_data[“month”] == “July”) | (full_guest_data[“month”] == “August”)),
“guests”] /= 2
#制作折线图
plt.figure(figsize=(12, 8))
sns.lineplot(x = “month”, y=“guests”, hue=“hotel”, data=full_guest_data,
hue_order = [“City hotel”, “Resort hotel”], size=“hotel”, sizes=(2.5, 2.5))
plt.title(“Average number of hotel guests per month”, fontsize=16)
plt.xlabel(“Month”, fontsize=16)
plt.xticks(rotation=45)
plt.ylabel(“Number of guests”, fontsize=16)
plt.show()
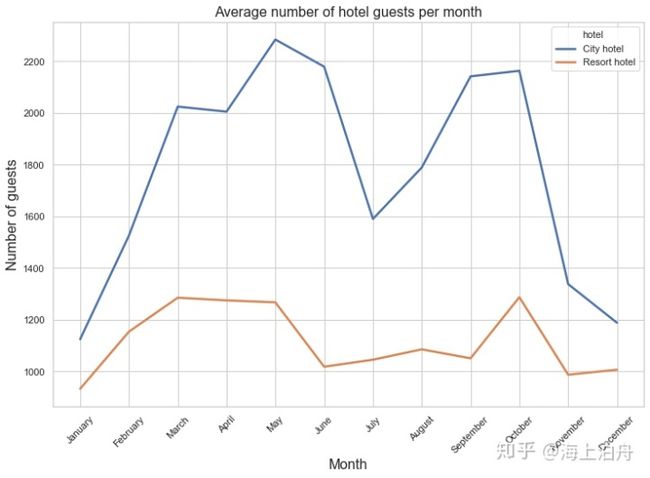
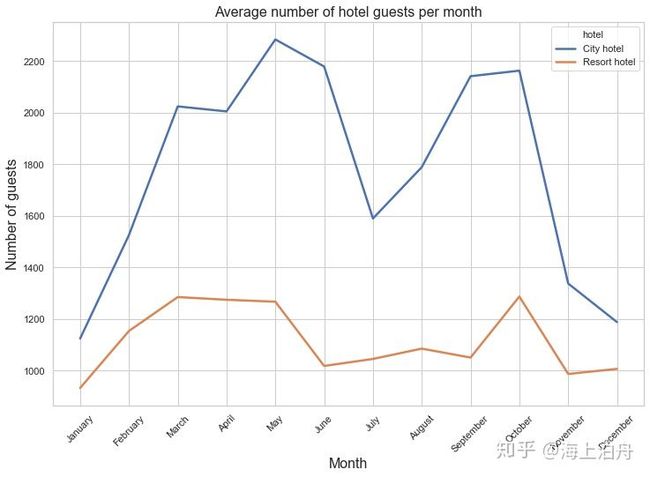
城市酒店在春季和秋季客人较多,这时的价格最高。在七、八月客人较少,价格也低一些。度假酒店在六月到九月人数较少,这时价格最高。在冬季两家酒店的客人最少。
1.3.5客人在酒店一般住多久?(柱状图)
# 构造数据

rh[“total_nights”] = rh[“stays_in_weekend_nights”] + rh[“stays_in_week_nights”]

ch[“total_nights”] = ch[“stays_in_weekend_nights”] + ch[“stays_in_week_nights”]
num_nights_res = list(rh[“total_nights”].value_counts().index)
num_bookings_res = list(rh[“total_nights”].value_counts())
rel_bookings_res = rh[“total_nights”].value_counts() / sum(num_bookings_res) * 100
num_nights_cty = list(ch[“total_nights”].value_counts().index)
num_bookings_cty = list(ch[“total_nights”].value_counts())
rel_bookings_cty = ch[“total_nights”].value_counts() / sum(num_bookings_cty) * 100
res_nights = pd.DataFrame({“hotel”: “Resort hotel”,
“num_nights”: num_nights_res,
“rel_num_bookings”: rel_bookings_res})
cty_nights = pd.DataFrame({“hotel”: “City hotel”,
“num_nights”: num_nights_cty,
“rel_num_bookings”: rel_bookings_cty})
nights_data = pd.concat([res_nights, cty_nights], ignore_index=True)
#show figure:
plt.figure(figsize=(16, 8))
sns.barplot(x = “num_nights”, y = “rel_num_bookings”, hue=“hotel”, data=nights_data,
hue_order = [“City hotel”, “Resort hotel”])
plt.title(“Length of stay”, fontsize=16)
plt.xlabel(“Number of nights”, fontsize=16)
plt.ylabel(“Guests [%]”, fontsize=16)
plt.legend(loc=“upper right”)
plt.xlim(0,22)
plt.show()

avg_nights_res = sum(list((res_nights[“num_nights”] * (res_nights[“rel_num_bookings”]/100)).values))

avg_nights_cty = sum(list((cty_nights[“num_nights”] * (cty_nights[“rel_num_bookings”]/100)).values))

print(f"On average, guests of the City hotel stay {avg_nights_cty:.2f} nights, and {cty_nights[‘num_nights’].max()} at maximum.")

print(f"On average, guests of the Resort hotel stay {avg_nights_res:.2f} nights, and {res_nights[‘num_nights’].max()} at maximum.")


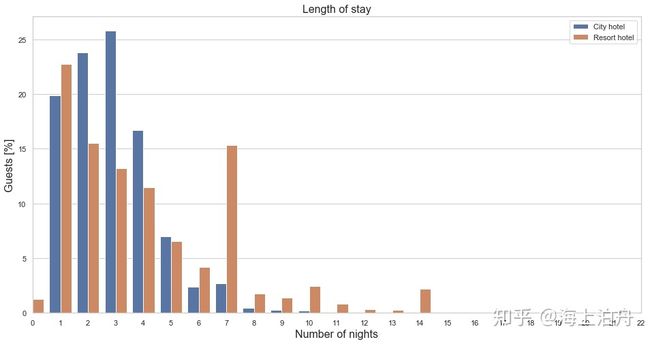
城市酒店预订较多的是1-4晚,度假酒店除了1-4晚之外,预订一周7晚也占了一定比例。
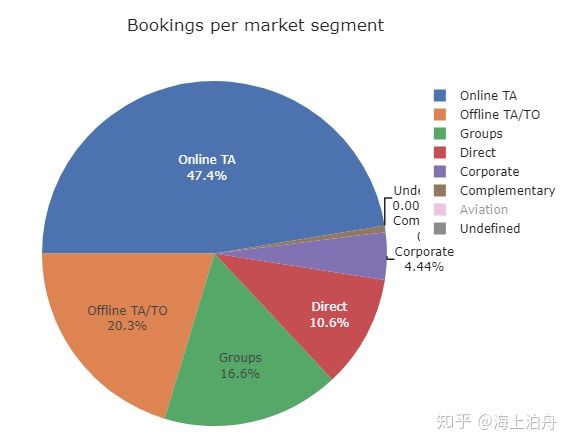
1.3.6订单的市场渠道构成是怎样的?不同渠道的订单的不同房间价格如何分布?(用饼图和带置信区间的柱状图展示)
# 这里只是为了了解市场渠道占比,所以取消的和未取消的订单都要计入在内
此处用full_data_cln的market_segment字段直接进行计数统计
segments=full_data_cln[“market_segment”].value_counts()
制作饼图
fig = px.pie(segments,
values=segments.values,
names=segments.index,
title=“Bookings per market segment”,
template=“seaborn”)
fig.update_traces(rotation=-90, textinfo=“percent+label”)
fig.show()

plt.figure(figsize=(12, 8))

sns.barplot(x=“market_segment”,

y=“adr_pp”,

hue=“reserved_room_type”,

data=full_data_cln,

ci=“sd”,

errwidth=1,

capsize=0.1)

plt.title(“ADR by market segment and room type”, fontsize=16)

plt.xlabel(“Market segment”, fontsize=16)

plt.xticks(rotation=45)

plt.ylabel(“ADR per person [EUR]”, fontsize=16)

plt.legend(loc=“upper left”)

plt.show()
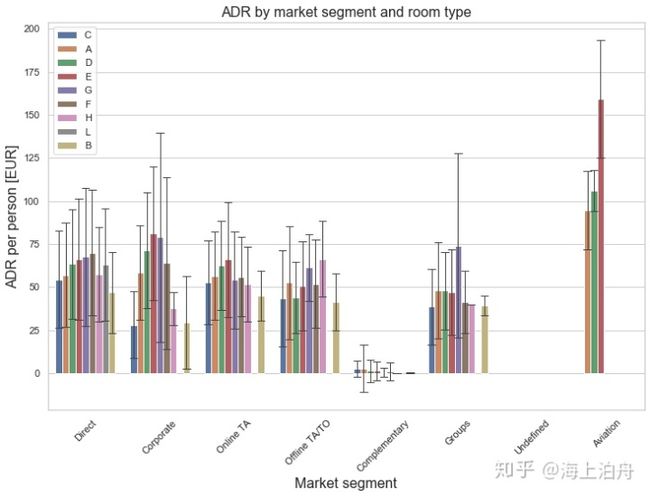

上图表明来自航空公司的订单明显高于其他渠道,下面我们将航空公司渠道和其他渠道的"is_canceled",“adults”,“lead_time”,"adr_pp"四个字段参数做一个统计,比较看有何不同,试着找出原因。
Airline_data = full_data_cln.loc[full_data_cln[“market_segment”]== “Aviation”][[“is_canceled”,

“adults”,

“lead_time”,

“adr_pp”,]].describe()
Non_Airline_data = full_data_cln.loc[full_data_cln[“market_segment”]!= “Aviation”][[“is_canceled”,
“adults”,
“lead_time”,
“adr_pp”,]].describe()

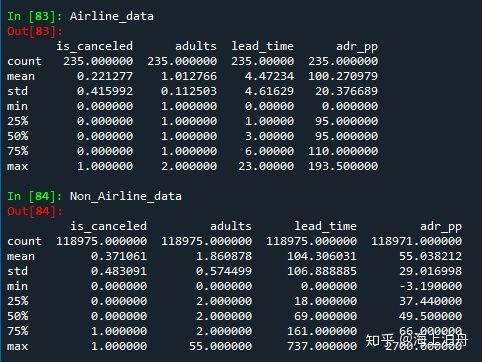
由统计数据可得,航空公司渠道和非航空公司渠道平均预订时间分别为:4天和104天。
根据常识,航空公司的机组人员一般都会住在酒店,需求较大。而且和家庭住客多人住一间酒店相比每个机组人员通常会自己住一个房间
因此,预订时间短、每人一间房这两个原因导致机组人员平均的每人每日房费会高出近一倍。
1.3.7 有多少订单被取消了?
# 计算取消数:

total_cancelations = full_data_cln[“is_canceled”].sum()

rh_cancelations = full_data_cln.loc[full_data_cln[“hotel”] == “Resort Hotel”][“is_canceled”].sum()

ch_cancelations = full_data_cln.loc[full_data_cln[“hotel”] == “City Hotel”][“is_canceled”].sum()
计算取消率:
rel_cancel = total_cancelations / full_data_cln.shape[0] * 100
rh_rel_cancel = rh_cancelations / full_data_cln.loc[full_data_cln[“hotel”] == “Resort Hotel”].shape[0] * 100
ch_rel_cancel = ch_cancelations / full_data_cln.loc[full_data_cln[“hotel”] == “City Hotel”].shape[0] * 100
print(f"Total bookings canceled: {total_cancelations:,} ({rel_cancel:.0f} %)")
print(f"Resort hotel bookings canceled: {rh_cancelations:,} ({rh_rel_cancel:.0f} %)")
print(f"City hotel bookings canceled: {ch_cancelations:,} ({ch_rel_cancel:.0f} %)")


城市酒店的取消率较高,将近一半订单被取消
1.3.8 哪些月份的订单取消率较高?(柱状图)
# 构造数据

res_book_per_month = full_data_cln.loc[(full_data_cln[“hotel”] == “Resort Hotel”)].groupby(“arrival_date_month”)[“hotel”].count()

res_cancel_per_month = full_data_cln.loc[(full_data_cln[“hotel”] == “Resort Hotel”)].groupby(“arrival_date_month”)[“is_canceled”].sum()
cty_book_per_month = full_data_cln.loc[(full_data_cln[“hotel”] == “City Hotel”)].groupby(“arrival_date_month”)[“hotel”].count()
cty_cancel_per_month = full_data_cln.loc[(full_data_cln[“hotel”] == “City Hotel”)].groupby(“arrival_date_month”)[“is_canceled”].sum()
res_cancel_data = pd.DataFrame({“Hotel”: “Resort Hotel”,
“Month”: list(res_book_per_month.index),
“Bookings”: list(res_book_per_month.values),
“Cancelations”: list(res_cancel_per_month.values)})
cty_cancel_data = pd.DataFrame({“Hotel”: “City Hotel”,
“Month”: list(cty_book_per_month.index),
“Bookings”: list(cty_book_per_month.values),
“Cancelations”: list(cty_cancel_per_month.values)})
full_cancel_data = pd.concat([res_cancel_data, cty_cancel_data], ignore_index=True)
full_cancel_data[“cancel_percent”] = full_cancel_data[“Cancelations”] / full_cancel_data[“Bookings”] * 100
#生成月份排序列表
ordered_months = [“January”, “February”, “March”, “April”, “May”, “June”,
“July”, “August”, “September”, “October”, “November”, “December”]
full_cancel_data[“Month”] = pd.Categorical(full_cancel_data[“Month”], categories=ordered_months, ordered=True)
制作柱状图
plt.figure(figsize=(12, 8))
sns.barplot(x = “Month”, y = “cancel_percent” , hue=“Hotel”,
hue_order = [“City Hotel”, “Resort Hotel”], data=full_cancel_data)
plt.title(“Cancelations per month”, fontsize=16)
plt.xlabel(“Month”, fontsize=16)
plt.xticks(rotation=45)
plt.ylabel(“Cancelations [%]”, fontsize=16)
plt.legend(loc=“upper right”)
plt.show()
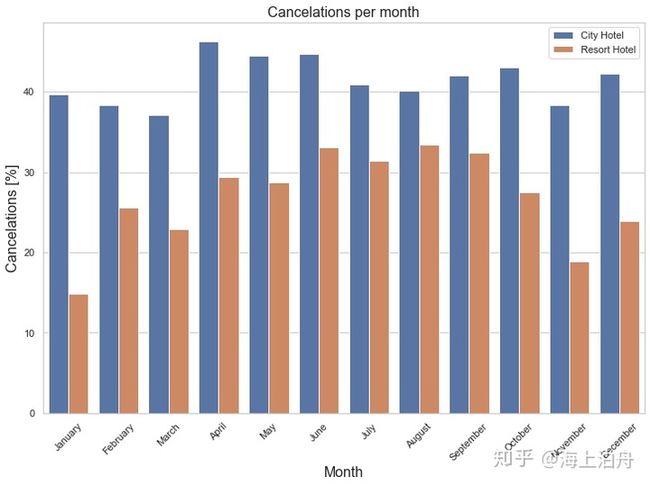
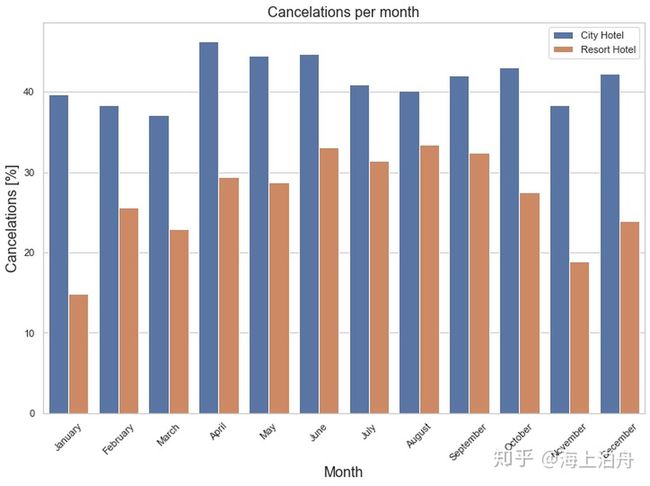
城市酒店的订单取消率全年都在40%浮动,度假酒店取消率在夏季较高,在冬季较低。
2.取消率预测
2.1 建模前查看哪些数值型特征与取消的结果相关性较高,并根据实际做筛选
cancel_corr = full_data.corr()[“is_canceled”]

cancel_corr.abs().sort_values(ascending=False)[1:]
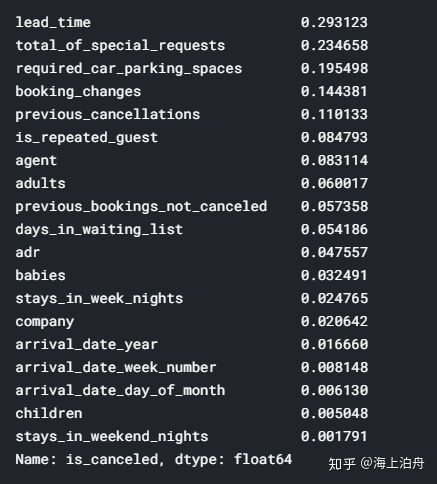

由上表可知lead_time, total_of_special_requests, required_car_parking_spaces, booking_changes , previous_cancellations是最重要的5个数值型特征。
然而,将来要预测一个订单是否会被取消,由于特征中的the number of booking changes随时间是可能发生变化的,只有在订单完成或取消后才能够知道最终的值,所以它是无法用于预测订单是否取消的的。同样的原因days_in_waiting_list、reservation_status也无法使用。
至于arrival_date_year,个人觉得现有的样本仅有两年的数据而且不完整(15年下半年、16年全年、17年上半年),所以在年份的维度上不足以用于预测,也应予以排除。
为了使模型更加通用,assigned_room_type和country也被排除。
# 手动选择进行建模的数值和分类的特征

num_features = [“lead_time”,“arrival_date_week_number”,“arrival_date_day_of_month”,

“stays_in_weekend_nights”,“stays_in_week_nights”,“adults”,“children”,

“babies”,“is_repeated_guest”, “previous_cancellations”,

“previous_bookings_not_canceled”,“agent”,“company”,

“required_car_parking_spaces”, “total_of_special_requests”, “adr”]
cat_features = [“hotel”,“arrival_date_month”,“meal”,“market_segment”,
“distribution_channel”,“reserved_room_type”,“deposit_type”,“customer_type”]
2.2建模前的特征预处理
# 将特征值和标签值分开为X,y

features = num_features + cat_features

X = full_data[features]

y = full_data[“is_canceled”]
预处理数值型特征
对于大多数数值型特征而言(除了日期以外),0是一个符合逻辑的填充值。
由于日期列均没有数据缺失,因此这里fill_value默认为0。
num_transformer = SimpleImputer(strategy=“constant”)
预处理分类型特征(填充缺失值、独热编码)
cat_transformer = Pipeline(steps=[
(“imputer”, SimpleImputer(strategy=“constant”, fill_value=“Unknown”)),
(“onehot”, OneHotEncoder(handle_unknown=‘ignore’))])
将两部分的预处理捆绑,并制定对象
preprocessor = ColumnTransformer(transformers=[(“num”, num_transformer, num_features),
(“cat”, cat_transformer, cat_features)])
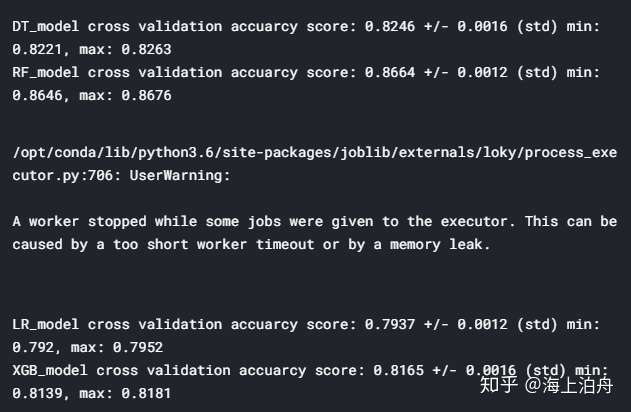
2.3 交叉验证不同的模型
# 定义4种模型:

base_models = [(“DT_model”, DecisionTreeClassifier(random_state=42)),

(“RF_model”, RandomForestClassifier(random_state=42,n_jobs=-1)),

(“LR_model”, LogisticRegression(random_state=42,n_jobs=-1)),

(“XGB_model”, XGBClassifier(random_state=42, n_jobs=-1))]
设定交叉验证的组数
4 = 75% 用于训练, 25% 用于验证
用shuffle确保数据的随机
kfolds = 4
split = KFold(n_splits=kfolds, shuffle=True, random_state=42)
处理, 拟合, 并为每个模型打分:
for name, model in base_models:
# 将数据的预处理和建模包含在 pipeline中:
model_steps = Pipeline(steps=[(‘preprocessor’, preprocessor),
(‘model’, model)])
# 为每个模型做交叉验证:
cv_results = cross_val_score(model_steps,
                             X, y,
                             cv=split,
                             scoring="accuracy",
                             n_jobs=-1)
# 输出得分
min_score = round(min(cv_results), 4)
max_score = round(max(cv_results), 4)
mean_score = round(np.mean(cv_results), 4)
std_dev = round(np.std(cv_results), 4)
print(f"{name} cross validation accuarcy score: {mean_score} +/- {std_dev} (std) min: {min_score}, max: {max_score}")


