R语言test函数均值和方差的检验
文章目录
-
-
-
- 单个正态总体均值的检验
- 均值已知,方差未知的单样本t检验
- 双样本的t检验
- 正态总体方差的检验
- 二项分布的假设检验
-
-
单个正态总体均值的检验
library(BSDA)
a <- c(8.05,8.15,8.2,8.1,8.25)
z.test(x=a,mu=8,sigma.x=0.2,alternative="two.sided")

	One-sample z-Test

data:  a
z = 1.6771, p-value = 0.09353
alternative hypothesis: true mean is not equal to 8
95 percent confidence interval:
 7.974695 8.325305
sample estimates:
mean of x
     8.15
均值已知,方差未知的单样本t检验
σ 未 知 时 的 t 检 验 t = x − μ S / n \sigma未知时的t检验\\ t = \frac{x-\mu}{S/\sqrt{n}} σ未知时的t检验t=S/nx−μ
	One Sample t-test

data:  k
t = -2.7951, df = 4, p-value = 0.04906
alternative hypothesis: true mean is not equal to 240
95 percent confidence interval:
 239.0033 239.9967
sample estimates:
mean of x
    239.5

k<-c(239.7,239.6,239,240,239.2)
t.test(k,alternative = "two.sided",mu = 240)
双样本的t检验
x<-c(76.43,76.21,73.58,69.69,65.29,70.83,82.75,72.34)
y<-c(73.66,64.27,69.34,71.37,69.77,68.12,67.27,68.07,62.61)
t.test(x,y,alternative = "greater",var.equal = T)

	Two Sample t-test

data:  x and y
t = 2.4234, df = 15, p-value = 0.01424
alternative hypothesis: true difference in means is greater than 0
95 percent confidence interval:
 1.41478     Inf
sample estimates:
mean of x mean of y
 73.39000  68.27556
正态总体方差的检验
x<-c(16.2,16.4,15.8,15.5,16.7,15.6,15.8)
y<-c(15.9,16.0,16.4,16.1,16.5,15.8,15.7,15.0)
var.test(x,y)

	F test to compare two variances

data:  x and y
F = 0.90869, num df = 6, denom df = 7,
p-value = 0.9232
alternative hypothesis: true ratio of variances is not equal to 1
95 percent confidence interval:
 0.1775273 5.1754220
sample estimates:
ratio of variances
         0.9086909
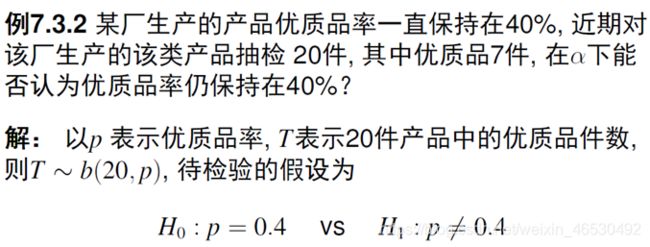
二项分布的假设检验
binom.test(7,20,p = 0.4)

	Exact binomial test

data:  7 and 20
number of successes = 7, number of trials
= 20, p-value = 0.8203
alternative hypothesis: true probability of success is not equal to 0.4
95 percent confidence interval:
 0.1539092 0.5921885
sample estimates:
probability of success
                  0.35


