python-matplotlib绘图函数中常用参数——持续更新
本文讲的是与plot(), scatter(), pyplot()等绘图函数中常用的参数。
目录
- 1 marker 标号
-
- 1.1 相关参数
- 2 linestyle 线的样式
- 3 linewidth 线宽
- 4 set_style( ) 设置主题
- 5 alpha 透明度
- 6 color 颜色
-
- 创建自己的colormap
-
-
-
- matplotlib.colors.ListedColormap( n*4维数组 或 ["b","y","g"] 形式的列表 )
-
-
- 从现有colormap截取新的colormap
- 方法1:更改全局参数:
- 方法二:绘图函数内部参数
- 7 legend 图例
-
-
-
- ax.legend() 相关参数
-
- 获取已有图例
- 7.1 全自动添加
- 7.2 半手动添加
- 7.3 全手动添加
- 图例大小字体的控制
- 删除图例
- 图例排列n*m
-
- 8 设置坐标轴值域
-
- 8.1 针对plt.figure()
- 8.2 针对fig, ax = plt.subplots()
- 9 修改坐标轴标度
- 10 字体设置
-
- 10.1 插入 LaTex 字体
- 10.2 全局字体设置
- 10.3 个别字体设置
- 10.4 中英文同时出现
- 10.5 用 ax.annotate() 做标注
- 10.6 在图中插入字体 ax.text()
- **附几个有用的函数**
-
-
-
-
-
- ax.set_axis_off() 隐藏坐标系
- 一个完整的颜色表示的例子
- 颜色值的相互转换(RGB HSV等)
- Examples大全
-
-
-
-
1 marker 标号
官方文档
用于plot(), scatter(), pyplot()。
他有很多款式:

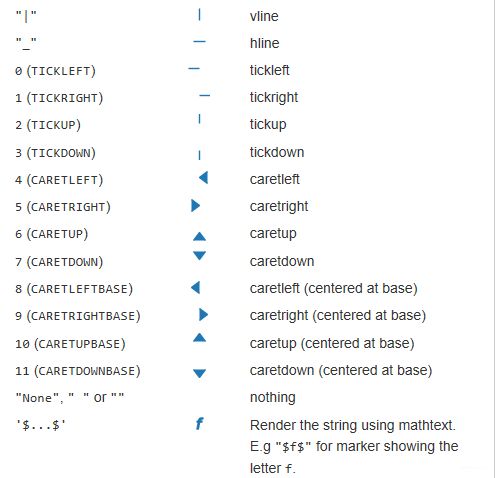
比如我想用表里的第四个“v”:
plot([0,1,2], [2,3,6], marker='v')
1.1 相关参数
1.markersize : float指定maker的大小。
官方文档
2.markeredgecolor :color 指定marker外边缘的颜色
3.markeredgewidth :float 外边缘宽度
4.markerfacecolor :color maker里面的实心颜色
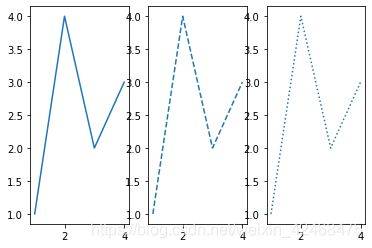
2 linestyle 线的样式
觉得实线虚线和虚线和各种款式。
| Linestyle | 效果 |
|---|---|
| ‘-’ or ‘solid’ | 实线 |
| ‘–’ or ‘dashed’ | 虚线 |
| ‘-.’ or ‘dashdot’ | 标准虚线 |
| ‘:’ or ‘dotted’ | 点虚线 |
| ‘None’ or ’ ’ or ‘’ | 什么也没有 |
示例
fig, ax = plt.subplots(1,3)  # Create a figure containing a single axes.
ax[0].plot([1, 2, 3, 4], [1, 4, 2, 3])  # Plot some data on the axes.
ax[1].plot([1, 2, 3, 4], [1, 4, 2, 3], linestyle="--")
ax[2].plot([1, 2, 3, 4], [1, 4, 2, 3], linestyle=":")
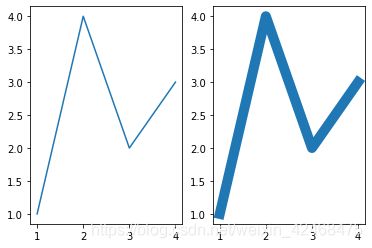
3 linewidth 线宽
线的宽度,只有折线图才有。
fig, ax = plt.subplots(1,2)  # Create a figure containing a single axes.
ax[0].plot([1, 2, 3, 4], [1, 4, 2, 3])  # Plot some data on the axes.
ax[1].plot([1, 2, 3, 4], [1, 4, 2, 3], linewidth=10)
4 set_style( ) 设置主题
set_style( )是用来设置主题的,Seaborn有五个预设好的主题: darkgrid , whitegrid , dark , white ,和 ticks 默认: darkgrid
5 alpha 透明度
fig, ax = plt.subplots(1,2)  # Create a figure containing a single axes.
ax[0].plot([1, 2, 3, 4], [1, 4, 2, 3])  # Plot some data on the axes.
ax[1].plot([1, 2, 3, 4], [6, 8, 4, 1],alpha=0.5)
6 color 颜色
这个参数太深奥了,可以自己创建,也可以选择预置方案。
color参数可以采纳以下表达形式:
- an RGB or RGBA (red, green, blue, alpha) tuple of float values in closed interval [0, 1] (e.g., (0.1, 0.2, 0.5) or (0.1, 0.2, 0.5, 0.3));
- a hex RGB or RGBA string (e.g., ‘#0f0f0f’ or ‘#0f0f0f80’; case-insensitive);更常见
- a shorthand hex RGB or RGBA string, equivalent to the hex RGB or RGBA string obtained by duplicating each character, (e.g., ‘#abc’, equivalent to ‘#aabbcc’, or ‘#abcd’, equivalent to ‘#aabbccdd’; case-insensitive);
- a string representation of a float value in [0, 1] inclusive for gray level (e.g., ‘0.5’);
- one of {‘b’, ‘g’, ‘r’, ‘c’, ‘m’, ‘y’, ‘k’, ‘w’}, they are the single character short-hand notations for blue, green, red, cyan, magenta, yellow, black, and white.
colormap 可以用现有配置方案也可以自己创建
创建自己的colormap
来源:https://matplotlib.org/tutorials/colors/colormap-manipulation.html
1.查看所有预置的配色方案:
用dir(plt.cm)查看所有配色方案:
['Accent',
 'Accent_r',
 'Blues',
 'Blues_r',
 'BuGn_r',
......
 'twilight_shifted_r',
 'viridis',    #系统默认的
 'viridis_r',
 'winter',
 'winter_r']
这个网站有所有配色方案的展示
颜色大全
2.colormap的选取和map关系:
from matplotlib import cm
# 一般配色方案是连续的渐变色,我们需要均匀截取8种颜色,8表示想分成几种颜色,从渐变分成8段
viridis = cm.get_cmap('viridis', 8)
print(viridis(0.56))
'''
如果想分成256段的话,可以这样
viridis = cm.get_cmap('viridis', 256)
newcolors = viridis(np.linspace(0, 1, 256))

>>>newcolors.shape
Out[98]: (256, 4)
'''
结果:Out[53]: (0.122312, 0.633153, 0.530398, 1.0)
"viridis"是现成配色方案的一种,viridis()里面的数值在0-1之间,表示从调色板的一边到另一边。
因为我选取的colormap已经被分成了8段,每一段表示一段颜色,我通过viridis.colors可以查看:
>>>viridis.colors  #也可以用viridis(range(8))
Out[55]:
array([[0.267004, 0.004874, 0.329415, 1.      ],
       [0.275191, 0.194905, 0.496005, 1.      ],
       [0.212395, 0.359683, 0.55171 , 1.      ],
       [0.153364, 0.497   , 0.557724, 1.      ],
       [0.122312, 0.633153, 0.530398, 1.      ],
       [0.288921, 0.758394, 0.428426, 1.      ],
       [0.626579, 0.854645, 0.223353, 1.      ],
       [0.993248, 0.906157, 0.143936, 1.      ]])
想要查看viridis的颜色范围必须把其当作方法并在里面加入想要查看的索引range(8)、np.linspace(0, 1, 8)才行。
3.搞清楚colormap的形式——例如viridis(0.56)是一个四维数组、viridis.colors是被分成8个颜色的4维数组了以后,我们开始创建自己的colormap:
matplotlib.colors.ListedColormap( n*4维数组 或 [“b”,“y”,“g”] 形式的列表 )
这个函数的作用是把数组或颜色列表转化成抽象的cmp(
from matplotlib.colors import ListedColormap
cmap = ListedColormap(["darkorange", "gold", "lawngreen", "lightseagreen"])
通过colorbar查看自己的配色方案:
fig, ax = plt.subplots(figsize=(6, 1))
norm = mpl.colors.Normalize(vmin=0, vmax=1) #这是一个缩放器 缩放的值域可以自己控制
fig.colorbar(mpl.cm.ScalarMappable(norm=norm, cmap=cmap),
             cax=ax, orientation='horizontal', label='my colormap')
# cmap = cm.get_cmap('viridis')  查看现有配色方案的colorbar
cmap = ListedColormap(["darkorange", "gold", "lawngreen", "lightseagreen"])
fig, ax = plt.subplots()
ax.plot([1, 2, 3, 4], [1, 4, 2, 3],color=cmap(0),label="Line1")
ax.plot([1, 2, 3, 4], [6, 8, 4, 1],color=cmap(1),label="Line2")
ax.plot([1, 2, 3, 4], [4, 7, 3, 6],color=cmap(2),label="Line3")
ax.plot([1, 2, 3, 4], [1, 9, 5, 4],color=cmap(3),label="Line4")
ax.legend()
得到了四种颜色的线条~注意这样添加的是没有经过normalize的,引用的时候得用整数cmap(1)。

从现有colormap截取新的colormap
viridisBig = cm.get_cmap('viridis', 512)
newcmp = ListedColormap(viridisBig(np.linspace(0.25, 0.75, 256))) #取了原区间0.25-0.75的颜色范围
修改颜色方式有很多种,可以在绘图函数内部,也可以更改全局参数
方法1:更改全局参数:
# 选取了coolwarn的配色方案
cmap = plt.cm.get_cmap(coolwarm,256)
# N表示颜色总的类别数
rcParams['axes.prop_cycle'] = cycler(color=cmap(np.linspace(0, 1, N)))
更改全局参数后,就无需再绘图函数内部指定color或者cmap值了,每次绘图后都会用不同的颜色参数,前提是N≥绘图的次数。
查看一下cmap具体的值的用法:
>>>cmap(0.0)
Out[36]: (0.0, 0.5, 0.0, 1.0)

>>>cmap(1.0)
Out[37]: (1.0, 1.0, 1.0, 1.0)
方法二:绘图函数内部参数
7 legend 图例
来源:https://matplotlib.org/tutorials/intermediate/legend_guide.html
ax.legend() 相关参数
ax.legend()的 loc(位置)参数、title参数都是可以调整的。loc可以选择upper center lower + right left center两两搭配的组合或者直接用“best”自动确定图例在图中的位置。还有些有用的参数:title_fontsize、fontsize。
bbox_to_anchor = (0.5, 0.5)参数可以调整图例的具体位置。
ncol 默认是1,图例的列数。
详见:https://matplotlib.org/api/_as_gen/matplotlib.pyplot.legend.html#matplotlib.pyplot.legend
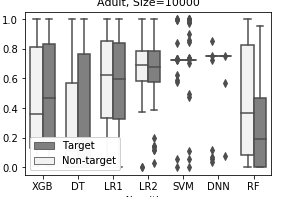
获取已有图例
handels, labels = ax.get_legend_handles_labels()
如果想要调整图例里面的顺序,或者修改图例的label,可以用这个方法。
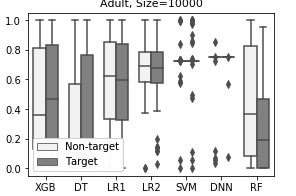
bp = sns.boxplot(x="reference_kind", y="value",hue="cat",ax=ax[0],data=df)
#获取 handels, labels
handels, labels = ax[0].get_legend_handles_labels()
'''
打印出来分别是 handels  :[,
 ]
labels :['Non-target', 'Target']
'''
# 然后就可以随心所欲地交换位置 、替换图例了。
handels = handels[::-1]
labels = labels[::-1]
7.1 全自动添加
这样的添加方式特点是每画一条线或一类点,就得设置一次label参数的属性,有两种添加legend的方式:
line, = ax.plot([1, 2, 3], label='label')
ax.legend()
或
line, = ax.plot([1, 2, 3])
line.set_label('Label')
ax.legend()
7.2 半手动添加
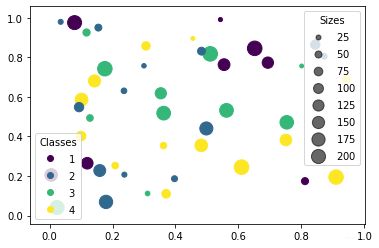
但是在一些情况中,需要半手动添加:比如我只想让一部分的图例呈现;比如数据不是分批添加的(不能分批标记“label”),而是一次性添加的。
这个不需在绘图时添加label参数,是在绘图完成后添加的,并且数据时一次性加入的,只不过根据数值的不同自行分类legend了。
下面讲根据颜色和大小区分:
N = 45
x, y = np.random.rand(2, N)
c = np.random.randint(1, 5, size=N)
s = np.random.randint(10, 220, size=N)

fig, ax = plt.subplots()

scatter1 = ax.scatter(x, y, c=c, s=s)

# produce a legend with the unique colors from the scatter
#也可以 handles, labels = scatter.legend_elements(),然后依次作为ax.legend()的参数
#scatter.legend_elements()中prop的默认属性是prop="colors",即按照颜色区分
# *scatter1.legend_elements()就是scatter1的handles和labels
legend1 = ax.legend(*scatter1.legend_elements(), loc="lower left", title="Classes")
ax.add_artist(legend1) #这一步很重要 不然后面的lengend2会覆盖legend1

# produce a legend with a cross section of sizes from the scatter
# labels甚至可以自己命名,只要是和handles长度一致的列表就行
handles, labels = scatter1.legend_elements(prop="sizes", alpha=0.6)
legend2 = ax.legend(handles, labels, loc="upper right", title="Sizes")

plt.show()
更多参见:https://matplotlib.org/gallery/lines_bars_and_markers/scatter_with_legend.html#sphx-glr-gallery-lines-bars-and-markers-scatter-with-legend-py
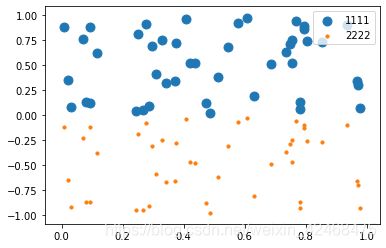
下面的代码可以更好地搞清楚ax.legend()中handles和labels两个参数到底需要啥,前一个需要绘制好的图,后者需要对应legend的名称。当handles中的图已经包含labels参数时,可以忽略labels参数。
N = 45
x, y = np.random.rand(2, N)
c = np.random.randint(1, 5, size=N)
s = np.random.randint(10, 220, size=N)

fig, ax = plt.subplots()

scatter1 = ax.scatter(x, y, s=80)
scatter2 = ax.scatter(x, y-1, s=10)

legend = ax.legend(handles=[scatter1,scatter2],labels=["1111","2222"], loc="upper right")

plt.show()
7.3 全手动添加
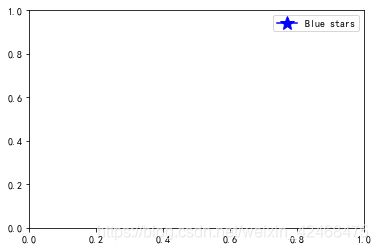
上面那个方法是自动捕捉不同的size和color,接下来讲手动添加法,其可以无中生有出图像中不存在的marker作作为图例:
import matplotlib.lines as mlines

# 定义添加的legend的样式
# 区分color是线条颜色,markerfacecolor才是marker的颜色
blue_line = mlines.Line2D([], [], color='blue', marker='*', markersize=15, label='Blue stars',markerfacecolor="blue")

plt.legend(handles=[blue_line])
plt.show()
图例大小字体的控制
# 图例中字体的设置
font1 = {
     'family' : 'SimHei',
'weight' : 'normal',
'size'   : 9,
}

ax[0,0].legend([s1,s2,s3,s4],[u"女/非黑",u"男/非黑",u"女/黑",u"男/黑"],
  prop=font1,loc="lower left",
  scatterpoints=1, #呈现几个标号
  framealpha=0.5,  #图例透明度
  handlelength=0.2) #图例靠左的程度,越小越紧凑
# 也可以这样
ax[0,0].legend([s1,s2,s3,s4],[u"女/非黑",u"男/非黑",u"女/黑",u"男/黑"],fontsize=11)
删除图例
ax.get_legend().remove()
图例排列n*m
默认都是m*1的形式,ncol这个参数科室设置列数
ax.legend(ncol=2)
有关图例的参数请参见:
https://www.jb51.net/article/191933.htm
8 设置坐标轴值域
针对两种生成图表的方法,有两种修改坐标轴值域的方法
8.1 针对plt.figure()
plt.figure()
...
plt.xlim([x0,x1])
plt.ylim([y0,y1])
8.2 针对fig, ax = plt.subplots()
fig, ax = plt.subplots()
...
axes.set_xlim([x0,x1])
axes.set_ylim([y0,y1])
9 修改坐标轴标度
1.下面是针对 plt.figure() 形式的图表
from matplotlib.ticker import FuncFormatter
import matplotlib.pyplot as plt
import numpy as np

x = np.arange(4)
money = [1.5e5, 2.5e6, 5.5e6, 2.0e7]


def millions(x, pos):
    'The two args are the value and tick position'
    return '$%1.1fM' % (x * 1e-6)


formatter = FuncFormatter(millions)

fig, ax = plt.subplots()
ax.yaxis.set_major_formatter(formatter)
plt.bar(x, money)
plt.xticks(x, ('Bill', 'Fred', 'Mary', 'Sue'), fontsize=15)
""" #也可以这样
ax.set_xticks(x)
ax.set_xticklabels(('Bill', 'Fred', 'Mary', 'Sue'), fontsize=15)
"""
plt.show()

2. 如果是 fig, ax = plt.subplots() 形式的,则:
ax[0,1].set_xticklabels(["XGB","DT","LR1","LR2","SVM","DNN","RF"],font1)
10 字体设置
10.1 插入 LaTex 字体
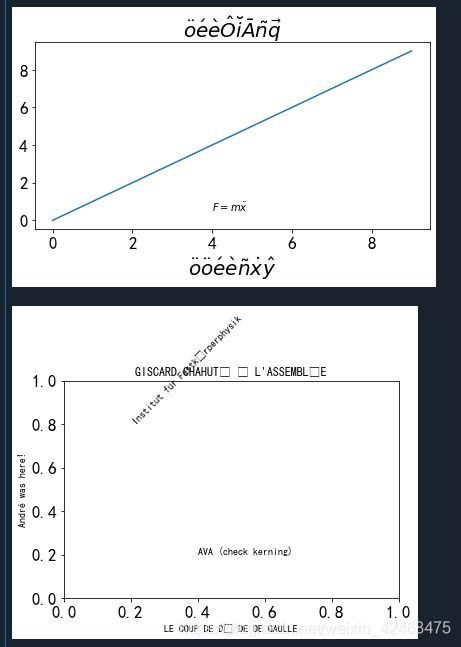
这个很有用啊,记得要加 r 和 $$ 哦:
import matplotlib.pyplot as plt

# Mathtext demo
fig, ax = plt.subplots()
ax.plot(range(10))
ax.set_title(r'$\ddot{o}\acute{e}\grave{e}\hat{O}'
             r'\breve{i}\bar{A}\tilde{n}\vec{q}$', fontsize=20)

# Shorthand is also supported and curly braces are optional
ax.set_xlabel(r"""$\"o\ddot o \'e\`e\~n\.x\^y$""", fontsize=20)
ax.text(4, 0.5, r"$F=m\ddot{x}$")
fig.tight_layout()

# Unicode demo
fig, ax = plt.subplots()
ax.set_title("GISCARD CHAHUTÉ À L'ASSEMBLÉE")
ax.set_xlabel("LE COUP DE DÉ DE DE GAULLE")
ax.set_ylabel('André was here!')
ax.text(0.2, 0.8, 'Institut für Festkörperphysik', rotation=45)
ax.text(0.4, 0.2, 'AVA (check kerning)')

plt.show()
10.2 全局字体设置
plt.rcParams['font.sans-serif']=['SimHei'] # 用来正常显示中文标签
plt.rcParams['axes.unicode_minus']=False # 用来正常显示负号
10.3 个别字体设置
可分别作用域用于lable、tick、text、legend等等。。
问题来源:如下图 y轴的 tick 发生了偏移,我想把它往上调一点。
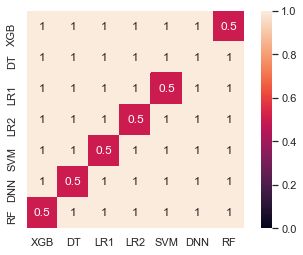
我们可以通过构建一个词典,添加我需要设置的参数,并把词典会传入我需要修改字体的模块(yticklabels、legend等):
font1 = {

'weight' : 'normal',
'size'   : 11,
"horizontalalignment":'center', #主要是这行和下一行决定字体的对齐方式
"verticalalignment":"center"
}
ax.set_yticklabels(["XGB","DT","LR1","LR2","SVM","DNN","RF"],font1)
效果:yticks居中了。

针对 ax.legend() 的字体调整,需要回传至 prop 参数:
font1={
     "family":'serif'}
ax.legend(framealpha=0,fontsize=13,ncol=2, loc="lower center",prop = font1)
font的参数详解:
family: 字体样式
其中,英文字体有:
# serif 基本就是 Times New Roman
families = ['serif', 'sans-serif', 'cursive', 'fantasy', 'monospace']
其中,中文字体有:
黑体:SimHei
微软雅黑:Microsoft YaHei
微软正黑体:Microsoft JhengHei
新宋体:NSimSun
宋体:SimSun
新细明体:PMingLiU
细明体:MingLiU
华文新魏:STXinwei
华文行楷:STXingkai
华文隶书:STLliti
花纹琥珀:STHupo
华文彩云:STCaiyun
方正姚体:FZYaoti
方正舒体:FZShuTi
标楷体:DFKai-SB
华文仿宋:STFangsong
华文中宋:STZhongsong
华文宋体:STSong
华文楷体:STKaiti
华文细黑:STXihei
幼圆:YouYuan
隶书:LiSu
楷体_GB 2313:Kaiti_GB2313
仿宋_GB2313:FangSong_GB2313
仿宋:FangSong
x, y : scalars 防止text的位置
s : str 内容text
fontdict : dictionary, optional, default: None 一个定义s格式的dict
withdash : boolean, optional, default: False。如果True则创建一个 TextWithDash实例。
fontsize设置字体大小,默认12,可选参数 [‘xx-small’, ‘x-small’, ‘small’, ‘medium’, ‘large’,‘x-large’, ‘xx-large’]
fontweight设置字体粗细,可选参数 [‘light’, ‘normal’, ‘medium’, ‘semibold’, ‘bold’, ‘heavy’, ‘black’]
fontstyle设置字体类型,可选参数[ ‘normal’ | ‘italic’ | ‘oblique’ ],italic斜体,oblique倾斜
verticalalignment设置水平对齐方式 ,可选参数 : ‘center’ , ‘top’ , ‘bottom’ ,‘baseline’
horizontalalignment设置垂直对齐方式,可选参数:left,right,center
rotation(旋转角度)可选参数为:vertical,horizontal 也可以为数字
alpha透明度,参数值0至1之间
backgroundcolor标题背景颜色
bbox给标题增加外框 ,常用参数如下:
boxstyle方框外形
facecolor(简写fc)背景颜色
edgecolor(简写ec)边框线条颜色
edgewidth边框线条大小
10.4 中英文同时出现
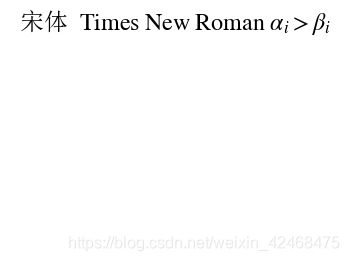
mpl自带有几种数学字体,最常用的有cm系列和stix系列,前者是Latex默认的数学字体,而stix的正体和Times New Roman差别很小,一般用来和Times New Roman搭配。所以这里我们采用stix,即可达到相同的视觉效果。
import matplotlib.pyplot as plt
from matplotlib import rcParams

config = {

    "font.family":'serif',
    "font.size": 20,
    "mathtext.fontset":'stix',
    "font.serif": ['SimSun'],
}
rcParams.update(config)

plt.title(r'宋体 $\mathrm{Times \; New \; Roman}\/\/ \alpha_i > \beta_i$')
plt.axis('off')
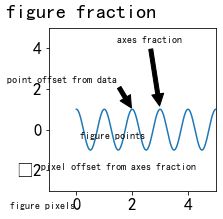
10.5 用 ax.annotate() 做标注
相关参数参见:
https://matplotlib.org/stable/api/_as_gen/matplotlib.axes.Axes.annotate.html#matplotlib.axes.Axes.annotate
fig, ax = plt.subplots(figsize=(3, 3))

t = np.arange(0.0, 5.0, 0.01)
s = np.cos(2*np.pi*t)

# Plot a line and add some simple annotations
line, = ax.plot(t, s)
ax.annotate('figure pixels',
            xy=(10, 10), xycoords='figure pixels')
ax.annotate('figure points',
            xy=(80, 80), xycoords='figure points')
ax.annotate('figure fraction',
            xy=(.025, .975), xycoords='figure fraction',
            horizontalalignment='left', verticalalignment='top',
            fontsize=20)

# The following examples show off how these arrows are drawn.

ax.annotate('point offset from data',
            xy=(2, 1), xycoords='data',
            xytext=(-15, 25), textcoords='offset points',
            arrowprops=dict(facecolor='black', shrink=0.05),
            horizontalalignment='right', verticalalignment='bottom')

ax.annotate('axes fraction',
            xy=(3, 1), xycoords='data',
            xytext=(0.8, 0.95), textcoords='axes fraction',
            arrowprops=dict(facecolor='black', shrink=0.05),
            horizontalalignment='right', verticalalignment='top')

# You may also use negative points or pixels to specify from (right, top).
# E.g., (-10, 10) is 10 points to the left of the right side of the axes and 10
# points above the bottom

ax.annotate('pixel offset from axes fraction',
            xy=(1, 0), xycoords='axes fraction',
            xytext=(-20, 20), textcoords='offset pixels',
            horizontalalignment='right',
            verticalalignment='bottom')

ax.set(xlim=(-1, 5), ylim=(-3, 5))
10.6 在图中插入字体 ax.text()
fig = plt.figure()
plt.axis([0, 10, 0, 10])
t = ("This is a really long string that I'd rather have wrapped so that it "
     "doesn't go outside of the figure, but if it's long enough it will go "
     "off the top or bottom!")
plt.text(4, 1, t, ha='left', rotation=15, wrap=True)
plt.text(6, 5, t, ha='left', rotation=15, wrap=True)
plt.text(5, 5, t, ha='right', rotation=-15, wrap=True)
plt.text(5, 10, t, fontsize=18, style='oblique', ha='center',
         va='top', wrap=True)
plt.text(3, 4, t, family='serif', style='italic', ha='right', wrap=True)
plt.text(-1, 0, t, ha='left', rotation=-15, wrap=True)

plt.show()
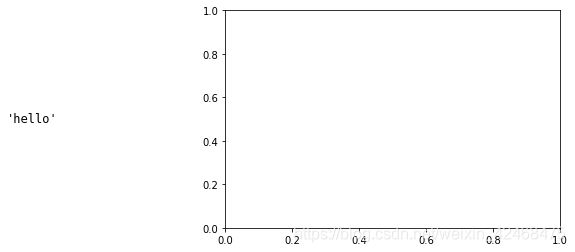
又例如:
-0.5和0.5分别表示插入文字的坐标。
text_style = dict(horizontalalignment='right', verticalalignment='center',fontsize=12, fontdict={
     'family': 'monospace'})
ax.text(-0.5, 0.5, repr("hello"),**text_style)
附几个有用的函数
ax.set_axis_off() 隐藏坐标系
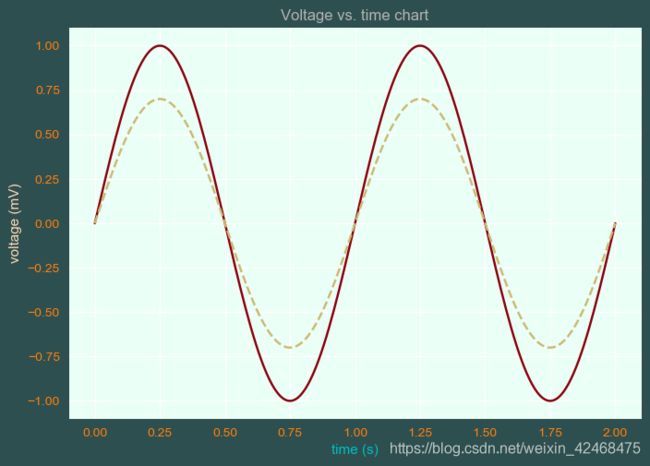
一个完整的颜色表示的例子
import matplotlib.pyplot as plt
import numpy as np

t = np.linspace(0.0, 2.0, 201)
s = np.sin(2 * np.pi * t)

# 1) RGB tuple:
fig, ax = plt.subplots(facecolor=(.18, .31, .31))  #背景颜色
# 2) hex string:
ax.set_facecolor('#eafff5')  #画布颜色
# 3) gray level string:
ax.set_title('Voltage vs. time chart', color='0.7')
# 4) single letter color string
ax.set_xlabel('time (s)', color='c')
# 5) a named color:
ax.set_ylabel('voltage (mV)', color='peachpuff')
# 6) a named xkcd color:
ax.plot(t, s, 'xkcd:crimson')
# 7) Cn notation:
ax.plot(t, .7*s, color='C4', linestyle='--')
# 8) tab notation:
ax.tick_params(labelcolor='tab:orange')

plt.show()
颜色值的相互转换(RGB HSV等)
RGBA (red, green, blue, alpha)相比于RGB多了个alpha(透明度)的参数。
HSV 介绍
HSV是一种比较直观的颜色模型,所以在许多图像编辑工具中应用比较广泛,这个模型中颜色的参数分别是:色调(H, Hue),饱和度(S,Saturation),明度(V, Value)。
| 方法 | 作用 |
|---|---|
| hsv_to_rgb(hsv) | Convert hsv values to rgb. |
| rgb_to_hsv(arr) | Convert float rgb values (in the range [0, 1]), in a numpy array to hsv values. |
| to_hex(c[, keep_alpha]) | Convert c to a hex color. |
| to_rgb© | Convert c to an RGB color, silently dropping the alpha channel. |
| to_rgba(c[, alpha]) | Convert c to an RGBA color. |
| to_rgba_array(c[, alpha]) | Convert c to a (n, 4) array of RGBA colors. |
(c表示字符串类型的颜色:“blue”)
注意这些函数只能一次性转换一个颜色,不能直接转换整个cmap。
Examples大全
https://matplotlib.org/gallery/index.html

