pyechart数据可视化12 数据大屏 仪表盘丨2020年全球智能手机相关数据
本专题将结合pyechart案例及行业数据, 提供各维度图表模板, 详细介绍参数功能, 就算不懂编程也可以轻松使用, 欢迎大家关注, 别走丢!
如何将多个图表组合进行大屏展示?
提前准备
- 安装Anaconda软件
下载地址: https://mirrors.tuna.tsinghua.edu.cn/anaconda/archive/
使用jupyter notebook 或者spyder - 安装pyechart工具包
pyechart工具包有1.0版本和0.5版本, 请下载1.0以上版本
pip install pyecharts -U
模板12: 效果图
第1步: 导入工具包
import pandas as pd
import numpy as np
from pyecharts import options as opts
from pyecharts.charts import Bar,Line,Pie,Page
from pyecharts.commons.utils import JsCode
from pyecharts.globals import ThemeType, ChartType
Page用于将多个图表组合;
JsCode 用于生成图表布局格式文件, 用户重新渲染图表
ThemeType 设置图表风格
第2步: 读取数据
data = pd.read_excel('./data/2020年智能手机相关数据.xlsx',sheet_name=None)
data
数据存放在同一工作簿的多个sheet表中, 设置参数sheet_name=None可以批量读取, 生成一个字典数据.
第3步: 作图
2020年全球智能手机TOP10厂商市场份额
# 数据
data1 = data['2020年全球智能手机TOP10厂商市场份额']
data1.sort_values(by='百分比',ascending=True,inplace=True) # 升序排列
data1['百分比'] = (data1['百分比']*100).round(2)  # 保留2位小数
data1
对数据进行重新排序, 并整理
bar1 = (
    Bar(init_opts=opts.InitOpts(theme='westeros',bg_color="#161d6f")) # 图表风格和背景色设置
    .add_xaxis(data1['品牌'].tolist())  # x轴数据
    .reversal_axis()    # 坐标轴翻转(条形图)
    .add_yaxis("", data1['百分比'].tolist())  #y轴数据
    .set_global_opts(title_opts=opts.TitleOpts(title="2020年全球智能手机TOP10厂商市场份额",
                                               subtitle="2020年LG共出货2470万台智能手机设备,约占1.9%的时长份额",
                                              pos_left='center'))
    .set_series_opts(label_opts=opts.LabelOpts(position="right",
                                              formatter="{c} %"))
)
bar1.render('大屏1.html')
制作第1个条形图, 设置主要的图表参数
2020年美国智能手机用户主要手机品牌及占比
# 数据
data2 = data['2020年美国智能手机用户主要手机品牌及占比']
data2.sort_values(by='百分比',ascending=True,inplace=True) # 升序排列
data2['百分比'] = (data2['百分比']*100).round(2)  # 保留2位小数
data2
bar2 = (
    Bar(init_opts=opts.InitOpts(theme='westeros',bg_color="#161d6f"))
    .add_xaxis(data2['品牌'].tolist())
    .reversal_axis()
    .add_yaxis("", data2['百分比'].tolist())
    .set_global_opts(title_opts=opts.TitleOpts(title="2020年美国智能手机用户主要手机品牌及占比",
                                               subtitle="随着LG的退出,美国智能手机市场将变成苹果和三星的双头垄断",
                                               pos_left='center'))
    .set_series_opts(label_opts=opts.LabelOpts(position="right",
                                              formatter="{c} %"))
)
bar2.render('大屏2.html')
2020-2021年全球智能手机出货量市场份额
# 数据
data3 = data['2020-2021年全球智能手机出货量市场份额']
data3[2020] = (data3[2020]*100).round(2)
data3['2021E'] = (data3['2021E']*100).round(2)
data3_re = data3.set_index('品牌').T.reset_index()
data3_re
bar3 = (
    Bar(init_opts=opts.InitOpts(theme='westeros',bg_color="#161d6f"))
    .add_xaxis(data3_re['index'].tolist())
    .add_yaxis("三星", data3_re['三星'].tolist(),stack="stack1")
    .add_yaxis("苹果", data3_re['苹果'].tolist(),stack="stack1")
    .add_yaxis("小米", data3_re['小米'].tolist(),stack="stack1")
    .add_yaxis("vivo", data3_re['vivo'].tolist(),stack="stack1")
    .add_yaxis("OPPO", data3_re['OPPO'].tolist(),stack="stack1")
    .add_yaxis("其他", data3_re['其他'].tolist(),stack="stack1")
    .set_global_opts(title_opts=opts.TitleOpts(title="2020-2021年全球智能手机出货量市场份额",
                                               subtitle="小米将在2021年成为全球第三大智能手机供应商",
                                               pos_left='center'),
                    legend_opts=opts.LegendOpts(is_show=True,pos_top="bottom"))
    .set_series_opts(label_opts=opts.LabelOpts(position="inside",
                                              formatter="{c} %"))
)
bar3.render('大屏3.html')
2019-2020年全球可穿戴设备销售额市场份额
# 数据
data4 = data['2019-2020年全球可穿戴设备销售额市场份额']
data4[2019] = (data4[2019]*100).round(2)
data4[2020] = (data4[2020]*100).round(2)
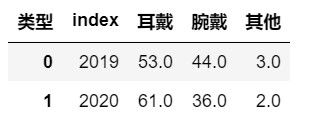
data4_re = data4.set_index('类型').T.reset_index()
data4_re
bar4 = (
    Bar(init_opts=opts.InitOpts(theme='westeros',bg_color="#161d6f"))
    .add_xaxis(data4_re['index'].tolist())
    .add_yaxis("耳戴", data4_re['耳戴'].tolist(),stack="stack1")
    .add_yaxis("腕戴", data4_re['腕戴'].tolist(),stack="stack1")
    .add_yaxis("其他", data4_re['其他'].tolist(),stack="stack1")
    .set_global_opts(title_opts=opts.TitleOpts(title="2019-2020年全球可穿戴设备销售额市场份额",pos_left='center'),
                    legend_opts=opts.LegendOpts(is_show=True,pos_top="bottom"))
    .set_series_opts(label_opts=opts.LabelOpts(position="inside",
                                              formatter="{c} %"))
)
bar4.render('大屏4.html')
2019-2020年全球可穿戴设备销售额及增长率
# 数据
data5 = data['2019-2020年全球可穿戴设备销售额及增长率']
data5
bar5 = (
    Bar(init_opts=opts.InitOpts(theme='westeros',bg_color="#161d6f"))  # 设置图表大小
    .add_xaxis(data5['品牌'].tolist())   # 设置柱形图的x轴, 必须写.tolist()

    .add_yaxis(
        series_name="2019年出货量(万台)",  # y轴系列名称
        y_axis=data5['2019年出货量(万台)'].tolist(),   # 系列数据
        )
    .add_yaxis(
        series_name="2020年出货量(万台)",  # y轴系列名称
        y_axis=data5['2020年出货量(万台)'].tolist(),   # 系列数据
        )

    .extend_axis( # 设置次坐标轴
        yaxis=opts.AxisOpts(
            name="",
            type_="value",
            min_=-300,  # 最小值
            max_=160,  # 最大值
            is_show=False,  # 是否显示
                            )
                )
        .set_global_opts(
            title_opts=opts.TitleOpts(title="2020年全球智能个人音频设备出货量及增长率",  # 主标题
                                      subtitle="",   #副标题
                                      title_textstyle_opts=opts.TextStyleOpts(font_size=20),
                                      pos_left='center'),  # 位置
            legend_opts=opts.LegendOpts(is_show=True,pos_top="bottom"),  # 图例
            yaxis_opts=opts.AxisOpts(                     # 显示y轴网格线
                is_show=False,
                max_=41000,
                type_="value",
                axistick_opts=opts.AxisTickOpts(is_show=False),   # 坐标轴商的刻度是否显示
                axisline_opts=opts.AxisLineOpts(is_show=False), # y轴线
                splitline_opts=opts.SplitLineOpts(is_show=True),   # y轴网格线是否显示
        ))
    )

line1 = (
    Line()  # 设置图表大小
    .add_xaxis(data5['品牌'].tolist())  # 设置线形图的x轴
    .add_yaxis("",
               data5['同比增长率(%)'],  # 系列数据
               symbol_size=10, # 标识的大小
               is_smooth=True,
               yaxis_index=1,   # 主坐标轴还是次坐标轴
              )
)

bar5.overlap(line1) # 图表组合
bar5.render('大屏5.html')
2020年全球主要智能手机显示面板厂商市场份额
# 数据
data6 = data['2020年全球主要智能手机显示面板厂商市场份额']
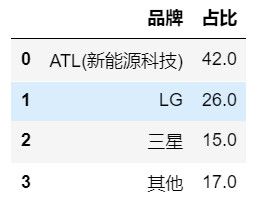
data6['占比'] = (data6['占比']*100).round(2)
data6
pie6 = (
    Pie(init_opts=opts.InitOpts(theme='westeros',bg_color="#161d6f"))
    .add(
        "",
        [list(z) for z in zip(data6['品牌'],data6['占比'])],
        radius=['40%', '60%'])
        .set_global_opts(
            title_opts=opts.TitleOpts(title="2020年全球主要智能手机显示面板厂商市场份额",  # 主标题
                                      subtitle="",   #副标题
                                      title_textstyle_opts=opts.TextStyleOpts(font_size=20),
                                      pos_left='center'),  # 位置
                    legend_opts=opts.LegendOpts(is_show=True,pos_top="bottom"))
    .set_series_opts(label_opts=opts.LabelOpts(formatter="{b}: {c}%"))
    )
pie6.render('大屏6.html')
2020年全球主要智能手机电池厂商市场份额
# 数据
data7 = data['2020年全球主要智能手机电池厂商市场份额']
data7['占比'] = (data7['占比']*100).round(2)
data7
pie7 = (
    Pie(init_opts=opts.InitOpts(theme='westeros',bg_color="#161d6f"))
    .add(
        "",
        [list(z) for z in zip(data7['品牌'],data7['占比'])],
        radius=['40%', '60%'])
        .set_global_opts(
            title_opts=opts.TitleOpts(title="2020年全球主要智能手机电池厂商市场份额",  # 主标题
                                      subtitle="",   #副标题
                                      title_textstyle_opts=opts.TextStyleOpts(font_size=20),
                                      pos_left='center'),  # 位置
                    legend_opts=opts.LegendOpts(is_show=True,pos_top="bottom"))
    .set_series_opts(label_opts=opts.LabelOpts(formatter="{b}: {c}%"))
    )
pie7.render('大屏7.html')
2020年全球主要智能手机图像传感器厂商市场份额
# 数据
data8 = data['2020年全球主要智能手机图像传感器厂商市场份额']
data8['占比'] = (data8['占比']*100).round(2)
data8
pie8 = (
    Pie(init_opts=opts.InitOpts(theme='westeros',bg_color="#161d6f"))
    .add(
        "",
        [list(z) for z in zip(data8['品牌'],data8['占比'])],
        radius=['40%', '60%'])
        .set_global_opts(
            title_opts=opts.TitleOpts(title="2020年全球主要智能手机图像传感器厂商市场份额",  # 主标题
                                      subtitle="",   #副标题
                                      title_textstyle_opts=opts.TextStyleOpts(font_size=20),
                                      pos_left='center'),  # 位置
                    legend_opts=opts.LegendOpts(is_show=True,pos_top="bottom"))
    .set_series_opts(label_opts=opts.LabelOpts(formatter="{b}: {c}%"))
    )
pie8.render('大屏8.html')
构造标题
pie9 = (
    Pie(init_opts=opts.InitOpts(theme='westeros',bg_color="#161d6f"))#init_opts=opts.InitOpts(theme='westeros',bg_color="#161d6f")
        .set_global_opts(
        title_opts=opts.TitleOpts(title="2020年全球智能手机相关数据",
                                  subtitle='更新日期: 2021/4/11',
                                  pos_left='center',
                                  title_textstyle_opts=opts.TextStyleOpts(font_size=25, color='#51c2d5',),
                                  pos_top='10%'))
)
pie9.render('大屏9.html')
构造一个饼图, 只设置标题
组合
page = Page(layout=Page.DraggablePageLayout)
page.add(pie9,bar1,bar2,bar3,bar4,bar5,pie6,pie7,pie8)
page.render("2020年全球智能手机相关数据.html")
调整布局后重新渲染
# 重新布局
Page.save_resize_html("2020年全球智能手机相关数据.html", cfg_file="./布局文件/chart_config (2).json", dest="2020年全球智能手机相关数据_re2.html")
chart_config (2).json 文件为手动调整图表布局后保存的文件
技巧总结
- 先绘制基础图表, 设置好标题,副标题, 图例,背景色,网格线的元素
- 通过辅助饼图构造大屏标题和副标题
- 通过page组合图表, 选择layout=Page.DraggablePageLayout模式, 然后调整各图表位置,生成json文件
- 重新渲染图表
存在问题:
- 背景色过于单调
- 图表间距, 图表元素颜色需要微调


