matplotlib——pyplot.plot绘制二维线图的常用代码示例
在这之前需要准备的
官方文档
英文的,有能力的可以自己阅读。大概用一用的话也可以看我的代码。
下载并安装matplotlib
至少你要下载matplotlib包,这个不多赘述,百度如何安装包的文章很多。
在文件中导入
在使用前记得
from matplotlib import pyplot
也可以
from matplotlib import pyplot ad py
这里as后的py是你随意定的,目的是方便书写。下面我在使用的时候会保持pyplot的写法,方便大家复制并避免阅读时出现障碍。
准备数据
对于一个二维线图,最少需要准备y(纵轴)的数据。
x=[0,1,2,3,4,5,6,7,8,9]
y=[0,1,4,9,16,25,36,49,64,81]
z=[0,4,8,12,16,20,24,28,32,36]#这是另一组数据,方便后面演示subplot
开始绘图
注意灵活变通,很多属性是在**kwargs中,是互通的。多去尝试。
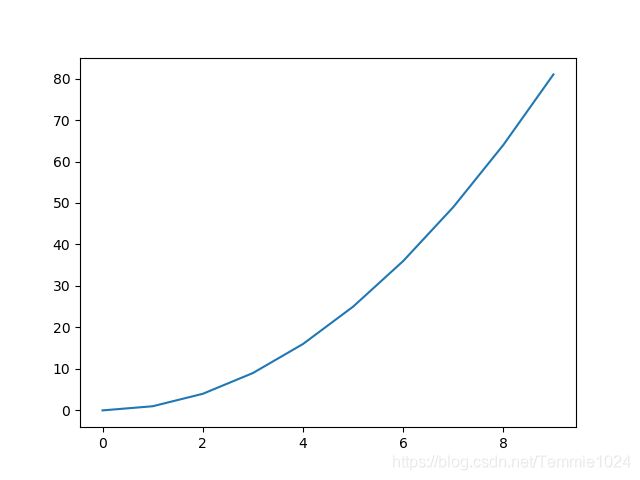
pyplot.plot(y)只有y值绘制图像
这时x默认为range(len(y)),即从0到n-1绘图。
例:
from matplotlib import pyplot
y=[0,1,4,9,16,25,36,49,64,81]
pyplot.plot(y)
pyplot.show()
pyplot.plot(x,y)有x和y绘制图像
图像会从你指定的x开始绘制。
例:
from matplotlib import pyplot
x=[2,3,4,5,6,7,8,9,10,11]
y=[0,1,4,9,16,25,36,49,64,81]
pyplot.plot(x,y)
pyplot.show()
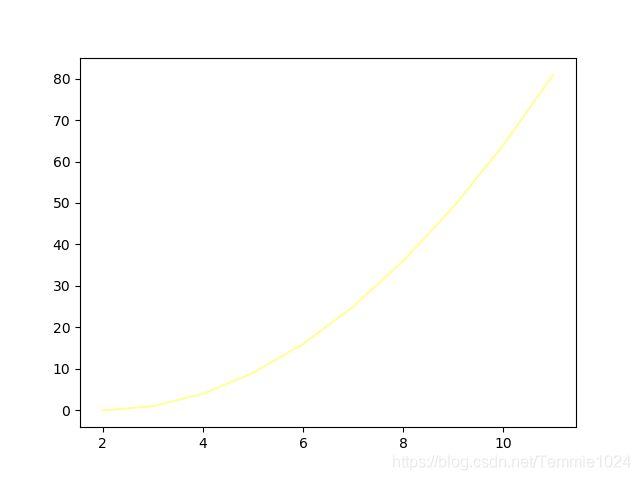
pyplot.plot(x,y,color=’ ')绘制图像并改变线的颜色
color=‘你能想到的颜色或者十六进制代码’
from matplotlib import pyplot
x=[2,3,4,5,6,7,8,9,10,11]
y=[0,1,4,9,16,25,36,49,64,81]
pyplot.plot(x,y,color='green')
pyplot.show()
from matplotlib import pyplot
x=[2,3,4,5,6,7,8,9,10,11]
y=[0,1,4,9,16,25,36,49,64,81]
pyplot.plot(x,y,color='#FFFF99')
pyplot.show()
pyplot.plot(x,y,data=obj)数据在obj中绘制图像
obj支持所有可索引对象。例如dict,这可以是, pandas.DataFrame或结构化的numpy数组。这里先空出,没有想好怎么写例子,官网也没提供。
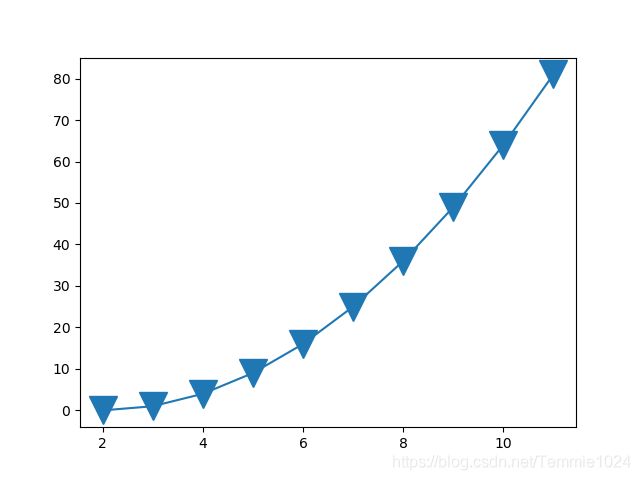
pyplot.plot(x,y,marker=’ ')绘制图像并改变标记形状
例:
from matplotlib import pyplot
x=[2,3,4,5,6,7,8,9,10,11]
y=[0,1,4,9,16,25,36,49,64,81]
pyplot.plot(x,y,marker='v')
pyplot.show()
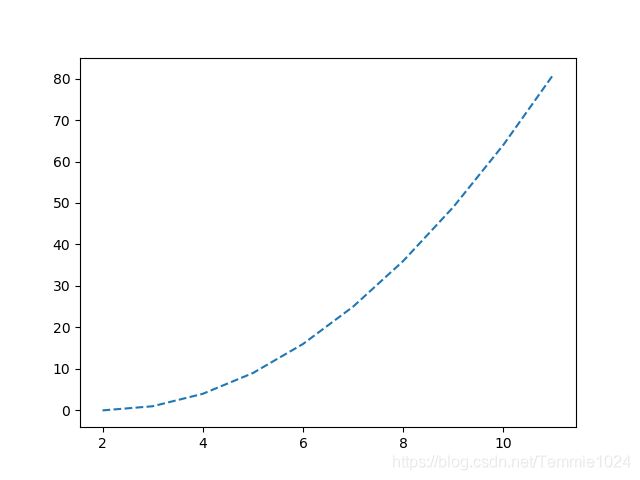
pyplot.plot(x,y,linestyle=’ ')绘制图像并改变线型
from matplotlib import pyplot
x=[2,3,4,5,6,7,8,9,10,11]
y=[0,1,4,9,16,25,36,49,64,81]
pyplot.plot(x,y,linestyle='--')
pyplot.show()
pyplot.plot(x,y,linewidth=num)绘制图像并改变线宽
num要求是浮点数。
例:
from matplotlib import pyplot
x=[2,3,4,5,6,7,8,9,10,11]
y=[0,1,4,9,16,25,36,49,64,81]
pyplot.plot(x,y,linestyle='--',linewidth=10)
pyplot.show()
pyplot.plot(x,y,marker=’ ',markersize=num)绘制图像并改变标记点大小
num要求是浮点数。
例:
from matplotlib import pyplot
x=[2,3,4,5,6,7,8,9,10,11]
y=[0,1,4,9,16,25,36,49,64,81]
pyplot.plot(x,y,marker='v',markersize=20)
pyplot.show()
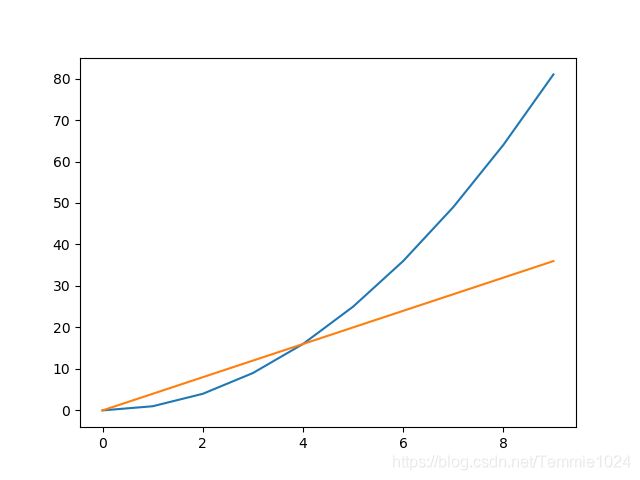
在一个表中绘制多个图像1.pyplot(x_1,y_1,x_2,y_2…)
from matplotlib import pyplot
x=[0,1,2,3,4,5,6,7,8,9]
y=[0,1,4,9,16,25,36,49,64,81]
z=[0,4,8,12,16,20,24,28,32,36]
pyplot.plot(x,y,x,z)
pyplot.show()
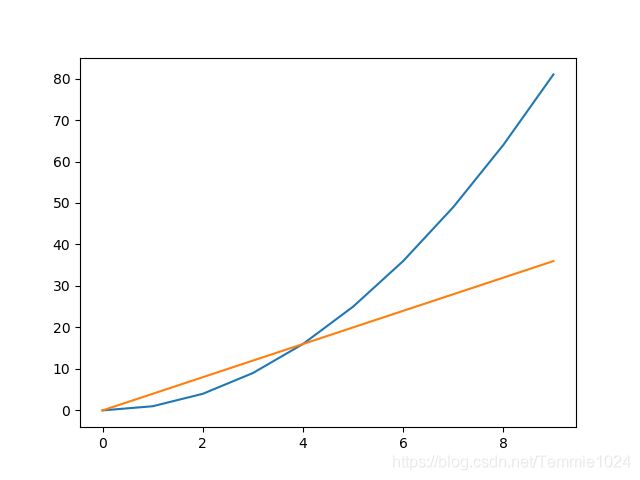
在一个表中绘制多个图像2.多次使用pyplot.plot(x,y)
from matplotlib import pyplot
x=[0,1,2,3,4,5,6,7,8,9]
y=[0,1,4,9,16,25,36,49,64,81]
z=[0,4,8,12,16,20,24,28,32,36]
pyplot.plot(x,y)
pyplot.plot(x,z)
pyplot.show()
在一个表中绘制多个图像3.使用pyplot.plot(x,y)其中y是嵌套列表
此处使用到了numpy,占时先空出。
f,(ax1,ax2…)=pyplot.subplot(a,b)在一个窗口中绘制多个图像
在一个窗口中绘制a行b列的图。
下面以绘制一行两列为例子:
from matplotlib import pyplot
x=[0,1,2,3,4,5,6,7,8,9]
y1=[0,1,4,9,16,25,36,49,64,81]
y2=[0,4,8,12,16,20,24,28,32,36]
f,(a,b)=pyplot.subplots(1,2)#返回的f好像是个窗口,可以不必管它,a与b分别代表第一个绘图位置和第二个绘图位置
a.plot(x,y1,color='green')
b.plot(x,y2,marker='v',markersize='20')
pyplot.show()
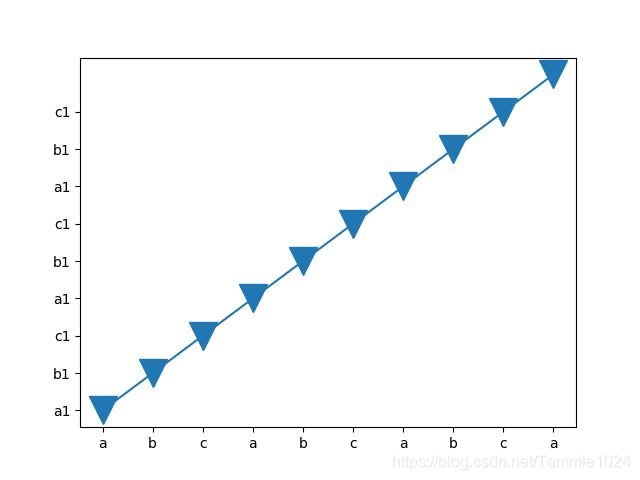
pyplot.x/yticks(ticks= ,labels= )给坐标轴添加标签
x和y的使用方式相同,注意ticks与labels一一对应。
from matplotlib import pyplot
x=[0,1,2,3,4,5,6,7,8,9]
y2=[0,4,8,12,16,20,24,28,32,36]
pyplot.plot(x,y2,marker='v',markersize='20')
pyplot.yticks(ticks=list(range (0,35,4)),labels=['a1','b1','c1','a1','b1','c1','a1','b1','c1'])
pyplot.xticks(ticks=list(range (0,10,1)),labels=['a','b','c','a','b','c','a','b','c','a'])
pyplot.show()
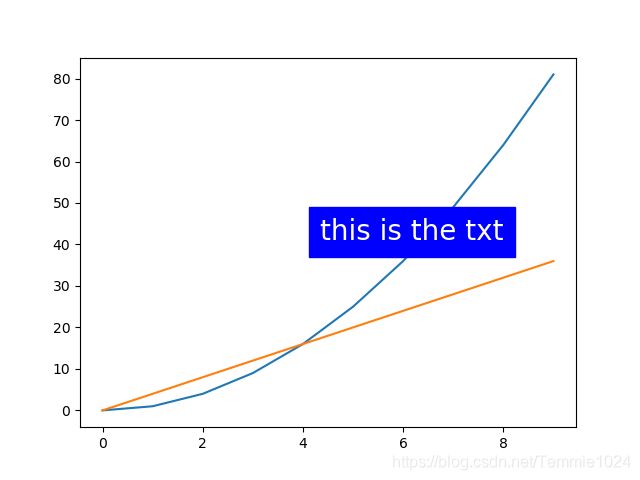
pyplot.figtext(x,y,txt)绘图并在x,y处添加文本
x与y是0-1之间的值,txt是字符串文本,也可以设置字大小,背景和字体颜色
from matplotlib import pyplot
x=[0,1,2,3,4,5,6,7,8,9]
y=[0,1,4,9,16,25,36,49,64,81]
z=[0,4,8,12,16,20,24,28,32,36]
pyplot.plot(x,y,x,z)
pyplot.figtext(0.5,0.5,'this is the txt',backgroundcolor='blue',color='white',fontsize=20)
pyplot.show()
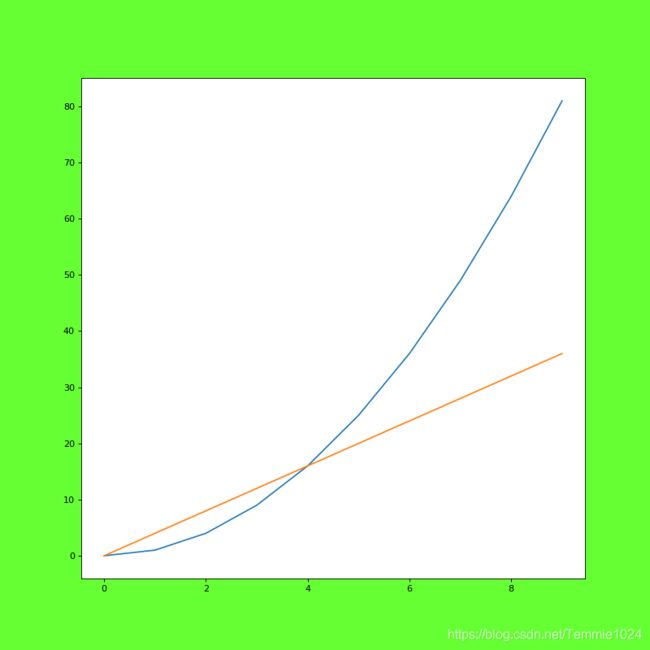
pyplot.figure(figsize=[a,b],dpi=c,facecolor= ,edgecolor= ,frameon= )创建一个新窗口,或激活一个现有窗口。
这些内容几乎都是可选项。
figsize:浮点数,宽度,高度以英寸为单位。
DPI:默认值为100。
facecolor:背景颜色,默认白色。
edgecolor:边框颜色,默认颜色。
frameon:布尔值,默认True,是否绘制边框。
注意这句话要放在绘图前,否则会产生新的窗口
from matplotlib import pyplot
x=[0,1,2,3,4,5,6,7,8,9]
y=[0,1,4,9,16,25,36,49,64,81]
z=[0,4,8,12,16,20,24,28,32,36]
pyplot.figure(figsize=[10,10],dpi=80,facecolor='#66FF33',edgecolor='#CCFF33',frameon=True )
pyplot.plot(x,y,x,z)
pyplot.show()
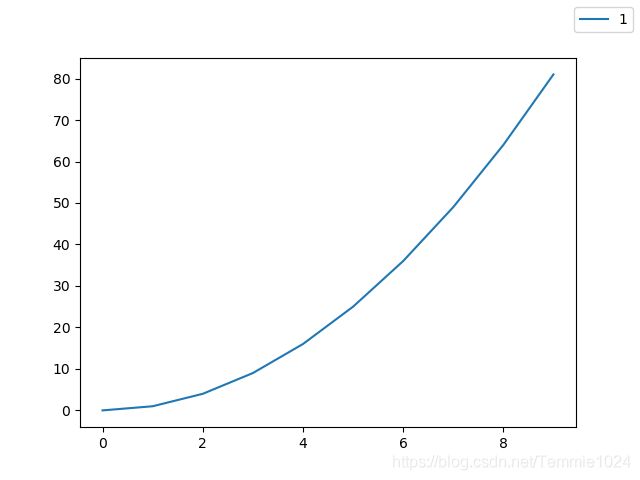
pyplot.figlegend()添加图例
from matplotlib import pyplot
x=[0,1,2,3,4,5,6,7,8,9]
y=[0,1,4,9,16,25,36,49,64,81]
z=[0,4,8,12,16,20,24,28,32,36]
pyplot.plot(x,y,label='1')
pyplot.figlegend()
pyplot.show()
from matplotlib import pyplot
x=[0,1,2,3,4,5,6,7,8,9]
y=[0,1,4,9,16,25,36,49,64,81]
z=[0,4,8,12,16,20,24,28,32,36]
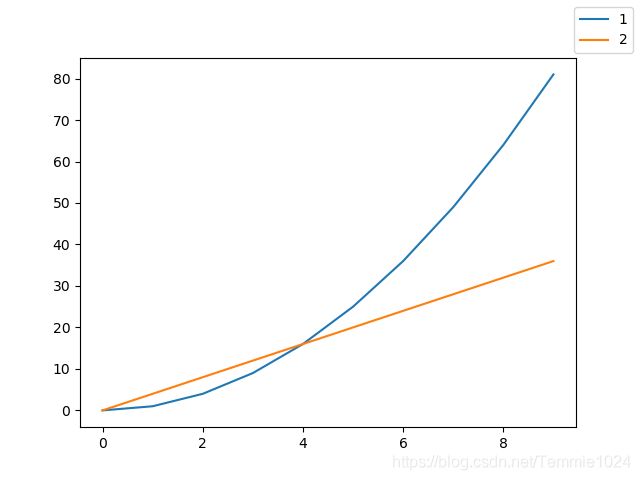
pyplot.plot(x,y,x,z)
pyplot.figlegend(['1','2'])
pyplot.show()
from matplotlib import pyplot
x=[0,1,2,3,4,5,6,7,8,9]
y=[0,1,4,9,16,25,36,49,64,81]
z=[0,4,8,12,16,20,24,28,32,36]
a,=pyplot.plot(x,y)
a.set_label('1')
pyplot.figlegend()
pyplot.show()
from matplotlib import pyplot
x=[0,1,2,3,4,5,6,7,8,9]
y=[0,1,4,9,16,25,36,49,64,81]
z=[0,4,8,12,16,20,24,28,32,36]
a,=pyplot.plot(x,y)
b,=pyplot.plot(x,z)
pyplot.figlegend([a,b],['1','2'])
pyplot.show()
pyplot.x/ylabel(txt,loc=)添加坐标轴标签
txt是文本
loc:位置,‘left’, ‘center’, ‘right’。(y变成’bottom’, ‘center’, ‘top’)
from matplotlib import pyplot
x=[0,1,2,3,4,5,6,7,8,9]
y=[0,1,4,9,16,25,36,49,64,81]
z=[0,4,8,12,16,20,24,28,32,36]
a,=pyplot.plot(x,y)
b,=pyplot.plot(x,z)
pyplot.xlabel('x',loc='center')
pyplot.ylabel('y',loc='center',rotation=0)
pyplot.show()
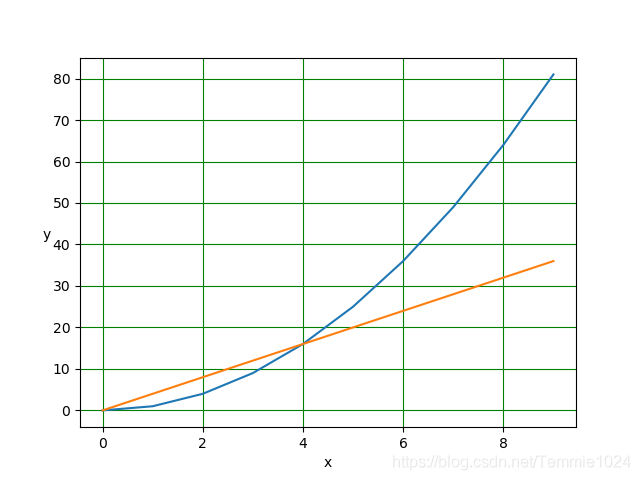
pyplot.grid()绘制网格
from matplotlib import pyplot
x=[0,1,2,3,4,5,6,7,8,9]
y=[0,1,4,9,16,25,36,49,64,81]
z=[0,4,8,12,16,20,24,28,32,36]
a,=pyplot.plot(x,y)
b,=pyplot.plot(x,z)
pyplot.xlabel('x',loc='center')
pyplot.ylabel('y',loc='center',rotation=0)
pyplot.grid(color='green')
pyplot.show()
font_manager设置字体并防止中文乱码
from matplotlib import pyplot
from matplotlib import font_manager
font_manager.FontProperties(fname='C:\Windows\Fonts\AdobeSongStd-Light.otf')
pyplot.rcParams['font.sans-serif']=['SimHei'] #用来正常显示中文标签
pyplot.rcParams['axes.unicode_minus']=False #用来正常显示负号
x=[0,1,2,3,4,5,6,7,8,9]
y=[0,1,4,9,16,25,36,49,64,81]
z=[0,4,8,12,16,20,24,28,32,36]
pyplot.plot(x,y,x,z)
txt=['第{0}个'.format(n)for n in range(1,6,1)]
pyplot.xlabel('x',loc='center')
pyplot.ylabel('y',loc='center',rotation=0)
pyplot.grid(color='green')
pyplot.xticks(x[0:9:2],txt,rotation=0)
pyplot.show()
这三句是关键
from matplotlib import font_manager
font_manager.FontProperties(fname='C:\Windows\Fonts\AdobeSongStd-Light.otf')
pyplot.rcParams['font.sans-serif']=['SimHei'] #用来正常显示中文标签
pyplot.rcParams['axes.unicode_minus']=False #用来正常显示负号
