Autumn 2014 Report #003 – 10/15/14 JianjianWu
I. Plan for next week (***, **, *: order of priority)
• 30%:Collect information about Baidu Echarts and D3.JS
• 70%:Begin the development of the visualization project
II. Tasks achieved this week(***, **, *: order of priority)
• 30%:Complete the tender of my project
• 10%:Learn something about the visualization project from Dr.Yan
• 60%:Collect information about Baidu Echarts
III. Feedback of Prof. Qiu Prof. Li and Dr. Yan last week
• The using of radar
• Prepare one question at least at weekly report time
IV. Reports
• The main technology rout of my project
PostgreSQL as the database of my project,Baidu Echars as the visualization
tool, Python as the development language.
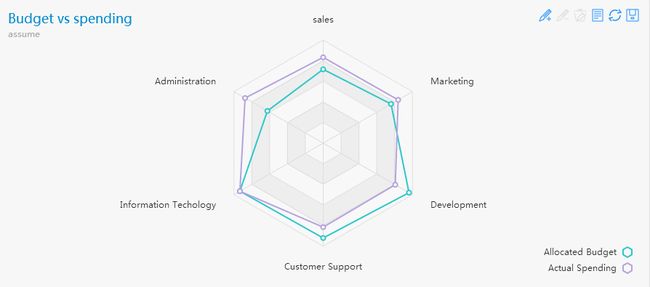
• An example of radar
option = {
title : {
text: 'Budget vs spending',
subtext: 'assume'
},
tooltip : {
trigger: 'axis'
},
legend: {
orient : 'vertical',
x : 'right',
y : 'bottom',
data:['Allocated Budget','Actual Spending']
},
toolbox: {
show : true,
feature : {
mark : {show: true},
dataView : {show: true, readOnly: false},
restore : {show: true},
saveAsImage : {show: true}
}
},
polar : [
{
indicator : [
{ text: 'sales', max: 6000},
{ text: 'Administration', max: 16000},
{ text: 'Information Techology', max: 30000},
{ text: 'Customer Support', max: 38000},
{ text: 'Development', max: 52000},
{ text: 'Marketing', max: 25000}
]
}
],
calculable : true,
series : [
{
name: 'Budget vs spending',
type: 'radar',
data : [
{
value : [4300, 10000, 28000, 35000, 50000, 19000],
name : 'Allocated Budget'
},
{
value : [5000, 14000, 28000, 31000, 42000, 21000],
name : 'Actual Spending'
}
]
}
]
};
V. Mile-Stone:
• Learn more and more knowledge about Baidu Echarts, finally use it to my visualization project
• Complete the project of the visualization
• Rich hands-on ability of myself