模型评估和超参数调优
模型评估和超参数调优
from IPython.display import Image
%matplotlib inline
1.通过管道Pipeline简化工作流程
在正式建立模型之前,一般会经理很多步骤的数据预处理,比如常见的数据清洗,缺失值处理,异常值处理,特征缩放和特征编
码,数据降维等等操作。通过使用sklearn中Pipeline类工具包可以实现去拟合一个包含了任意数量的数据转换步骤的模型,并使用它去对新的数据进行预测。
1.1加载乳腺癌数据集
数据集包含有569个样本和30个特征,各样本分别属于恶性和良性肿瘤细胞类别(malignant and begin tumor cells)
类别标签简写为M和B。使用该数据建立一个模型来预测肿瘤是恶性还是良性,即分类模型。
# 从UCI数据库中在线导入数据
import pandas as pd

df = pd.read_csv('https://archive.ics.uci.edu/ml/'
                 'machine-learning-databases'
                 '/breast-cancer-wisconsin/wdbc.data', header=None)

# 或者通过pd.read_csv()从本地目录载入
# df = pd.read_csv('wdbc.data', header=None)

df.head()
| 0 | 1 | 2 | 3 | 4 | 5 | 6 | 7 | 8 | 9 | ... | 22 | 23 | 24 | 25 | 26 | 27 | 28 | 29 | 30 | 31 | |
|---|---|---|---|---|---|---|---|---|---|---|---|---|---|---|---|---|---|---|---|---|---|
| 0 | 842302 | M | 17.99 | 10.38 | 122.80 | 1001.0 | 0.11840 | 0.27760 | 0.3001 | 0.14710 | ... | 25.38 | 17.33 | 184.60 | 2019.0 | 0.1622 | 0.6656 | 0.7119 | 0.2654 | 0.4601 | 0.11890 |
| 1 | 842517 | M | 20.57 | 17.77 | 132.90 | 1326.0 | 0.08474 | 0.07864 | 0.0869 | 0.07017 | ... | 24.99 | 23.41 | 158.80 | 1956.0 | 0.1238 | 0.1866 | 0.2416 | 0.1860 | 0.2750 | 0.08902 |
| 2 | 84300903 | M | 19.69 | 21.25 | 130.00 | 1203.0 | 0.10960 | 0.15990 | 0.1974 | 0.12790 | ... | 23.57 | 25.53 | 152.50 | 1709.0 | 0.1444 | 0.4245 | 0.4504 | 0.2430 | 0.3613 | 0.08758 |
| 3 | 84348301 | M | 11.42 | 20.38 | 77.58 | 386.1 | 0.14250 | 0.28390 | 0.2414 | 0.10520 | ... | 14.91 | 26.50 | 98.87 | 567.7 | 0.2098 | 0.8663 | 0.6869 | 0.2575 | 0.6638 | 0.17300 |
| 4 | 84358402 | M | 20.29 | 14.34 | 135.10 | 1297.0 | 0.10030 | 0.13280 | 0.1980 | 0.10430 | ... | 22.54 | 16.67 | 152.20 | 1575.0 | 0.1374 | 0.2050 | 0.4000 | 0.1625 | 0.2364 | 0.07678 |
5 rows × 32 columns
df.shape
(569, 32)
df.info()
RangeIndex: 569 entries, 0 to 568
Data columns (total 32 columns):
 #   Column  Non-Null Count  Dtype
---  ------  --------------  -----
 0   0       569 non-null    int64
 1   1       569 non-null    object
 2   2       569 non-null    float64
 3   3       569 non-null    float64
 4   4       569 non-null    float64
 5   5       569 non-null    float64
 6   6       569 non-null    float64
 7   7       569 non-null    float64
 8   8       569 non-null    float64
 9   9       569 non-null    float64
 10  10      569 non-null    float64
 11  11      569 non-null    float64
 12  12      569 non-null    float64
 13  13      569 non-null    float64
 14  14      569 non-null    float64
 15  15      569 non-null    float64
 16  16      569 non-null    float64
 17  17      569 non-null    float64
 18  18      569 non-null    float64
 19  19      569 non-null    float64
 20  20      569 non-null    float64
 21  21      569 non-null    float64
 22  22      569 non-null    float64
 23  23      569 non-null    float64
 24  24      569 non-null    float64
 25  25      569 non-null    float64
 26  26      569 non-null    float64
 27  27      569 non-null    float64
 28  28      569 non-null    float64
 29  29      569 non-null    float64
 30  30      569 non-null    float64
 31  31      569 non-null    float64
dtypes: float64(30), int64(1), object(1)
memory usage: 142.4+ KB
df.describe()
| 0 | 2 | 3 | 4 | 5 | 6 | 7 | 8 | 9 | 10 | ... | 22 | 23 | 24 | 25 | 26 | 27 | 28 | 29 | 30 | 31 | |
|---|---|---|---|---|---|---|---|---|---|---|---|---|---|---|---|---|---|---|---|---|---|
| count | 5.690000e+02 | 569.000000 | 569.000000 | 569.000000 | 569.000000 | 569.000000 | 569.000000 | 569.000000 | 569.000000 | 569.000000 | ... | 569.000000 | 569.000000 | 569.000000 | 569.000000 | 569.000000 | 569.000000 | 569.000000 | 569.000000 | 569.000000 | 569.000000 |
| mean | 3.037183e+07 | 14.127292 | 19.289649 | 91.969033 | 654.889104 | 0.096360 | 0.104341 | 0.088799 | 0.048919 | 0.181162 | ... | 16.269190 | 25.677223 | 107.261213 | 880.583128 | 0.132369 | 0.254265 | 0.272188 | 0.114606 | 0.290076 | 0.083946 |
| std | 1.250206e+08 | 3.524049 | 4.301036 | 24.298981 | 351.914129 | 0.014064 | 0.052813 | 0.079720 | 0.038803 | 0.027414 | ... | 4.833242 | 6.146258 | 33.602542 | 569.356993 | 0.022832 | 0.157336 | 0.208624 | 0.065732 | 0.061867 | 0.018061 |
| min | 8.670000e+03 | 6.981000 | 9.710000 | 43.790000 | 143.500000 | 0.052630 | 0.019380 | 0.000000 | 0.000000 | 0.106000 | ... | 7.930000 | 12.020000 | 50.410000 | 185.200000 | 0.071170 | 0.027290 | 0.000000 | 0.000000 | 0.156500 | 0.055040 |
| 25% | 8.692180e+05 | 11.700000 | 16.170000 | 75.170000 | 420.300000 | 0.086370 | 0.064920 | 0.029560 | 0.020310 | 0.161900 | ... | 13.010000 | 21.080000 | 84.110000 | 515.300000 | 0.116600 | 0.147200 | 0.114500 | 0.064930 | 0.250400 | 0.071460 |
| 50% | 9.060240e+05 | 13.370000 | 18.840000 | 86.240000 | 551.100000 | 0.095870 | 0.092630 | 0.061540 | 0.033500 | 0.179200 | ... | 14.970000 | 25.410000 | 97.660000 | 686.500000 | 0.131300 | 0.211900 | 0.226700 | 0.099930 | 0.282200 | 0.080040 |
| 75% | 8.813129e+06 | 15.780000 | 21.800000 | 104.100000 | 782.700000 | 0.105300 | 0.130400 | 0.130700 | 0.074000 | 0.195700 | ... | 18.790000 | 29.720000 | 125.400000 | 1084.000000 | 0.146000 | 0.339100 | 0.382900 | 0.161400 | 0.317900 | 0.092080 |
| max | 9.113205e+08 | 28.110000 | 39.280000 | 188.500000 | 2501.000000 | 0.163400 | 0.345400 | 0.426800 | 0.201200 | 0.304000 | ... | 36.040000 | 49.540000 | 251.200000 | 4254.000000 | 0.222600 | 1.058000 | 1.252000 | 0.291000 | 0.663800 | 0.207500 |
8 rows × 31 columns
# 将30个特征分配给numpy数组X, 将类别标签转换为数值型
from sklearn.preprocessing import LabelEncoder

X = df.loc[:, 2:].values
y = df.loc[:, 1].values
le = LabelEncoder()
y = le.fit_transform(y)
le.classes_
array(['B', 'M'], dtype=object)
# LabelEncoder将类别标签映射到0到n-1,其中n为类别个数
# 这里的恶性肿瘤对应“1”,良性肿瘤对应“0”
le.transform(['M', 'B'])
array([1, 0], dtype=int64)
# 直接划分训练集和测试集,划分比例为8:2
from sklearn.model_selection import train_test_split

X_train, X_test, y_train, y_test = \
    train_test_split(X, y,
                     test_size=0.20,
                     stratify=y,
                     random_state=1)
1.2通过管道Pipeline将“数据转换”和“模型评估器”组合到一起
根据上述df.describe()相关统计信息,发现数据中极值相差较大,因此进行数据标准化,将数据缩放到统一尺度,有利于加速梯度下降;这里原始数据维度较高,假定这里将原始数据通过主成分分析PCA降维到了2维子空间;
这里没有对数据标准化和主成分分析分别进行操作,而是通过Pipeline进行了联合操作。
from sklearn.preprocessing import StandardScaler
from sklearn.decomposition import PCA

from sklearn.linear_model import LogisticRegression
from sklearn.pipeline import make_pipeline

pipe_lr = make_pipeline(StandardScaler(),
                        PCA(n_components=2),
                        LogisticRegression(random_state=1, solver='lbfgs'))

# 训练拟合
pipe_lr.fit(X_train, y_train)
# 模型预测
y_pred = pipe_lr.predict(X_test)
# 结果输出
print('Test Accuracy: %.3f' % pipe_lr.score(X_test, y_test))
Test Accuracy: 0.956
通过上述代码示例,可以将Pipeline视为一个元评估器,或者是一个包装器,它包含了一些针对数据的单独转换操作。
执行上述代码中的fit方法之后,StandardScaler首先在管道中执行fit和transform的调用。
其次,将转换后的数据传递给PCA,经过PCA的拟合和转换,将数据传递给最后一个对象:模型,这里记为估计器estimator。
最后,LogisticRegression estimator拟合训练数据,此时数据已经是经过StandardScaler和PCA处理过的。
管道中可以包含的transform的个数没有限制,但最后一个对象一定要是一个模型对象,即estimator。
# scikit-learn提供的管道工具作为一种非常有效的包中工具,可以简化建模流程和代码,几何表示如下:
Image(filename='images/06_01.png', width=300)
2.使用交叉验证K-fold cross-validation评估模型性能
回顾:偏差-方差分解
模型过拟合:对应了模型具有高方差
模型欠拟合:对应了模型具有高偏差
方差:同样大小的数据集的变动,对模型性能造成的干扰,—集成学习中利用的baggign类模型思想
偏差:模型的预测结果与真实结果之间的差异,—集成学习中利用的Boosting类模型思想
这里介绍两种方式:留出法holdout,和K折交叉验证
2.1留出法holdout
holdout cross-validation:
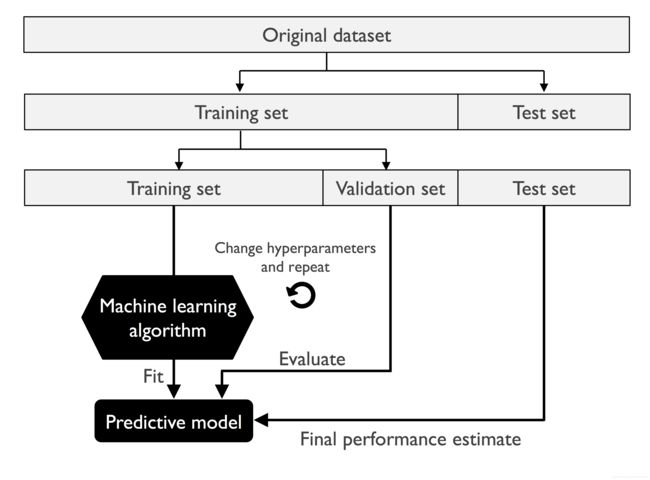
使用留出法:将数据集随机划分为互斥的两份数据,分别用于模型训练和模型测试,后者主要用来评估模型的泛化性能。
与此同时,我们也需要对比不同的参数设置来进一步提升模型性能,即模型选择过程。
在模型选择过程中,若反复使用相同的测试数据集,会极有可能导致模型过拟合。
具体来讲,留出法实际上将数据划分为了三个部分,即训练数据集、验证数据集、测试数据集。训练数据用于拟合不同的模型,验证集用于模型选择。图示如下:
Image(filename='images/06_02.png', width=300)
除了划分测试集数据量对最终结果有影响之外,哪些样本被划分为测试集也会造成不同的模型表现。因此下面使用k-fold交叉验证方法。
2.2K折交叉验证
K-fold cross validation:
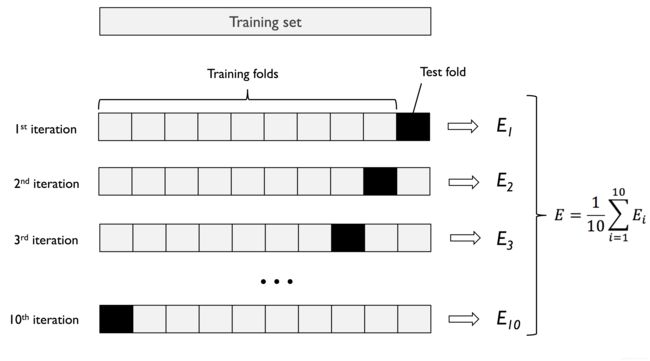
随机将数据集划分为K份,使用其中的K-1份进行模型训练,余下的一份用于模型测试。一般是平均分配使得每份数据量接近且数据分布尽可能一致。重复进行K次,因此会得到K个模型的结果,所以最终一般会取均值作为输出。
相关文献指出,设置K=10可能是比较好的选择:[1] Kohavi R . A study of cross-validation and bootstrap for accuracy estimation and model selection[C]// International joint conference on Artificial intelligence. Morgan Kaufmann Publishers Inc. 1995.
处理比较小的数据集,可以适当增加K的值,处理较大的数据集,可以适当减小K的值,如设置K=5.
# 当K=10的交叉验证方法几何表示:
Image(filename='images/06_03.png', width=300)
Leave-One_Out:LOO:适用于稀疏小数据
当样本总共有N条,若设置K折交叉验证的K为N,则K折交叉验证进化为了留一法,即LOO:
留一法:每个模型的训练基本都使用了全部数据,则得到的模型和通过全部数据训练得到的模型更加相似,而且
结果不会受到数据划分方式的影响。然而:当数据量较大的适合,这种方法可能会比较耗时。
2.3使用分层K折交叉验证
分层K折交叉验证:stratified K-fold cross-validation:
分层K折交叉验证是对传统K-折交叉验证的改进提升,它可以对模型偏差和方差做更好的权衡
尤其是在当:类别比例不平衡的时候,分层K折交叉验证保证了类别比例,即fold和原始数据中类别比例相同或类似。
# 使用分层K折交叉验证
import numpy as np
from sklearn.model_selection import StratifiedKFold


kfold = StratifiedKFold(n_splits=10).split(X_train, y_train)

scores = []
for k, (train, test) in enumerate(kfold):
    pipe_lr.fit(X_train[train], y_train[train])
    score = pipe_lr.score(X_train[test], y_train[test])
    scores.append(score)
    print('Fold: %2d, Class dist.: %s, Acc: %.3f' % (k+1,
          np.bincount(y_train[train]), score))

print('\nCV accuracy: %.3f +/- %.3f' % (np.mean(scores), np.std(scores)))
Fold:  1, Class dist.: [256 153], Acc: 0.935
Fold:  2, Class dist.: [256 153], Acc: 0.935
Fold:  3, Class dist.: [256 153], Acc: 0.957
Fold:  4, Class dist.: [256 153], Acc: 0.957
Fold:  5, Class dist.: [256 153], Acc: 0.935
Fold:  6, Class dist.: [257 153], Acc: 0.956
Fold:  7, Class dist.: [257 153], Acc: 0.978
Fold:  8, Class dist.: [257 153], Acc: 0.933
Fold:  9, Class dist.: [257 153], Acc: 0.956
Fold: 10, Class dist.: [257 153], Acc: 0.956

CV accuracy: 0.950 +/- 0.014
# 使用cross_val_score进一步验证模型,它允许使用分层K折交叉验证
from sklearn.model_selection import cross_val_score

scores = cross_val_score(estimator=pipe_lr,
                         X=X_train,
                         y=y_train,
                         cv=10,
                         n_jobs=1)
# 可以通过设置n_jobs参数为-1,实现对全部CPU核心的使用
print('CV accuracy scores: %s' % scores)
print('CV accuracy: %.3f +/- %.3f' % (np.mean(scores), np.std(scores)))
CV accuracy scores: [0.93478261 0.93478261 0.95652174 0.95652174 0.93478261 0.95555556
 0.97777778 0.93333333 0.95555556 0.95555556]
CV accuracy: 0.950 +/- 0.014
3.使用学习和验证曲线调试算法
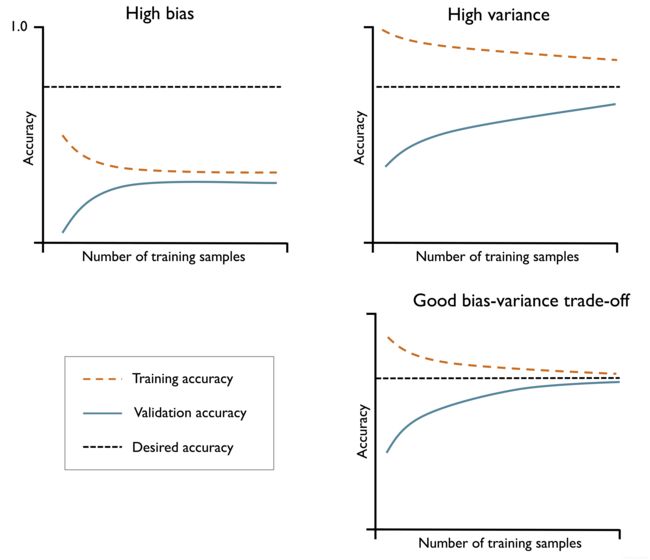
即通过模型的学习曲线和验证曲线来直观反映模型性能,诊断模型是否具有高方差—过拟合,高偏差—欠拟合等问题。
通过绘制模型训练和验证精度变化曲线,可以方便地检测出模型是否具有过拟合或欠拟合问题。几何表示如下:
Image(filename='images/06_04.png', width=500)
当模型具有高偏差,说明模型遭遇了欠拟合,对于这种情况,可以适当增加模型参数,提升模型复杂度;
比如:收集更多数据特征或者直接进行特征构造,或者降低模型的正则化程度。
当模型具有高方差,说明模型在训练集和测试集上的表现具有巨大差异,即过拟合。对于这种情况,可以收集更多数据,降低模
型复杂度,增加正则化力度。也可以进一步进行特征选择,减少特征数量,通过特征提取降低数据维度。但实际上,收集更多的数据
一般是无法实现的,或者收集的数据中包含有噪音,这反而会适得其反。
3.1使用学习曲线中和模型偏差和方差
# 使用学习曲线,评估模型
import matplotlib.pyplot as plt
from sklearn.model_selection import learning_curve


# 构造pipeline对象,
pipe_lr = make_pipeline(StandardScaler(),
                        LogisticRegression(penalty='l2', random_state=1,
                                           solver='lbfgs', max_iter=10000))

train_sizes, train_scores, test_scores =\
                learning_curve(estimator=pipe_lr,
                               X=X_train,
                               y=y_train,
                               train_sizes=np.linspace(0.1, 1.0, 10),
                               cv=10,
                               n_jobs=1)

train_mean = np.mean(train_scores, axis=1)
train_std = np.std(train_scores, axis=1)
test_mean = np.mean(test_scores, axis=1)
test_std = np.std(test_scores, axis=1)

plt.plot(train_sizes, train_mean,
         color='blue', marker='o',
         markersize=5, label='Training accuracy')

plt.fill_between(train_sizes,
                 train_mean + train_std,
                 train_mean - train_std,
                 alpha=0.15, color='blue')

plt.plot(train_sizes, test_mean,
         color='green', linestyle='--',
         marker='s', markersize=5,
         label='Validation accuracy')

plt.fill_between(train_sizes,
                 test_mean + test_std,
                 test_mean - test_std,
                 alpha=0.15, color='green')

plt.grid()
plt.xlabel('Number of training examples')
plt.ylabel('Accuracy')
plt.legend(loc='lower right')
plt.ylim([0.8, 1.03])
plt.tight_layout()
# plt.savefig('images/06_05.png', dpi=300)
plt.show()
可以看出,在当训练样本数少于250的时候,模型遭遇了明显的过拟合。样本数大于250后,模型表现正常。
3.2使用验证曲线处理过拟合和欠拟合
验证曲线与学习曲线比较类似,但是学习曲线绘制的是训练和测试准确率随样本数量的变化情况,这里验证的是某一个模型参数。比如逻辑回归模型的正则项参数的逆“C”。
from sklearn.model_selection import validation_curve


param_range = [0.001, 0.01, 0.1, 1.0, 10.0, 100.0]
# 通过‘logisticregression_c’明确指定这里需要评估的参数
train_scores, test_scores = validation_curve(
                estimator=pipe_lr,
                X=X_train,
                y=y_train,
                param_name='logisticregression__C',
                param_range=param_range,
                cv=10)

train_mean = np.mean(train_scores, axis=1)
train_std = np.std(train_scores, axis=1)
test_mean = np.mean(test_scores, axis=1)
test_std = np.std(test_scores, axis=1)

plt.plot(param_range, train_mean,
         color='blue', marker='o',
         markersize=5, label='Training accuracy')

plt.fill_between(param_range, train_mean + train_std,
                 train_mean - train_std, alpha=0.15,
                 color='blue')

plt.plot(param_range, test_mean,
         color='green', linestyle='--',
         marker='s', markersize=5,
         label='Validation accuracy')

plt.fill_between(param_range,
                 test_mean + test_std,
                 test_mean - test_std,
                 alpha=0.15, color='green')

plt.grid()
plt.xscale('log')
plt.legend(loc='lower right')
plt.xlabel('Parameter C')
plt.ylabel('Accuracy')
plt.ylim([0.8, 1.0])
plt.tight_layout()
# plt.savefig('images/06_06.png', dpi=300)
plt.show()
可以看出,当正则化程度增加,即随着“C”取值的减小,模型出现了轻微的欠拟合;
当正则化程度降低,即随着“C”取值的增加,模型出现了一定的过拟合;
在这里,比较合适的“C值”在0.01与0.1之间。
4通过网格搜索对机器学习模型进行微调(Fine-tuning)
参数和超参数:
在机器学习中,有两种类型的参数,一类是从训练数据中学得的,比如逻辑回归模型的权重参数,这一类叫做模型的参数。
另一类是,需要单独优化的算法参数,通常需要学习者进行探索指定,这一类叫做超参数,即hyperparameters。
超参数示例:逻辑回归模型的正则项系数,决策树模型树的深度,K近邻模型的K等等。
网格搜索调参:
调参,调整的对象是超参数,常用的方法:网格搜索,随机搜索,或者结合智能算法进行模型参数优化。
4.1通过网格搜索进行超参数调优
通过网格搜索来寻找超参数的最优组合,从而进一步提升模型性能。
from sklearn.model_selection import GridSearchCV
from sklearn.svm import SVC

# 构造Pipeline管道对象
pipe_svc = make_pipeline(StandardScaler(),
                         SVC(random_state=1))

param_range = [0.0001, 0.001, 0.01, 0.1, 1.0, 10.0, 100.0, 1000.0]

# 开始时间
start_time = time.time()

# 网格搜索参数字典
param_grid = [{
     'svc__C': param_range,
               'svc__kernel': ['linear']},
              {
     'svc__C': param_range,
               'svc__gamma': param_range,
               'svc__kernel': ['rbf']}] # 使用径向基函数,即RBF核

gs = GridSearchCV(estimator=pipe_svc,
                  param_grid=param_grid,
                  scoring='accuracy',
                  refit=True,
                  cv=10,
                  n_jobs=-1) # n_jobs实现利用CPU全部核心
gs = gs.fit(X_train, y_train)
print(gs.best_score_)
print(gs.best_params_)

# 结束时间
end_time = time.time()
# 所用时间
print('网格搜索调参所用时间:', end_time-start_time)
0.9846859903381642
{'svc__C': 100.0, 'svc__gamma': 0.001, 'svc__kernel': 'rbf'}
网格搜索调参所用时间: 2.5918848514556885
网格搜索是一种寻找最优参数记得有效方法,但对于所有的参数组合,网格搜索需要强大的算力消耗。个人一般使用的是随机搜索调参。
网格搜索类工具包具有一个refit参数,实际上他的默认值为:refit=True
clf = gs.best_estimator_

# 可以直接利用best_estimatou属性来进行对测试集的验证,从而评估模型。这里不需要再次拟合训练数据

print('Test accuracy: %.3f' % clf.score(X_test, y_test))
Test accuracy: 0.974
4.2 随机搜索参数调整
from sklearn.model_selection import RandomizedSearchCV
from sklearn.svm import SVC

# 构造Pipeline管道对象
pipe_svc = make_pipeline(StandardScaler(),
                         SVC(random_state=1))

param_range = [0.0001, 0.001, 0.01, 0.1, 1.0, 10.0, 100.0, 1000.0]

import time

# 开始时间
start_time = time.time()

# 网格搜索参数字典
param_random = [{
     'svc__C': param_range,
               'svc__kernel': ['linear']},
              {
     'svc__C': param_range,
               'svc__gamma': param_range,
               'svc__kernel': ['rbf']}] # 使用径向基函数,即RBF核

gs_random = RandomizedSearchCV(estimator=pipe_svc,
                  param_distributions=param_random,
                  scoring='accuracy',
                  refit=True,
                  cv=10,
                  n_jobs=-1) # n_jobs实现利用CPU全部核心
gs_random = gs_random.fit(X_train, y_train)
print(gs_random.best_score_)
print(gs_random.best_params_)

# 结束时间
end_time = time.time()
# 所用时间
print('随机搜索调参所用时间:', end_time-start_time)
0.9846859903381642
{'svc__kernel': 'rbf', 'svc__gamma': 0.0001, 'svc__C': 1000.0}
随机搜索调参所用时间: 4.394542694091797
5.通过嵌套交叉验证进行算法选择
前面所使用的K折交叉验证和网格搜索调参,通过改变超参数来对模型进行微调,从而获得模型性能的提升。
但是,当需要在不同的机器学习算法中进行选择,另一个推荐的方法是嵌套交叉验证。
当使用嵌套交叉验证时,估计的真实误差相对于测试数据集几乎是无偏的。
嵌套交叉验证:
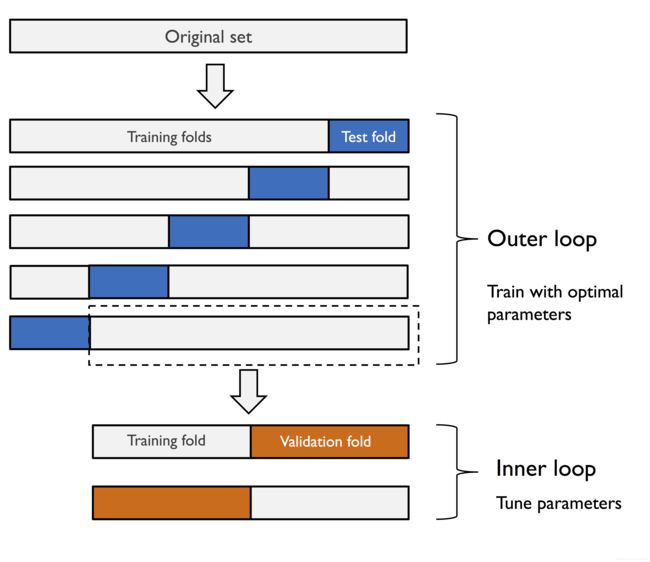
如下图所示:嵌套交叉验证中,有一个外部的K-fold交叉验证循环,将数据划分为训练集和测试集。一个内部循环用于在训练fold上
使用K-折交叉验证进行模型的选择。当模型选择完成之后,利用test fold来进行模型性能评估。
# 具有5个外部fold和2个内部fold,
Image(filename='images/06_07.png', width=500)
上图所示的算法,对于计算性能很重要的大型数据集非常奏效,上图也称为5x2交叉验证。
# 通过sklearn使用嵌套交叉验证,模型使用的是SVM
gs = GridSearchCV(estimator=pipe_svc,
                  param_grid=param_grid,
                  scoring='accuracy',
                  cv=2)

scores = cross_val_score(gs, X_train, y_train,
                         scoring='accuracy', cv=5)
print('CV accuracy: %.3f +/- %.3f' % (np.mean(scores),
                                      np.std(scores)))
CV accuracy: 0.974 +/- 0.015
使用嵌套交叉验证来对比SVM和决策树分类器
这里为了简便起见,仅仅调整树的深度,即max_depth。SVM模型为上面的那个:
from sklearn.tree import DecisionTreeClassifier

gs = GridSearchCV(estimator=DecisionTreeClassifier(random_state=0),
                  param_grid=[{
     'max_depth': [1, 2, 3, 4, 5, 6, 7, None]}],
                  scoring='accuracy',
                  cv=2)

scores = cross_val_score(gs, X_train, y_train,
                         scoring='accuracy', cv=5)
print('CV accuracy: %.3f +/- %.3f' % (np.mean(scores),
                                      np.std(scores)))
CV accuracy: 0.934 +/- 0.016
6.使用不同的模型评估指标
上面对于模型的评估所使用的都是预测准确率,即prediction accuracy。
实际上还有很多其他的模型评估指标,比如:精确率、召回率、F值等;
其中,当数据类别不平衡的时候,或者使用了代价敏感学习模型的时候,仅仅使用传统的accuracy就不合适了。
6.1混淆矩阵
# 混淆矩阵图示
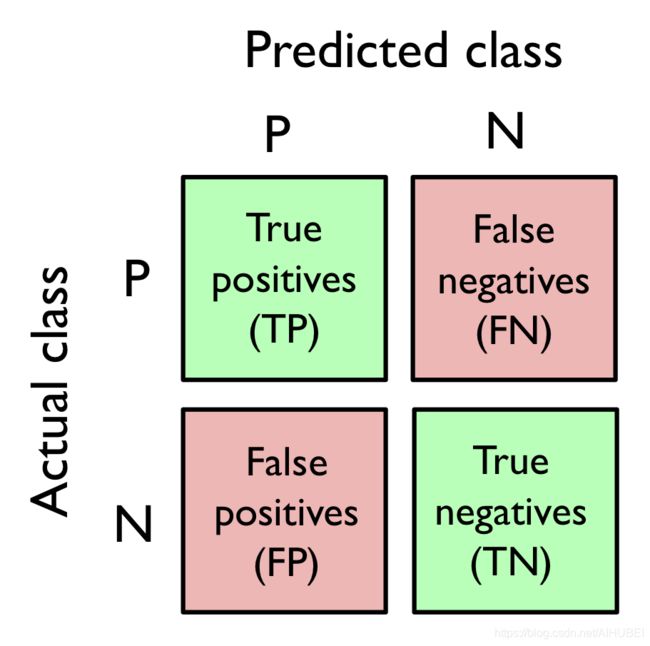
Image(filename='images/06_08.png', width=300)
约定:
true positive(TP)、true negative(TN)
false positive(FP)、false negative(FN)
精确率和召回率(查准率和查全率)
P = T P T P + F P R = T P T P + F N \begin{aligned} P &=\frac{T P}{T P+F P} \\ R &=\frac{T P}{T P+F N} \end{aligned} PR=TP+FPTP=TP+FNTP
精确率:预测为真的所有个体中,真实类别为真的比例
召回率:所有真实类别为真的个体中,预测为真的比例
F 1 = 2 ⋅ P ⋅ R ( P + R ) F_1 = \frac{2\cdot P \cdot R}{(P+R)} F1=(P+R)2⋅P⋅R
F β = ( 1 + β 2 ) × P × R ( β 2 × P ) + R F_{\beta}=\frac{\left(1+\beta^{2}\right) \times P \times R}{\left(\beta^{2} \times P\right)+R} Fβ=(β2×P)+R(1+β2)×P×R
# 使用sklearn计算混淆矩阵
from sklearn.metrics import confusion_matrix

pipe_svc.fit(X_train, y_train)
y_pred = pipe_svc.predict(X_test)
confmat = confusion_matrix(y_true=y_test, y_pred=y_pred)

"""
函数confusion_matrix()的参数
y_true,
    y_pred,
    *,
    labels=None,
    sample_weight=None,
    normalize=None,
"""
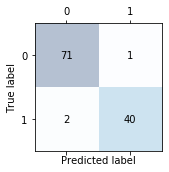
print(confmat)
[[71  1]
 [ 2 40]]
# 混淆矩阵的可视化
fig, ax = plt.subplots(figsize=(2.5, 2.5))
ax.matshow(confmat, cmap=plt.cm.Blues, alpha=0.3)

for i in range(confmat.shape[0]):
    for j in range(confmat.shape[1]):
        ax.text(x=j, y=i, s=confmat[i, j], va='center', ha='center')

plt.xlabel('Predicted label')
plt.ylabel('True label')

plt.tight_layout()
#plt.savefig('images/06_09.png', dpi=300)
plt.show()
6.2 附加内容
实际上,前面已经对乳腺癌数据类别标签进行了数值化,恶性肿瘤和良性肿瘤分别编码为:1和0
le.transform(['M', 'B'])
array([1, 0], dtype=int64)
confmat = confusion_matrix(y_true=y_test, y_pred=y_pred)
print(confmat)
[[71  1]
 [ 2 40]]
confmat = confusion_matrix(y_true=y_test, y_pred=y_pred)
print(confmat)
[[71  1]
 [ 2 40]]
但是,我们需要注意:这里的标签为0的才是真正的正样本,因为0代表的是:良性
所以上面混淆矩阵的71代表的应该是(1,1)
# 位置调整
confmat = confusion_matrix(y_true=y_test, y_pred=y_pred, labels=[1, 0])
print(confmat)
[[40  2]
 [ 1 71]]
7优化分类模型的精确率和召回率
真正率和假正率:是一对对于处理不平衡数据问题非常有用的指标----以及衍生出的ROC和AUC。
F P R = F P N = F P F P + T N T P R = T P P = T P F N + T P \begin{array}{l} F P R=\frac{F P}{N}=\frac{F P}{F P+T N} \\ T P R=\frac{T P}{P}=\frac{T P}{F N+T P} \end{array} FPR=NFP=FP+TNFPTPR=PTP=FN+TPTP
from sklearn.metrics import precision_score, recall_score, f1_score

print('Precision: %.3f' % precision_score(y_true=y_test, y_pred=y_pred))
print('Recall: %.3f' % recall_score(y_true=y_test, y_pred=y_pred))
print('F1: %.3f' % f1_score(y_true=y_test, y_pred=y_pred))
Precision: 0.976
Recall: 0.952
F1: 0.964
注意: sklearn中正样本是被标记为“1”的,
from sklearn.metrics import make_scorer

scorer = make_scorer(f1_score, pos_label=0)

c_gamma_range = [0.01, 0.1, 1.0, 10.0]

param_grid = [{
     'svc__C': c_gamma_range,
               'svc__kernel': ['linear']},
              {
     'svc__C': c_gamma_range,
               'svc__gamma': c_gamma_range,
               'svc__kernel': ['rbf']}]

gs = GridSearchCV(estimator=pipe_svc,
                  param_grid=param_grid,
                  scoring=scorer,
                  cv=10,
                  n_jobs=-1)
gs = gs.fit(X_train, y_train)
print(gs.best_score_)
print(gs.best_params_)
0.9861994953378878
{'svc__C': 10.0, 'svc__gamma': 0.01, 'svc__kernel': 'rbf'}
7.1绘制ROC曲线
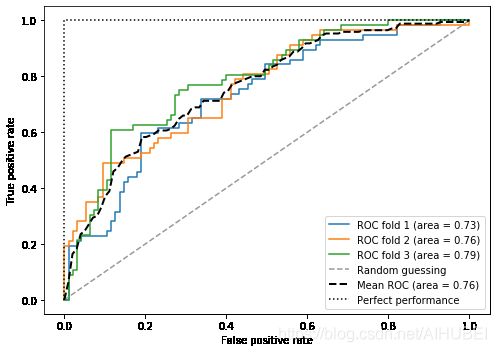
ROC曲线又称为:受试者工作特征曲线。**它是通过改变分类器的决策阈值来计算的。**分别使用真正率和假正率作为纵轴和横轴。
ROC曲线的对角线可以解释为随机猜测。低于对角线的分类模型被认为比随机猜测更差。完美的分类器会落在图的左上角,此时AUC为1
from sklearn.metrics import roc_curve, auc
from distutils.version import LooseVersion as Version
from scipy import __version__ as scipy_version


if scipy_version >= Version('1.4.1'):
    from numpy import interp
else:
    from scipy import interp


pipe_lr = make_pipeline(StandardScaler(),
                        PCA(n_components=2),
                        LogisticRegression(penalty='l2',
                                           random_state=1,
                                           solver='lbfgs',
                                           C=100.0))

X_train2 = X_train[:, [4, 14]]


cv = list(StratifiedKFold(n_splits=3).split(X_train, y_train))

fig = plt.figure(figsize=(7, 5))

mean_tpr = 0.0
mean_fpr = np.linspace(0, 1, 100)
all_tpr = []

for i, (train, test) in enumerate(cv):
    probas = pipe_lr.fit(X_train2[train],
                         y_train[train]).predict_proba(X_train2[test])

    fpr, tpr, thresholds = roc_curve(y_train[test],
                                     probas[:, 1],
                                     pos_label=1)
    mean_tpr += interp(mean_fpr, fpr, tpr)
    mean_tpr[0] = 0.0
    roc_auc = auc(fpr, tpr)
    plt.plot(fpr,
             tpr,
             label='ROC fold %d (area = %0.2f)'
                   % (i+1, roc_auc))

plt.plot([0, 1],
         [0, 1],
         linestyle='--',
         color=(0.6, 0.6, 0.6),
         label='Random guessing')

mean_tpr /= len(cv)
mean_tpr[-1] = 1.0
mean_auc = auc(mean_fpr, mean_tpr)
plt.plot(mean_fpr, mean_tpr, 'k--',
         label='Mean ROC (area = %0.2f)' % mean_auc, lw=2)
plt.plot([0, 0, 1],
         [0, 1, 1],
         linestyle=':',
         color='black',
         label='Perfect performance')

plt.xlim([-0.05, 1.05])
plt.ylim([-0.05, 1.05])
plt.xlabel('False positive rate')
plt.ylabel('True positive rate')
plt.legend(loc="lower right")

plt.tight_layout()
# plt.savefig('images/06_10.png', dpi=300)
plt.show()
7.2多分类的评估指标
pre_scorer = make_scorer(score_func=precision_score,
                         pos_label=1,
                         greater_is_better=True,
                         average='micro')                        # 设置average的参数为micro,即微平均值
micro-average由学习系统的个体 T P s , T N s , F P s , F N s TP_s, TN_s, FP_s, FN_s TPs,TNs,FPs,FNs计算得到。
精确率的微观平均值计算如下:
P R E micro = T P 1 + ⋯ + T P k T P 1 + ⋯ + T P k + F P 1 + ⋯ + F P k P R E_{\text {micro }}=\frac{T P_{1}+\cdots+T P_{k}}{T P_{1}+\cdots+T P_{k}+F P_{1}+\cdots+F P_{k}} PREmicro =TP1+⋯+TPk+FP1+⋯+FPkTP1+⋯+TPk
精确率的宏观平均值计算如下:
P R E macro = P R E 1 + ⋯ + P R E k k P R E_{\text {macro }}=\frac{P R E_{1}+\cdots+P R E_{k}}{k} PREmacro =kPRE1+⋯+PREk
7.3处理不平衡数据
关于不平衡数据的挖掘方法研究综述:
参考链接:不平衡数据挖掘综述
X_imb = np.vstack((X[y == 0], X[y == 1][:40]))
y_imb = np.hstack((y[y == 0], y[y == 1][:40]))
y_pred = np.zeros(y_imb.shape[0])
np.mean(y_pred == y_imb) * 100
89.92443324937027
from sklearn.utils import resample

print('Number of class 1 examples before:', X_imb[y_imb == 1].shape[0])

X_upsampled, y_upsampled = resample(X_imb[y_imb == 1],
                                    y_imb[y_imb == 1],
                                    replace=True,
                                    n_samples=X_imb[y_imb == 0].shape[0],
                                    random_state=123)

print('Number of class 1 examples after:', X_upsampled.shape[0])
Number of class 1 examples before: 40
Number of class 1 examples after: 357
X_bal = np.vstack((X[y == 0], X_upsampled))
y_bal = np.hstack((y[y == 0], y_upsampled))
y_pred = np.zeros(y_bal.shape[0])
np.mean(y_pred == y_bal) * 100
50.0

