前言
在日常的业务数据分析 ,可视化是非常重要的步骤。这里总结了matplotlib常用绘图技巧,希望可以帮助大家更加更加高效的、美观的显示图表。作者:北山啦
Matplotlib 是 Python 的绘图库。 它可与 NumPy 一起使用,提供了一种有效的 MatLab 开源替代方案。 它也可以和图形工具包一起使用,如 PyQt 和wxPython。
pip3 install matplotlib -i https://pypi.tuna.tsinghua.edu.cn/simple
import matplotlib.pyplot as plt
显示中文
借助全局参数配置字典rcParams,只需要在代码开头,添加如下两行代码即可
plt.rcParams['font.sans-serif'] = ['SimHei']
plt.rcParams['axes.unicode_minus'] = False
同时还可以设置字体,常见字体:
font.family 字体的名称
sans-serif 西文字体(默认)
SimHei 中文黑体
FangSong 中文仿宋
YouYuan 中文幼圆
STSong 华文宋体
Kaiti 中文楷体
LiSu 中文隶书
字体风格
plt.rcParams["font.style"] = "italic"
绘制子图
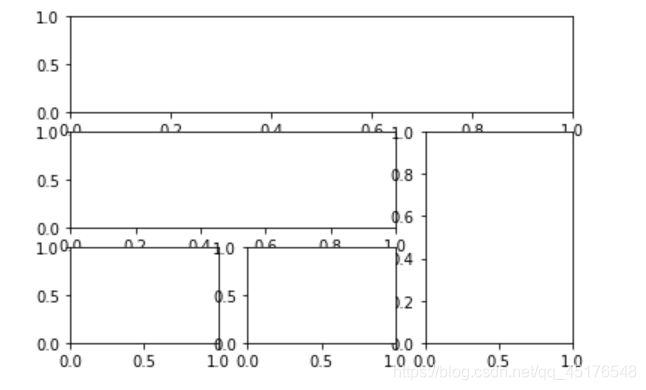
plt.subplot2grid()
plt.subplot2grid((3,3),(0,0),colspan=3)
""""""
plt.subplot2grid((3,3),(1,0),colspan=2)
""""""
plt.subplot2grid((3,3),(1,2),rowspan=2)
""""""
plt.subplot2grid((3,3),(2,0))
""""""
plt.subplot2grid((3,3),(2,1))
plt.show()
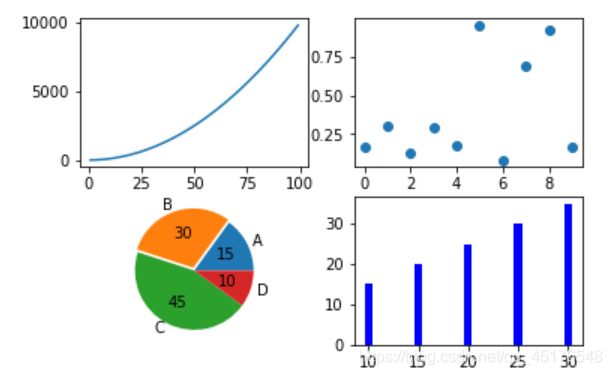
import numpy as np
import pandas as pd
import matplotlib.pyplot as plt
# 画第1个图:折线图
x=np.arange(1,100)
plt.subplot(221)
plt.plot(x,x*x)
# 画第2个图:散点图
plt.subplot(222)
plt.scatter(np.arange(0,10), np.random.rand(10))
# 画第3个图:饼图
plt.subplot(223)
plt.pie(x=[15,30,45,10],labels=list('ABCD'),autopct='%.0f',explode=[0,0.05,0,0])

# 画第4个图:条形图
plt.subplot(224)
plt.bar([20,10,30,25,15],[25,15,35,30,20],color='b')
plt.show()
matplotlib绘图设置不显示边框、坐标轴
对于有些图形我们希望通过隐藏坐标轴来显得更加美观
plt.xticks([])
plt.yticks([])
ax = plt.subplot(2,5,1)
# 去除黑框
ax.spines['top'].set_visible(False)
ax.spines['right'].set_visible(False)
ax.spines['bottom'].set_visible(False)
ax.spines['left'].set_visible(False)
实例:
#author:https://beishan.blog.csdn.net/
import matplotlib.pyplot as plt
for i in range(0,10):
    fig = plt.gcf()
    fig.set_size_inches(12,6)
    ax = plt.subplot(2,5,i+1)
    # 去除坐标轴
    plt.xticks([])
    plt.yticks([])

    # 去除黑框
    ax.spines['top'].set_visible(False)
    ax.spines['right'].set_visible(False)
    ax.spines['bottom'].set_visible(False)
    ax.spines['left'].set_visible(False)
    # 设置各个子图间间距
    plt.subplots_adjust(left=0.10, top=0.88, right=0.65, bottom=0.08, wspace=0.02, hspace=0.02)
    ax.imshow(Xtrain[i],cmap="binary")
提高分辨率
如果感觉默认生成的图形分辨率不够高,可以尝试修改 dpi 来提高分辨率
plt.figure(figsize = (7,6),dpi =100)
设置绘图风格
有时我们会觉得matplotlib默认制作出来的图片太朴素了,不够高级,其实开发者也内置了几十种主题让我们自己选择,只要使用plt.style.use(‘主题名')指定主题即可
plt.style.use('ggplot')
常用的样式有
Solarize_Light2
_classic_test_patch
bmh
classic
dark_background
fast
fivethirtyeight
ggplot
grayscale
seaborn
seaborn-bright
seaborn-colorblind
seaborn-dark
seaborn-dark-palette
seaborn-darkgrid
seaborn-deep
seaborn-muted
seaborn-notebook
seaborn-paper
seaborn-pastel
seaborn-poster
seaborn-talk
seaborn-ticks
seaborn-white
seaborn-whitegrid
tableau-colorblind10
添加标题
plt.title("2020-2021北山啦粉丝数增长图")
显示网格
plt.grid()
plt.grid(color='g',linewidth='1',linestyle='-.')
图例设置
plt.legend(["2020","2021"],loc="best")
也可以给图例添加标题
plt.plot([1,3,5,7],[4,9,6,8],"ro--")
plt.plot([1,2,3,4], [2,4,6,8],"gs-.")
plt.legend(["2020","2021"],loc="best",title="标题")
plt.title("2020-2021北山啦粉丝数增长图")
添加公式
有时我们在绘图时需要添加带有数学符号、公式的文字,
plt.text(11000,0.45,r'拟合曲线为$f(x) = x^2-4x+0.5$')
图形交互设置
jupyter中的魔法方法
%matplotlib notebook 弹出可交互的matplotlib窗口
%matplotlib qt5 弹出matplotlib控制台
%matplotlib inline 直接嵌入图表,不需要使用plt.show()
保存图片
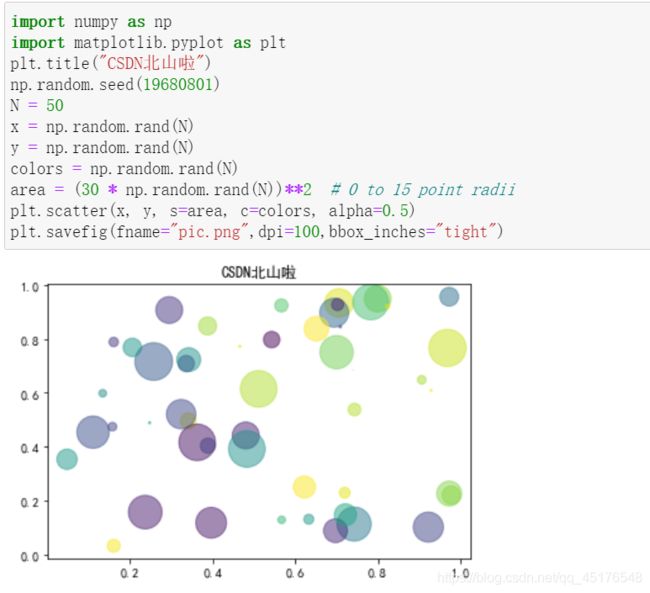
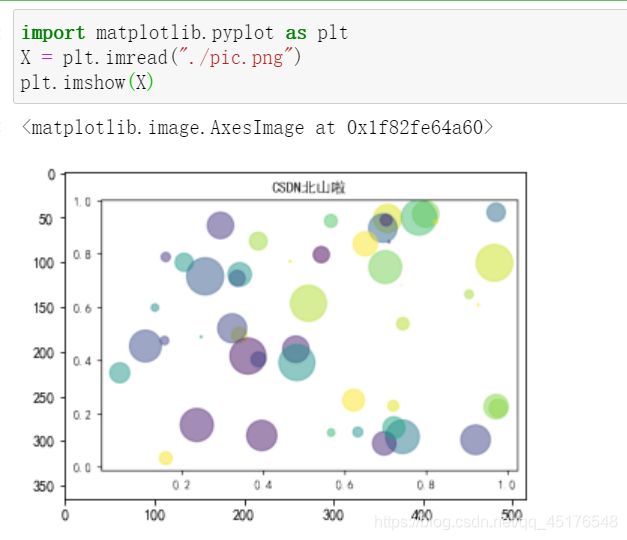
plt.savefig("pic.png",dpi=100,bbox_inches="tight")
读取图片
方法一
from PIL import Image
image = Image.open("./pic.png")
image.show()
方法二
import matplotlib.pyplot as plt
X = plt.imread("./pic.png")
plt.imshow(X)
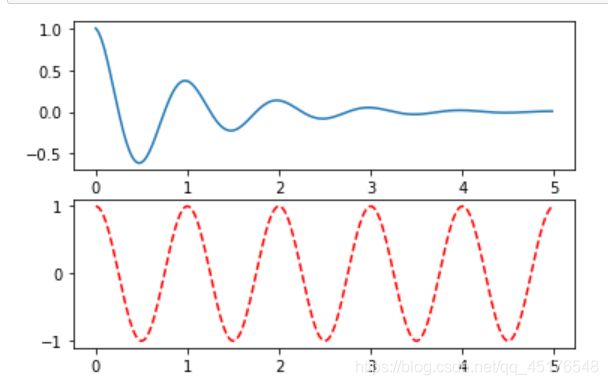
条形图
def f(t):
    return np.exp(-t) * np.cos(2*np.pi*t)
a = np.arange(0,5,0.02)

plt.subplot(211)
plt.plot(a,f(a))

plt.subplot(212)
plt.plot(a,np.cos(2*np.pi*a),'r--')

plt.show()
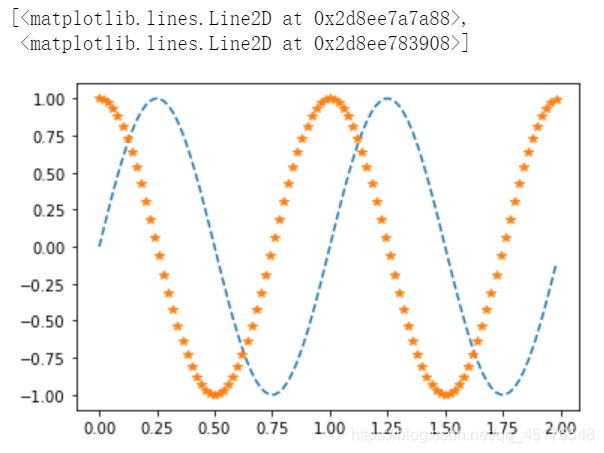
b = np.arange(0,2,0.02)
plt.plot(b,np.sin(2*np.pi*b),'--',b,np.cos(2*np.pi*b),"*")
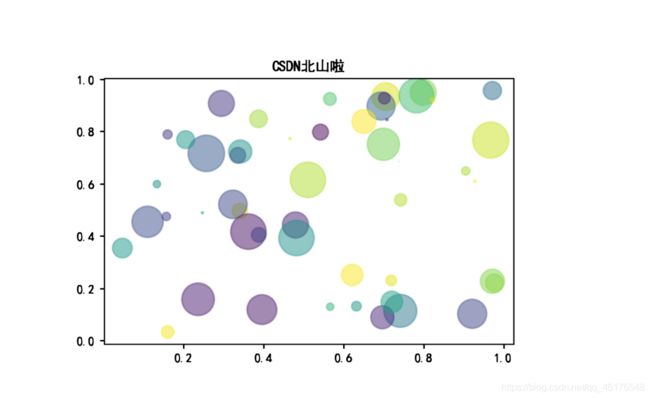
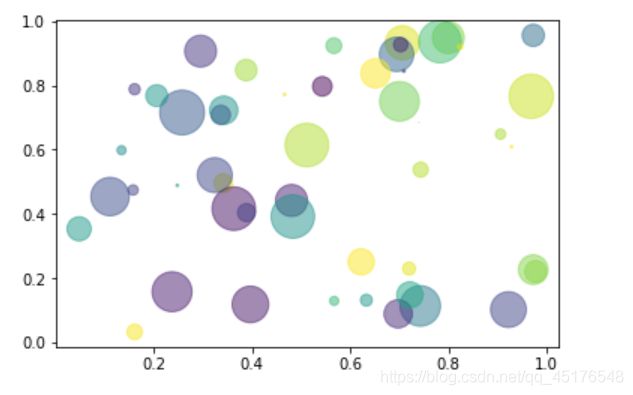
散点图
import numpy as np
import matplotlib.pyplot as plt

# Fixing random state for reproducibility
np.random.seed(19680801)


N = 50
x = np.random.rand(N)
y = np.random.rand(N)
colors = np.random.rand(N)
area = (30 * np.random.rand(N))**2  # 0 to 15 point radii

plt.scatter(x, y, s=area, c=colors, alpha=0.5)
plt.show()
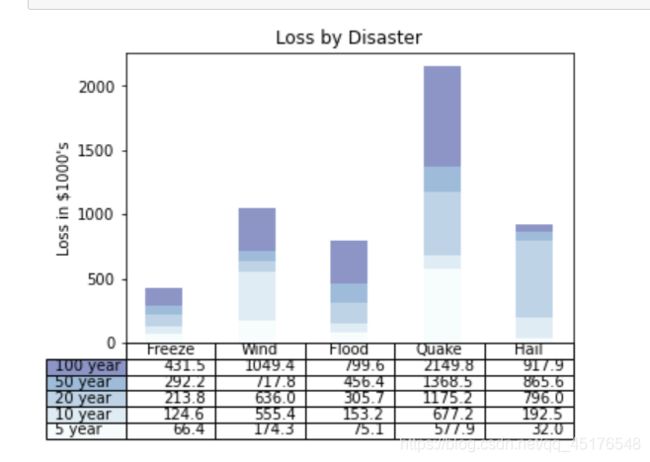
带表格的图形
import numpy as np
import matplotlib.pyplot as plt


data = [[ 66386, 174296,  75131, 577908,  32015],
        [ 58230, 381139,  78045,  99308, 160454],
        [ 89135,  80552, 152558, 497981, 603535],
        [ 78415,  81858, 150656, 193263,  69638],
        [139361, 331509, 343164, 781380,  52269]]

columns = ('Freeze', 'Wind', 'Flood', 'Quake', 'Hail')
rows = ['%d year' % x for x in (100, 50, 20, 10, 5)]

values = np.arange(0, 2500, 500)
value_increment = 1000

# Get some pastel shades for the colors
colors = plt.cm.BuPu(np.linspace(0, 0.5, len(rows)))
n_rows = len(data)

index = np.arange(len(columns)) + 0.3
bar_width = 0.4

# Initialize the vertical-offset for the stacked bar chart.
y_offset = np.zeros(len(columns))

# Plot bars and create text labels for the table
cell_text = []
for row in range(n_rows):
    plt.bar(index, data[row], bar_width, bottom=y_offset, color=colors[row])
    y_offset = y_offset + data[row]
    cell_text.append(['%1.1f' % (x / 1000.0) for x in y_offset])
# Reverse colors and text labels to display the last value at the top.
colors = colors[::-1]
cell_text.reverse()

# Add a table at the bottom of the axes
the_table = plt.table(cellText=cell_text,
                      rowLabels=rows,
                      rowColours=colors,
                      colLabels=columns,
                      loc='bottom')

# Adjust layout to make room for the table:
plt.subplots_adjust(left=0.2, bottom=0.2)

plt.ylabel("Loss in ${0}'s".format(value_increment))
plt.yticks(values * value_increment, ['%d' % val for val in values])
plt.xticks([])
plt.title('Loss by Disaster')

plt.show()
总结
到此这篇关于Python matplotlib实用绘图技巧的文章就介绍到这了,更多相关matplotlib绘图技巧内容请搜索脚本之家以前的文章或继续浏览下面的相关文章希望大家以后多多支持脚本之家!

