数据分析案例:多元线性回归预测房价(python实现)
数据:sklearn中的datasets的California——housing
方法:使用多元线性回归进行房价预测
知识点:matplotlib绘图,相关系数,数据标准化处理
##载入所需要的模块
from __future__ import print_function
import numpy as np
import pandas as pd


##matplotlib
import matplotlib
import matplotlib.pyplot as plt

##加载数据
from sklearn import datasets
housing_data=datasets.fetch_california_housing()
housing=pd.DataFrame(housing_data.data,columns=housing_data.feature_names)
target=pd.Series(housing_data.target)
housing.head()
target.head()
housing.info()
housing.describe()
运行结果:
如上图所示的是加利福尼亚房价数据中的8个特征值的describe信息
#用直方图描绘几个特征的分布信息
housing.hist(figsize=(20,15),bins=50,grid=False)#对每一个特征进行柱状图绘画,bins的意思是用50个分割,grid代表是否用网格划分
plt.show()
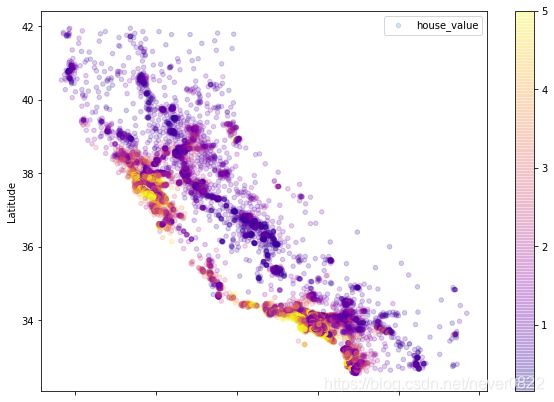
对于单个特征的直方图分析信息略显单薄,可以加上房价信息做一个散点图查看
#按照房价高低赋予颜色
housing.plot(kind='scatter',x='Longitude',y='Latitude',
             c=target,cmap=plt.get_cmap('plasma'),
             label='house_value',colorbar=True,
             alpha=0.2,figsize=(10,7))
#kind=scatter,表示散点图,c代表色图对象是target就是房价,cmap为了设置颜色,
#lablel就是标签,colorbar表示色块等级,alpha表示透明度
plt.show()接下来分析特征之间的相关性
#计算相关系数
corr_with_target=housing.corrwith(target)
corr_with_target
corr_with_target.sort_values(ascending=True).plot(kind='barh',figsize=(10,7))
#knid=barh,表示一个横轴的柱状图
#分析特征之间的相关系数
corr_matrix=housing.corr()
corr_matrix
corr_matrix['MedInc'].sort_values(ascending=True).plot(kind='barh',figsize=(10,7))
##
from pandas.plotting import scatter_matrix
attribs=['MedInc','AveRooms','Latitude']
scatter_matrix(housing[attribs],figsize=(20,15))
##数据的标准化处理
数据的标准化处理
##数据的标准化处理
from sklearn.preprocessing import MinMaxScaler
##将数据的特征缩放到{0,1},或者{-1,1}
minmax_scaler=MinMaxScaler()
minmax_scaler.fit(housing)
scale_housing=minmax_scaler.transform(housing)
scale_housing=pd.DataFrame(scale_housing,columns=housing.columns)
scale_housing.describe()
##使用标准话对数据进行处理,处理后的数据符合标准的正态分布
from sklearn.preprocessing import StandardScaler
std_scaler=StandardScaler()
std_scaler.fit(housing)
std_housing=std_scaler.transform(housing)
std_housing=pd.DataFrame(std_housing,columns=housing.columns)
std_housing.describe()
对数据进行回归分析
from sklearn.linear_model import LinearRegression
LR_reg = LinearRegression()
LR_reg.fit(std_housing,target)
##使用均方误差查看你和优劣性
from sklearn.metrics import mean_squared_error
preds=LR_reg.predict(std_housing)
mse = mean_squared_error(preds,target)
print('Prediction Loss',mse)
print('Prediction Loss',mse)
Prediction Loss 0.5243209861846072
用绘图对比一下预测结果:
plt.figure(figsize=(10,7))
num=100
x=np.arange(1,num+1)
plt.plot(x,target[:num],label='target')
plt.plot(x,preds[:num],label='prediction')
plt.legend(loc='upper right')
plt.show()


