pycharm(python3.7解释器)单变量线性回归
数据下载链接:
https://pan.baidu.com/s/1eHYQ6YHWXx8E-BZJk1qTFg
提取码:o87r
主程序:
import numpy as np
import pandas as pd
import matplotlib.pyplot as plt
import cost_function
import gd_function

path = "ex1data1.txt"
data = pd.read_csv(path, names=["Population", "Profit"])

print(data.head())
print(data.describe())
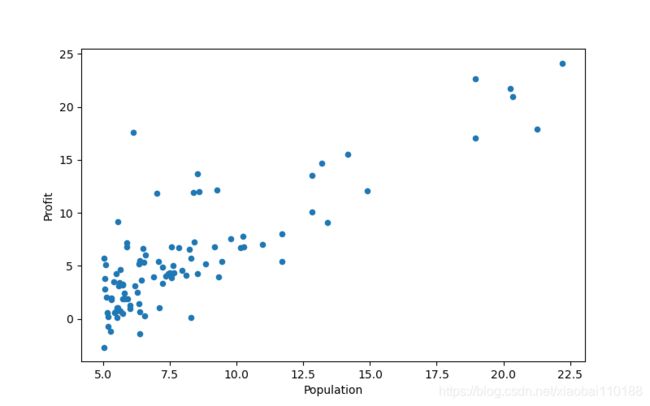
data.plot(kind="scatter", x="Population", y="Profit",  figsize=(8, 5))
print(plt.show())


data.insert(0, "Ones", 1)  # 在训练集中插入一列1,方便计算
# set X(training set), y(target variable)
# 设置训练集X,和目标变量y的值
cols = data.shape[1]  # 获取列数
x = data.iloc[:, 0:cols - 1]  # 输入向量X为前cols-1列
y = data.iloc[:, cols - 1:cols]  # 目标变量y为最后一列
x = np.array(x.values)
y = np.array(y.values)
theta = np.array([[0, 0]])
 print(theta.shape)
 print(x.shape)
 print(y.shape)

gd_function.gra_des(x, y, theta, 0.01, 1000)  # alpha = 0.01  epoch = 1000


final_theta, cost = gd_function.gra_des(x, y, theta, 0.01, 1000)
final_cost = cost_function.compute_cost(x, y, final_theta)
print(final_theta)
print(final_cost)


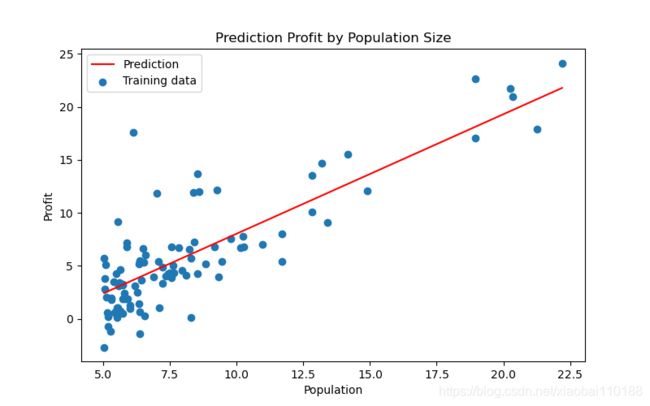
population = np.linspace(data.Population.min(), data.Population.max(), 97)
population.shape
population = np.linspace(data.Population.min(), data.Population.max(), 100)  # 横坐标
profit = final_theta[0, 0] + (final_theta[0, 1] * population)  # 纵坐标,利润

# 然后根据得出的参数theta,代入假设函数,绘制假设函数和训练数据的图像,直观的观测拟合程度
fig, ax = plt.subplots(figsize=(8, 5))
ax.plot(population, profit, "r", label="Prediction")
ax.scatter(data["Population"], data["Profit"], label="Training data")
ax.legend(loc=2)  # 4表示标签在右下角,2表示标签在左上角
ax.set_xlabel("Population")
ax.set_ylabel("Profit")
ax.set_title("Prediction Profit by Population Size")
plt.show()

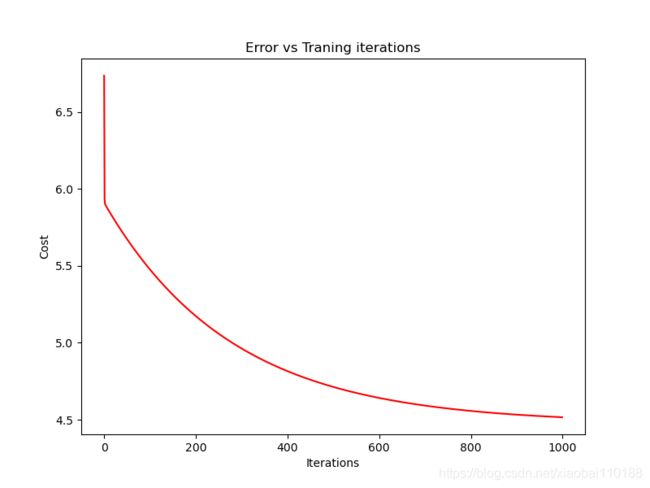
# 由于梯度下降过程中每一次迭代都会得到一个cost值,下面我们根据cost的值来绘制图像。
# 我们通常使用绘制cost图像的方式来观测梯度下降算法是否正常的运行,
# 若是算法运行正常,该图像会一直下降
fig, ax = plt.subplots(figsize=(8, 6))
ax.plot(np.arange(0, 1000,), cost, "r")
ax.set_xlabel("Iterations")
ax.set_ylabel("Cost")
ax.set_title("Error vs Traning iterations")
plt.show()
由于 cost_function和 gd_function与主程序不在同一文件中,所以主程序中需要导入这两个函数文件名,下面是这两个函数代码
cost_function
import numpy as np


def compute_cost(x, y, theta):
    inner = np.power(x.dot(theta.T) - y, 2)  # 后面的2表示2次幂
    return sum(inner) / (2 * len(x))
gd_function
import numpy as np
import cost_function


def gra_des(x, y, theta, alpha, epoch):
    temp1 = np.zeros(theta.shape)  # 初始化一个theta临时矩阵
    cost = np.zeros(epoch)  # 初始化一个array,包含每次迭代后的cost
    m = x.shape[0]  # 样本数量m

    for i in range(epoch):
        # 利用向量化同步计算theta值
        # 注意theta是一个行向量
        temp1 = theta - (alpha / m) * (x.dot(theta.T) - y).T.dot(x)  # 得出一个theta行向量
        theta = temp1
        cost[i] = cost_function.compute_cost(x, y, theta)  # 这个函数中,theta是变量,X,y是已知量
    return theta, cost  # 迭代结束之后返回theta和cost值
输出展示:
print(data.head()):
Population Profit
0 6.1101 17.5920
1 5.5277 9.1302
2 8.5186 13.6620
3 7.0032 11.8540
4 5.8598 6.8233
print(data.describe()):
Population Profit
count 97.000000 97.000000
mean 8.159800 5.839135
std 3.869884 5.510262
min 5.026900 -2.680700
25% 5.707700 1.986900
50% 6.589400 4.562300
75% 8.578100 7.046700
max 22.203000 24.147000
print(plt.show()):

print(theta.shape):
(1, 2)
print(x.shape):
(97, 2)
print(y.shape):
(97, 1)
print(final_theta):
[[-3.24140214 1.1272942 ]]
print(final_cost):
[4.5159555]
本人不才,如有错误欢迎指正。

