R Studio&R语言入门,词云demo
R Studio&R语言入门,词云demo
- 写在前面
-
- 工作路径
-
- 设置工作路径
- 安装包
-
- 下载安装包
- 载入安装包
- 读取数据
- 分词
- 计算词频并排序
- 词云
写在前面
复习2021.5.10教育信息处理课程的实验讲解
这里吹爆某位博士后的小姐姐!!我永远爱学姐讲课~
工作路径
在前一天晚上刚下载和安装r的时候遇到的困难啦,这里的路径和html有些异曲同工之处
使用shiny创建app时,打开app会涉及到runApp(“路径”)这个函数,今天老师也说了
设置工作路径
#设置工作路径
setwd("F:/text_analysis")
#或者
setwd("F:\\text_analysis")
#查看路径
getwd()
#查看安装包下载路径
.libPaths()
其他更改路径可以查看其他博文啦~
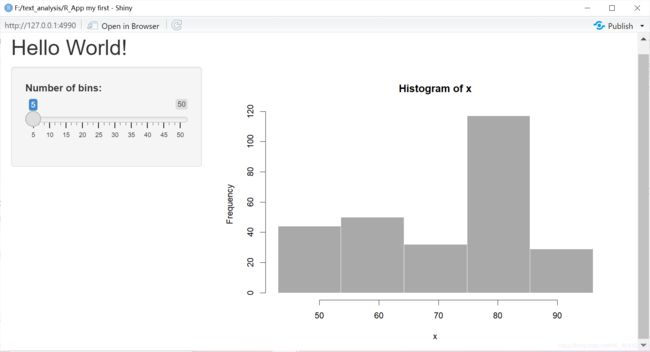
查看路径之后如果你觉得这条路径可以就可以在该目录下面设置文件夹进行你的实验啦!附上昨晚学习的shiny_app的两个代码,具体shiny_app学习可以查看R语言核心技能:交互式展示Shiny
在工作路径中新建一个文件夹命名为My_first_shiny_App
在该文件夹下面建立两个.R文件,代码在下面:
ui.R:
library(shiny)

# Define UI for application that draws a histogram
shinyUI(fluidPage(

  # Application title
  titlePanel("Hello Shiny!"),

  # Sidebar with a slider input for the number of bins
  sidebarLayout(
    sidebarPanel(
      sliderInput("bins",
                  "Number of bins:",
                  min = 1,
                  max = 50,
                  value = 30)
    ),

    # Show a plot of the generated distribution
    mainPanel(
      plotOutput("distPlot")
    )
  )
))
server.R
library(shiny)

# Define server logic required to draw a histogram
shinyServer(function(input, output) {


  # Expression that generates a histogram. The expression is
  # wrapped in a call to renderPlot to indicate that:
  #
  #  1) It is "reactive" and therefore should re-execute automatically
  #     when inputs change
  #  2) Its output type is a plot

  output$distPlot <- renderPlot({

    x    <- faithful[, 2]  # Old Faithful Geyser data
    bins <- seq(min(x), max(x), length.out = input$bins + 1)

    # draw the histogram with the specified number of bins
    hist(x, breaks = bins, col = 'darkgray', border = 'white')
  })
})
运行app:
> library(shiny)
> runApp("my_app")
下面进入正题~
安装包
下载安装包
安装安装包
上面的代码运行需要有shiny包,本篇文章最终将展示词云的生成,如图:

我们需要以下安装包
#安装包
install.packages(c("tm",'cntm','Rwordseg','jiebaR','jiebaRD','wordcloud2'))
或者用以下方法安装安装包
install.packages("tm")
install.packages("tmcn")
#...这样单个单个安装
以上install方法在R和R Studio中都可以使用,在R中需要选择镜像,选择国内的或者默认的即可~
还可以在这里直接找到需要的安装包install

载入安装包
#载入安装包
library(tm)
library(tmcn)
library(Rwordseg)
library(jiebaR)
library(jiebaRD)
library(wordcloud2)
读取数据
###读取数据###
#以下<-可换为等号,UTF-8是万国码
#路径打开
text_2102 <- readLines('F:/text_analysis/files/2011_教育信息化工作月报 .txt',encoding='UTF-8')
#或者双斜杠
text_2102 <- readLines('F:\\text_analysis\\files\\2011_教育信息化工作月报 .txt',encoding='UTF-8')
#直接打开工作路径中的文件
text_2102 <- readLines('2102_教育信息化工作月报.txt',encoding='UTF-8')
#从当前目录直接打开
text_2102 <- readLines('./files/2102_教育信息化工作月报.txt',encoding='UTF-8')
#显示文档
text_2102
#单行查看
text_2102[11]
#查看连续多行
text_2102[1:5]
#查看非连续多行
text_2102[c(1:3,7,9)]
分词
###分词###
#stop_work='hit_stopwors.txt'
library(jiebaRD)
engine=worker(type='mix')
text_2102_seg2=segment(text_2102,jiebar=engine)
#或者直接text_2102_seg2=segment(text_2102,engine),因为第二个参数默认为jiebar
#可以在下方输入help segment这种方式查看每种函数
计算词频并排序
###计算词频并排序###
# 计算词频table(text_2102_seg2)
# 转置t(table(text_2102_seg2))
# 转换成数据框格式 as.data.frame()
as.data.frame(t(table(text_2102_seg2)))
#排序
freq_order=freq[4,3] #取第三行第四列,空着表示全选
View(freq_order)#查看
freq_order <- freq[order(freq$Freq,decreasing=TRUE),-1]#降序排列,除去第一列
#这里TRUE也可以转换为T
freq_order=freq[order(freq$Freq),-1]#默认是升序
词云
###词云###
library(wordcloud2)
wordcloud2(freq_order)
#也可以改变大小和形状
wordcloud2(freq_order,size=1,shape='star')

tips:pg up键可以重复刚刚执行的单条语句
完整代码:
#设置工作路径
setwd("F:/text_analysis")
setwd("F:\\text_analysis")
getwd()
.libPaths()
library(tm)
library(tmcn)
library(Rwordseg)
library(jiebaR)
library(jiebaRD)
library(wordcloud2)

text_2102 <- readLines('./files/2102_教育信息化工作月报.txt',encoding='UTF-8')
text_2102
text_2102[11]
text_2102[1:5]
text_2102[c(1:3,7,9)]

engine=worker(type='mix')
text_2102_seg=segment(text_2102,jiebar=engine)

text_2102
text_2102_seg
as.data.frame(t(table(text_2102_seg)))
freq_order <- freq[order(freq$Freq,decresing=T),-1]

View(freq_order)

wordcloud2(freq_order,size=0.5,shape='star')
最近作业好多哭一哭TAT


