导入可能用到的Python库
import pandas as pd
import matplotlib.pyplot as plt
import numpy as np
import re
目标
- 学习机器学习算法——线性分类器
- 使用良性/恶性乳腺癌肿瘤数据集进行预测
理论学习
线性分类器
特征与分类结果存在线性关系的模型为线性分类器,模型通过累积特征和对应权值的方式决策,几何学上可看成一个n维空间中的超平面,学习的过程就是不断调整超平面的位置与倾斜程度,使该超平面可以最完美的将属于不同类别的特征点区分开,公式为:$$f(w,x,b) = w^{T}x+b$$
logistic 函数
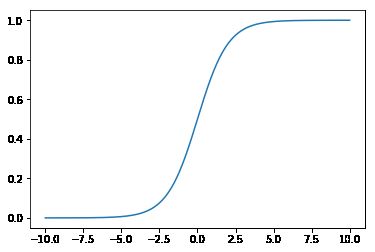
线性分类器输出的是一个数,我们希望这个数在区间[0,1]之间,需要一个映射关系,这个映射关系就是logistic函数$$g(x) = \cfrac{1}{1 + e^{-x}}$$下面使用numpy和matplot绘制该函数的图像
x = np.linspace(start=-10,stop=10,num=1000)
y = 1 / (1 + np.exp(-x))
plt.plot(x,y)
plt.show()
将线性分类器公式带入logistics函数后,可得logistics回归模型$$f(x,w,b) = \cfrac{1}{1 + e{-(w{T}x+b)}}$$
优化
完成了模型的构建之后,需要对算法进行优化已确定最优的W和b参数。这时,需要一个函数用于评价现有参数的质量,这个函数应该满足以下条件
- 连续可导(用于基于梯度的优化算法需要连续可导)
- 当预测结果越正确时,函数取值越大;预测结果越错误时,函数取值越小(反过来也可)
对于一个logistics的线性分类器,可以将输出看做取1值的概率,那么,该分类器可以视为一个条件概率$P(y|x)$,其中w与b是分布的参数,于是我们使用最大似然估计的方法确定这个评价函数(其中y是期望输出,即正确值)$$l(w,b) = \prod ((f(w,b,x))^{y}*(1 - f(w,b,x))^{1 - y})$$
- 是否连续可导:是
- 当y = 0时,$l(w,b) = 1 - f(w,b,x)$,预测值越接近0,取值越大;y=1时同理
于是我们只要对$l(w,b)$进行优化,通过梯度优化的方法找到最好的w,b参数即可
代码实现
导入数据——良性/恶性乳腺癌肿瘤数据集
数据下载
data_url = "https://archive.ics.uci.edu/ml/machine-learning-databases/breast-cancer-wisconsin/breast-cancer-wisconsin.data"
data_label = """ 1. Sample code number            1id number
   2. Clump Thickness               1 - 10
   3. Uniformity of Cell Size       1 - 10
   4. Uniformity of Cell Shape      1 - 10
   5. Marginal Adhesion             1 - 10
   6. Single Epithelial Cell Size   1 - 10
   7. Bare Nuclei                   1 - 10
   8. Bland Chromatin               1 - 10
   9. Normal Nucleoli               1 - 10
  10. Mitoses                       1 - 10
  11. Class                         2 for benign, 4 for malignant)
"""
data_label = [re.sub(r"\s+\d","",x[2:]) for x in re.findall(r"\. [\w\s]+\d",data_label)]
print(data_label)
data = pd.read_csv(data_url,names=data_label)
print(data[:5],data.shape)
['Sample code numberid number', 'Clump Thickness', 'Uniformity of Cell Size', 'Uniformity of Cell Shape', 'Marginal Adhesion', 'Single Epithelial Cell Size', 'Bare Nuclei', 'Bland Chromatin', 'Normal Nucleoli', 'Mitoses', 'Class']
   Sample code numberid number  Clump Thickness  Uniformity of Cell Size  \
0                      1000025                5                        1
1                      1002945                5                        4
2                      1015425                3                        1
3                      1016277                6                        8
4                      1017023                4                        1

   Uniformity of Cell Shape  Marginal Adhesion  Single Epithelial Cell Size  \
0                         1                  1                            2
1                         4                  5                            7
2                         1                  1                            2
3                         8                  1                            3
4                         1                  3                            2

  Bare Nuclei  Bland Chromatin  Normal Nucleoli  Mitoses  Class
0           1                3                1        1      2
1          10                3                2        1      2
2           2                3                1        1      2
3           4                3                7        1      2
4           1                3                1        1      2   (699, 11)
清洗数据(去除有缺失的数据)
data = data.replace(to_replace="?",value=np.nan)
data = data.dropna(how='any')
print(data.shape)
(683, 11)
切分数据集(75%训练-25%测试)
from sklearn.cross_validation import train_test_split
x_train,x_test,y_train,y_test = train_test_split(data[data_label[:10]],data[data_label[10]],test_size=0.25,random_state=1)
print(x_train.shape,x_test.shape)
print(y_train.shape,y_test.shape)
(512, 10) (171, 10)
(512,) (171,)
sklearn.cross_validation中的train_test_split()函数用于切分数据集,输入参数为:
- 数据
- 标签
- test_size:0~1之间,表示测试集占总数据的比例
- random_state:随机种子
数据标准化
from sklearn.preprocessing import StandardScaler
ss = StandardScaler()
x_train_norm = ss.fit_transform(x_train)
x_test_norm = ss.transform(x_test)
-
StandardScaler的fit_transform()函数,先计算均值与方差再标准化 -
StandardScaler的transform()函数,使用fit_transform()计算出的均值方差标准化
模型建立与训练
模型建立
logistics分类器
from sklearn.linear_model import LogisticRegression
lr = LogisticRegression()
SGD分类器
from sklearn.linear_model import SGDClassifier
sgdc = SGDClassifier()
c:\users\qiank\appdata\local\programs\python\python35\lib\site-packages\sklearn\linear_model\stochastic_gradient.py:84: FutureWarning: max_iter and tol parameters have been added in  in 0.19. If both are left unset, they default to max_iter=5 and tol=None. If tol is not None, max_iter defaults to max_iter=1000. From 0.21, default max_iter will be 1000, and default tol will be 1e-3.
  "and default tol will be 1e-3." % type(self), FutureWarning)
训练模型
logistics分类器
lr.fit(x_train_norm,y_train)
LogisticRegression(C=1.0, class_weight=None, dual=False, fit_intercept=True,
          intercept_scaling=1, max_iter=100, multi_class='ovr', n_jobs=1,
          penalty='l2', random_state=None, solver='liblinear', tol=0.0001,
          verbose=0, warm_start=False)
SGD分类器
sgdc.fit(x_train_norm,y_train)
SGDClassifier(alpha=0.0001, average=False, class_weight=None, epsilon=0.1,
       eta0=0.0, fit_intercept=True, l1_ratio=0.15,
       learning_rate='optimal', loss='hinge', max_iter=5, n_iter=None,
       n_jobs=1, penalty='l2', power_t=0.5, random_state=None,
       shuffle=True, tol=None, verbose=0, warm_start=False)
模型测试
from sklearn.metrics import
logistics分类器
print(lr.score(x_test_norm,y_test))
y_result = lr.predict(x_test_norm)
print(classification_report(y_test,y_result,target_names=['Benign','Malignant']))
0.988304093567
             precision    recall  f1-score   support

     Benign       0.98      1.00      0.99       111
  Malignant       1.00      0.97      0.98        60

avg / total       0.99      0.99      0.99       171
SGD分类器
print(sgdc.score(x_test_norm,y_test))
y_result = sgdc.predict(x_test_norm)
print(classification_report(y_test,y_result,target_names=['Benign','Malignant']))
0.970760233918
             precision    recall  f1-score   support

     Benign       0.96      1.00      0.98       111
  Malignant       1.00      0.92      0.96        60

avg / total       0.97      0.97      0.97       171
-
classification_report()用于测试准确率,精确率和召回率 -
.score()用于评估本模型的准确率
