【集成学习(下)】Task 12 Blending学习笔记
1. 导言
在前几个章节中,我们学习了关于回归和分类的算法,同时也讨论了如何将这些方法集成为强大的算法的集成学习方式,分别是Bagging和Boosting。本章我们继续讨论集成学习方法的最后一个成员–Stacking,这个集成方法在比赛中被称为“懒人”算法,因为它不需要花费过多时间的调参就可以得到一个效果不错的算法,同时,这种算法也比前两种算法容易理解的多,因为这种集成学习的方式不需要理解太多的理论,只需要在实际中加以运用即可。 stacking严格来说并不是一种算法,而是精美而又复杂的,对模型集成的一种策略。Stacking集成算法可以理解为一个两层的集成,第一层含有多个基础分类器,把预测的结果(元特征)提供给第二层, 而第二层的分类器通常是逻辑回归,他把一层分类器的结果当做特征做拟合输出预测结果。在介绍Stacking之前,我们先来对简化版的Stacking进行讨论,也叫做Blending,接着我们对Stacking进行更深入的讨论。
2. Blending集成学习算法
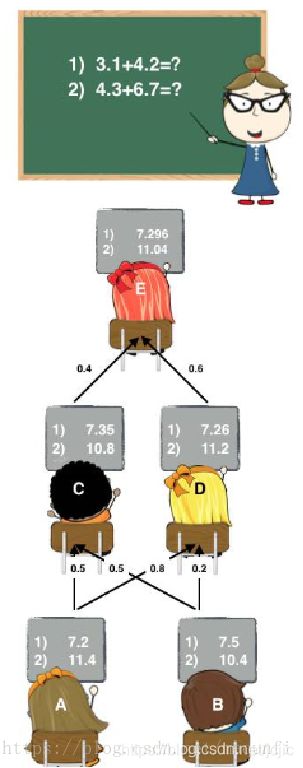
不知道大家小时候有没有过这种经历:老师上课提问到你,那时候你因为开小差而无法立刻得知问题的答案。就在你彷徨的时候,由于你平时人缘比较好,因此周围的同学向你伸出援手告诉了你他们脑中的正确答案,因此你对他们的答案加以总结和分析最终的得出正确答案。相信大家都有过这样的经历,说这个故事的目的是为了引出集成学习家族中的Blending方式,这种集成方式跟我们的故事是十分相像的。 如图:(图片来源:https://blog.csdn.net/maqunfi/article/details/82220115)
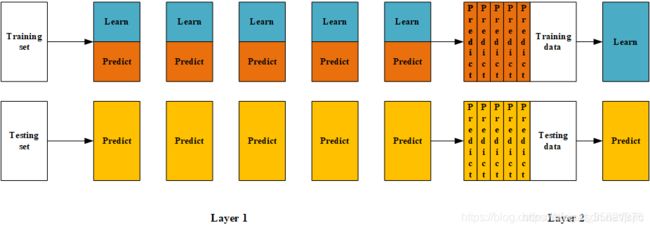
下面我们来详细讨论下这个Blending集成学习方式:
- (1) 将数据划分为训练集和测试集(test_set),其中训练集需要再次划分为训练集(train_set)和验证集(val_set);
- (2) 创建第一层的多个模型,这些模型可以使同质的也可以是异质的;
- (3) 使用train_set训练步骤2中的多个模型,然后用训练好的模型预测val_set和test_set得到val_predict, test_predict1;
- (4) 创建第二层的模型,使用val_predict作为训练集训练第二层的模型;
- (5) 使用第二层训练好的模型对第二层测试集test_predict1进行预测,该结果为整个测试集的结果。
(图片来源:https://blog.csdn.net/sinat_35821976/article/details/83622594)
在这里,大佬们来梳理下这个过程:
在(1)步中,总的数据集被分成训练集和测试集,如80%训练集和20%测试集,然后在这80%的训练集中再拆分训练集70%和验证集30%,因此拆分后的数据集由三部分组成:训练集80%* 70%
、测试集20%、验证集80%* 30% 。训练集是为了训练模型,验证集是为了调整模型(调参),测试集则是为了检验模型的优度。
在(2)-(3)步中,我们使用训练集创建了K个模型,如SVM、random forests、XGBoost等,这个是第一层的模型。 训练好模型后将验证集输入模型进行预测,得到K组不同的输出,我们记作 A 1 , . . . , A K A_1,...,A_K A1,...,AK,然后将测试集输入K个模型也得到K组输出,我们记作 B 1 , . . . , B K B_1,...,B_K B1,...,BK,其中 A i A_i Ai的样本数与验证集一致, B i B_i Bi的样本数与测试集一致。如果总的样本数有10000个样本,那么使用5600个样本训练了K个模型,输入验证集2400个样本得到K组2400个样本的结果 A 1 , . . . , A K A_1,...,A_K A1,...,AK,输入测试集2000个得到K组2000个样本的结果 B 1 , . . . , B K B_1,...,B_K B1,...,BK 。
在(4)步中,我们使用K组2400个样本的验证集结果 A 1 , . . . , A K A_1,...,A_K A1,...,AK作为第二层分类器的特征,验证集的2400个标签为因变量,训练第二层分类器,得到2400个样本的输出。
在(5)步中,将输入测试集2000个得到K组2000个样本的结果 B 1 , . . . , B K B_1,...,B_K B1,...,BK放入第二层分类器,得到2000个测试集的预测结果。
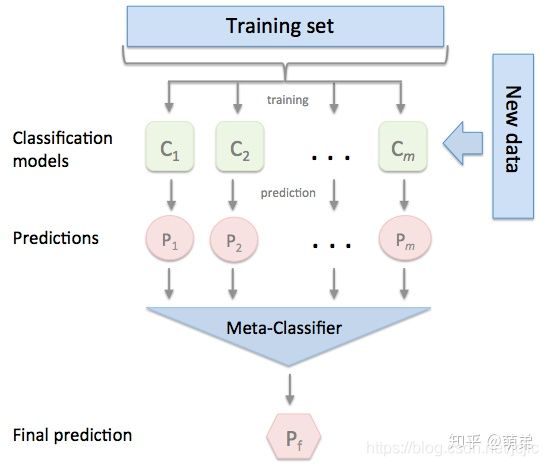
以上是Blending集成方式的过程,接下来我们来分析这个集成方式的优劣:
其中一个最重要的优点就是实现简单粗暴,没有太多的理论的分析。但是这个方法的缺点也是显然的:blending只使用了一部分数据集作为留出集进行验证,也就是只能用上数据中的一部分,实际上这对数据来说是很奢侈浪费的。
关于这个缺点,我们以后再做改进,我们先来用一些案例来使用这个集成方式。
# 加载相关工具包
import numpy as np
import pandas as pd
import matplotlib.pyplot as plt
plt.style.use("ggplot")
%matplotlib inline
import seaborn as sns
# 创建数据
from sklearn import datasets
from sklearn.datasets import make_blobs
from sklearn.model_selection import train_test_split
data, target = make_blobs(n_samples=10000, centers=2, random_state=1, cluster_std=1.0 )
## 创建训练集和测试集
X_train1,X_test,y_train1,y_test = train_test_split(data, target, test_size=0.2, random_state=1)
## 创建训练集和验证集
X_train,X_val,y_train,y_val = train_test_split(X_train1, y_train1, test_size=0.3, random_state=1)
print("The shape of training X:",X_train.shape)
print("The shape of training y:",y_train.shape)
print("The shape of test X:",X_test.shape)
print("The shape of test y:",y_test.shape)
print("The shape of validation X:",X_val.shape)
print("The shape of validation y:",y_val.shape)
The shape of training X: (5600, 2)
The shape of training y: (5600,)
The shape of test X: (2000, 2)
The shape of test y: (2000,)
The shape of validation X: (2400, 2)
The shape of validation y: (2400,)
#  设置第一层分类器
from sklearn.svm import SVC
from sklearn.ensemble import RandomForestClassifier
from sklearn.neighbors import KNeighborsClassifier
            # 将输出结果输出概率                                                  划分节点是基尼系数
clfs = [SVC(probability = True),RandomForestClassifier(n_estimators=5, n_jobs=-1, criterion='gini'),KNeighborsClassifier()]

# 设置第二层分类器
from sklearn.linear_model import LinearRegression
lr = LinearRegression()
# 输出第一层的验证集结果与测试集结果
val_features = np.zeros((X_val.shape[0],len(clfs)))  # 初始化验证集结果
test_features = np.zeros((X_test.shape[0],len(clfs)))  # 初始化测试集结果

for i,clf in enumerate(clfs):
    clf.fit(X_train,y_train)
    val_feature = clf.predict_proba(X_val)[:, 1]
    test_feature = clf.predict_proba(X_test)[:,1]
    val_features[:,i] = val_feature
    test_features[:,i] = test_feature
    print(val_feature)
[2.03768927e-04 5.14759728e-04 9.99999841e-01 ... 9.99999888e-01
 9.99999390e-01 9.99999861e-01]
[0. 0. 1. ... 1. 1. 1.]
[0. 0. 1. ... 1. 1. 1.]
val_features
array([[2.03768927e-04, 0.00000000e+00, 0.00000000e+00],
       [5.14759728e-04, 0.00000000e+00, 0.00000000e+00],
       [9.99999841e-01, 1.00000000e+00, 1.00000000e+00],
       ...,
       [9.99999888e-01, 1.00000000e+00, 1.00000000e+00],
       [9.99999390e-01, 1.00000000e+00, 1.00000000e+00],
       [9.99999861e-01, 1.00000000e+00, 1.00000000e+00]])
len(test_features)
2000
# 将第一层的验证集的结果输入第二层训练第二层分类器
lr.fit(val_features,y_val)
# 输出预测的结果
from sklearn.model_selection import cross_val_score
cross_val_score(lr,test_features,y_test,cv=5)
array([1., 1., 1., 1., 1.])
可以看到,在每一折的交叉验证的效果都是非常好的,这个集成学习方法在这个数据集上是十分有效的,不过这个数据集是我们虚拟的,因此大家可以把他用在实际数据上看看效果。
小总结
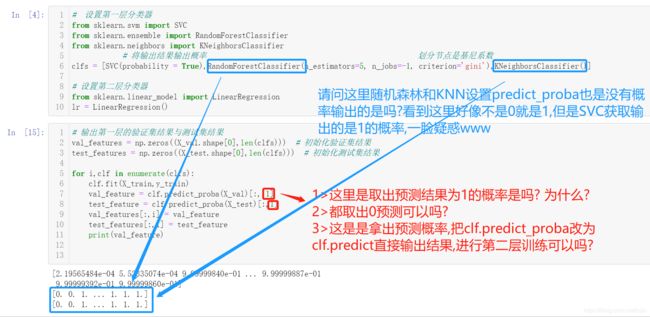
1> predict_proba是预测概率的,这里是二分类问题,预测的是0,1的概率,结果是一个概率矩阵,这是取出预测结果为1的概率,其实也没有为什么,就是有点像集成策略里面的硬投票而已
2> 也可以取出0的概率来预测
3 > predict_proba 是预测概率的,predict是预测类别结果,有点像硬投票,举例
模型预测
0的概率是0.1,
1的概率是0.9,
那么predict_proba 输出的就是[0.1,0.9]
predict输出的就是1
随机森林,KNN,predict_proba这里输出的是概率,都是0或1这里,应该预测的概率就是这样,下面作业的鸢尾花预测概率虽然大部分是0或1,但是还是有类似0.2的出现
作业:
我们刚刚的例子是针对人造数据集,表现可能会比较好一点,
因为我们使用Blending方式对iris数据集进行预测,并用第四章的决策边界画出来,找找规律。
import numpy as  np
import matplotlib.pyplot as plt
plt.style.use("ggplot")
%matplotlib inline
import seaborn as sns

from sklearn import datasets
from sklearn.model_selection import train_test_split
import warnings
warnings.filterwarnings("ignore")
# 导入鸢尾花数据集
iris = datasets.load_iris()
data = iris.data
target = iris.target
# 创建训练集和测试集
X_train1,X_test,y_train1,y_test = train_test_split(data,target,test_size = 0.2,random_state = 2021)
# 创建训练集和验证集
X_train,X_val,y_train,y_val = train_test_split(X_train1,y_train1,test_size = 0.3,random_state = 2021)
print("The shape of training X:",X_train.shape)
print("The shape of training y:",y_train.shape)
print("The shape of test X:",X_test.shape)
print("The shape of test y:",y_test.shape)
print("The shape of validation X:",X_val.shape)
print("The shape of validation y:",y_val.shape)
The shape of training X: (84, 4)
The shape of training y: (84,)
The shape of test X: (30, 4)
The shape of test y: (30,)
The shape of validation X: (36, 4)
The shape of validation y: (36,)
#  设置第一层分类器
from sklearn.svm import SVC
from sklearn.ensemble import RandomForestClassifier
from sklearn.neighbors import KNeighborsClassifier
            # 将输出结果输出概率                                                  划分节点是基尼系数
clfs = [SVC(probability = True),RandomForestClassifier(n_estimators=5, n_jobs=-1, criterion='gini'),KNeighborsClassifier()]

# 设置第二层分类器
from sklearn.linear_model import LinearRegression
lr = LinearRegression()
# 输出第一层的验证集结果与测试集结果
val_features = np.zeros((X_val.shape[0],len(clfs)))  # 初始化验证集结果
test_features = np.zeros((X_test.shape[0],len(clfs)))  # 初始化测试集结果

for i,clf in enumerate(clfs):
    clf.fit(X_train,y_train)
    val_feature = clf.predict_proba(X_val)[:, 1]
    test_feature = clf.predict_proba(X_test)[:,1]
    val_features[:,i] = val_feature
    test_features[:,i] = test_feature
    print(val_feature)
[0.00493364 0.83773677 0.04197246 0.27763374 0.94622907 0.00439715
 0.95711089 0.03135599 0.05062256 0.0354973  0.03128457 0.95089986
 0.06723653 0.71473882 0.02139152 0.00629482 0.95373221 0.03370935
 0.03114566 0.02598184 0.13446994 0.80883523 0.04162672 0.0334936
 0.92910467 0.04939443 0.77074718 0.03357751 0.01916813 0.00806051
 0.74661525 0.00519089 0.41896984 0.02434585 0.03614896 0.00392579]
[0.  1.  0.  0.  1.  0.  1.  0.  0.  0.  0.  1.  0.  1.  0.2 0.  1.  0.
 0.  0.  0.  1.  0.  0.  0.8 0.  1.  0.  0.  0.  1.  0.  1.  0.  0.  0. ]
[0.  1.  0.  0.6 1.  0.  1.  0.  0.  0.  0.  1.  0.  1.  0.  0.  1.  0.
 0.  0.  0.2 1.  0.  0.  1.  0.  0.8 0.  0.  0.  0.8 0.  0.4 0.  0.  0. ]
# 将第一层的验证集的结果输入第二层训练第二层分类器
lr.fit(val_features,y_val)
# 输出预测的结果
from sklearn.model_selection import cross_val_score
from sklearn.model_selection import cross_validate
cross_validate(lr,test_features,y_test,cv=5,scoring='accuracy')
{'fit_time': array([0.00099993, 0.0010004 , 0.00100231, 0.        , 0.00099921]),
 'score_time': array([0.00100064, 0.0009985 , 0.        , 0.00099945, 0.00100064]),
 'test_score': array([nan, nan, nan, nan, nan])}
小总结
这是cross_val_score(lr,test_features,y_test,cv=5,scoring=‘accuracy’)预测不知道为什么输出的是控制,用cross_validate(lr,test_features,y_test,cv=5,scoring=‘accuracy’)有结果输出,猜测是交叉验证这里Blending好像将数据划分了两次吧
cross_val_score的 scoring参数值解析
画图边界
参考
# 画出单层决策树与Adaboost的决策边界
x_min = X_train[:,0].min() - 1   # 10.03
x_max = X_train[:,0].max() + 1   # 15.34
y_min = X_train[:,1].min() - 1   # 0.27
y_max = X_train[:,1].max() + 1   # 4.68
xx,yy = np.meshgrid(np.arange(x_min,x_max,0.1),np.arange(y_min,y_max,0.1))  # 相当于在弄了很多点(x,y)出来
f,axarr = plt.subplots(nrows=1,ncols=2,sharex='col',sharey='row',figsize = (12,6))
for idx,clf,tt in zip([0,1],[tree,ada],['Decision tree','Adaboost']):
    clf.fit(X_train,y_train)
    Z = clf.predict(np.c_[xx.ravel(),yy.ravel()])
    Z = Z.reshape(xx.shape)        # 	alpha 介于0(透明)和1(不透明)之间。
    axarr[idx].contourf(xx, yy, Z, alpha=0.38)
    axarr[idx].scatter(X_train[y_train==0,0],X_train[y_train==0,1],c='blue',marker='^')
    axarr[idx].scatter(X_train[y_train==1,0],X_train[y_train==1,1],c='red',marker='o')
    axarr[idx].set_title(tt)
axarr[0].set_ylabel('Alcohol',fontsize=12)
plt.tight_layout()
plt.text(0,-0.2,s='0D280/0D315 of diluted wines',ha='center',va='center',fontsize=12,transform=axarr[1].transAxes)
plt.show()
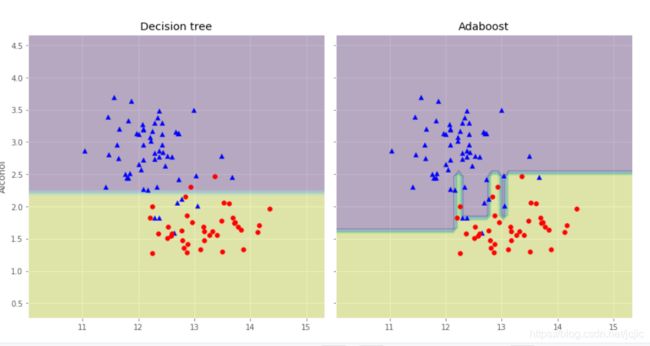
有点没研究出东西,先留个坑,考完试来看看或到时参考参考大佬们的
参考:
- Datawhale GitHub开源
