读取考勤数据
import pandas as pd
myKq = pd.read_excel("kq.xlsx")
myKq[u'打卡日期'].values
array([u'2017-12-29 17:33:26', u'2017-12-29 17:31:54',
       u'2017-12-29 17:28:55', ..., u'2017-01-03 17:05:55',
       u'2017-01-03 12:32:11', u'2017-01-03 10:24:25'], dtype=object)
import numpy as np
#myKq.insert(1,'city',myKq['address']) #先复制原来的列
daytime = myKq[u'打卡日期'].map(lambda x:x.split(' ')) #分别处理新旧两列
day, time = [],[]
for d in daytime:
    day.append(d[0])
    time.append(d[1])
myKq['day'] = day
myKq['time'] = time
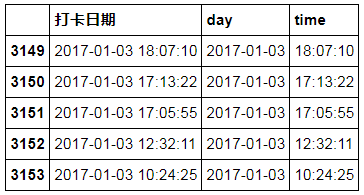
myKq.tail()
import matplotlib.pyplot as plt
from datetime import datetime
from matplotlib.font_manager import FontProperties
font = FontProperties(fname=r"C:\\WINDOWS\\Fonts\\simsun.ttc", size=14)

def getMin(arrtime):
    a = (arrtime).split(":")
    return (float(a[0])-9)*60+float(a[1])
plt.figure()
def getMax(arrtime):
    a = (arrtime).split(":")
    return (float(a[0])-18)*60+float(a[1])

df = myKq["time"].groupby(myKq['day'])

night = df.max().map(lambda x:getMax(x))
morning = df.min().map(lambda x:getMin(x))
colors = np.array(['g']*morning.size)
dic_c_l = {'g':'work day', 'r':'friday', 'b':'weekend'}
for index, day in enumerate(morning.index):
    week = datetime.strptime(day, '%Y-%m-%d').weekday()
    if (week+1 == 5):
        colors[index] = 'r'
    elif (week+1==6 or week+1==7):
        colors[index] = 'b'
fig = plt.figure(figsize=(14,5))
ax1 = fig.add_subplot(121)

plt.xlabel(u'上班(day)',fontproperties=font)
plt.ylabel(u'加班时间',fontproperties=font)

for index, value in enumerate(dic_c_l.keys()):
    temp = np.where(colors==value)
    ax1.scatter(temp, night.values[temp], c=value,marker= 'o', label= dic_c_l[value])
ax1.legend(loc='upper left')

ax2 = fig.add_subplot(122)
ax2.hist(night, bins = 40, normed= 0)


plt.xlabel(u'加班分钟数',fontproperties=font)
plt.ylabel(u'次数',fontproperties=font)

plt.show()
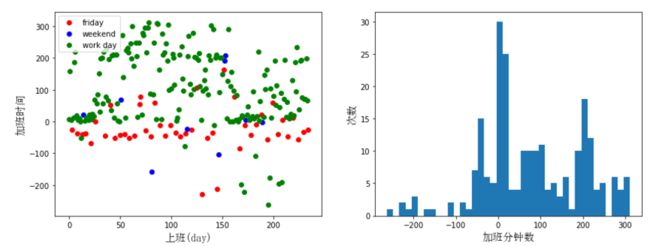
fig = plt.figure(figsize=(14,5))
ax1 = fig.add_subplot(121)

colors = np.array(['g']*morning.size)
dic_c_l = {'g':'work day', 'r':'monday', 'b':'weekend'}
for index, day in enumerate(morning.index):
    week = datetime.strptime(day, '%Y-%m-%d').weekday()
    if (week+1 == 1):
        colors[index] = 'r'
    elif (week+1==6 or week+1==7):
        colors[index] = 'b'

plt.xlabel(u'上班(day)',fontproperties=font)
plt.ylabel(u'迟到时间',fontproperties=font)

for index, value in enumerate(dic_c_l.keys()):
    temp = np.where(colors==value)
    ax1.scatter(temp, morning.values[temp], c=value,marker= 'o', label= dic_c_l[value])
ax1.legend(loc='upper left')

ax2 = fig.add_subplot(122)
ax2.hist(morning.values, bins = 80, normed= 0)


plt.xlabel(u'迟到分钟数',fontproperties=font)
plt.ylabel(u'次数',fontproperties=font)
plt.show()
