吴恩达机器学习课后习题ex2(python实现)
机器学习课后习题ex2
- logistic回归
- 正则化
- 提示资料
logistic回归
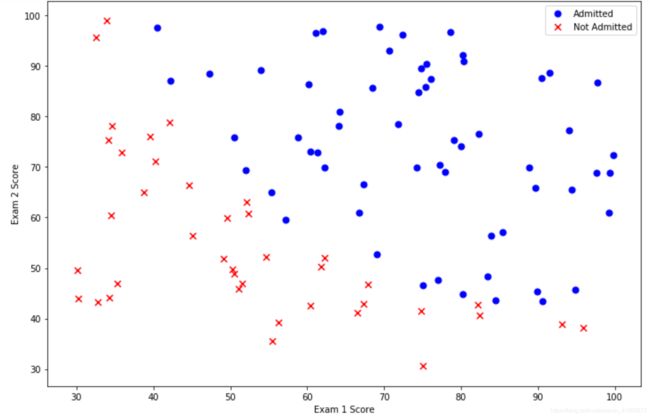
建立一个logistic回归模型来预测学生是否被大学录取。假设你是一所大学的系主任,你想根据每个申请者在两次考试中的成绩来决定他们的入学机会。建立一个分类模型来评估申请人根据这两次考试的分数,录取的可能性。
#前面和线性回归基本一样
import types
import numpy as np
import pandas as pd
import matplotlib.pyplot as plt
path='ex2data1.txt'
data=pd.read_csv(path,header=None,names=['scor1','scor2','judge'])
data.head()

positive = data[data['judge'].isin([1])]
negative = data[data['judge'].isin([0])]
##positive=data.loc[data['judge']==1]
##negative=data.loc[data['judge']==0]

fig, ax = plt.subplots(figsize=(12,8))
ax.scatter(positive['scor1'], positive['scor2'], s=50, c='b', marker='o', label='Admitted')
ax.scatter(negative['scor1'], negative['scor2'], s=50, c='r', marker='x', label='Not Admitted')
ax.legend()
ax.set_xlabel('Exam 1 Score')
ax.set_ylabel('Exam 2 Score')
plt.show()
positive和negative只是为了分别把judge=0/1的表格dataframe单独取出。只要达到这个目的即可。具体筛选行可以参考https://www.jianshu.com/p/cdc50eccc67d或者https://jingyan.baidu.com/article/0eb457e508b6d303f0a90572.html
data.insert(0,"ones",1)
cols=data.shape[1]
x=data.iloc[:,0:cols-1]
y=data.iloc[:,cols-1:cols]
x=np.matrix(x.values)
y=np.matrix(y.values)
#theta=np.zeros((1,3))
theta=np.matrix(np.zeros((1,3)))

def sigmoid(z):
    return 1/(1+np.exp(-z))

def computecost(x,y,theta):
    theta=np.matrix(theta)
    A=sigmoid(x@theta)
    inner1=np.multiply(np.log(A+1e-5),-y)
    inner2=np.multiply(1-y,np.log(1-A+1e-5))
    inner=inner1-inner2
    return np.sum(inner)/len(x)
梯度下降这里有一些改变,两种方法
1、继续用梯度下降,但是使用向量化计算,不再一个个计算 θ \theta θ,减少内置for循环(之前是双重循环)
1 m X T ( s i g m o i d ( X θ ) − y ) \frac1mX^T(sigmoid(X\theta)-y) m1XT(sigmoid(Xθ)−y)
theta=np.zeros((3,1))
def gradientdescent(x,y,theta,lr,epochs):

    costs=[]

    for i in range(epochs):
        A=sigmoid(x@theta)
       # for k in range(len(tmp)):
         #   tmp[i]=sigmoid(tmp[i])
        error=A-y  #100*1
        theta=theta-(lr/len(x))*x.T@error   #x.T*error  3*100*100*1=3*1
        cost=computecost(x,y,theta)
        costs.append(cost)
    return theta,cost

lr=0.004
epochs=200000
weights,cost=gradientdescent(x,y,theta,lr,epochs)
weights
def predict(x,theta):
    prob=sigmoid(x@theta)
    return [1 if x>=0.5 else 0 for x in prob]

y_pre=np.array(predict(x,weights))
y_pre=y_pre.reshape(len(y_pre),1)
acc=np.mean(y_pre==y)
print(acc)
结果是0.91
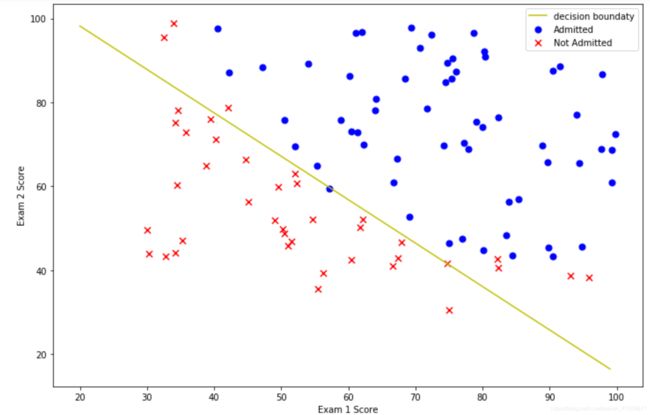
画出决策边界,决策边界就是 X θ = 0 X\theta=0 Xθ=0的线
θ 0 + θ 1 x 1 + θ 2 x 2 = 0 \theta_0+\theta_1x1+\theta_2x2=0 θ0+θ1x1+θ2x2=0
在坐标轴上,x1代表x,x2代表y。
#决策边界
x=np.arange(20,100)
f=w1+w2*x
positive=data.loc[data['judge']==1]
negative=data.loc[data['judge']==0]

fig, ax = plt.subplots(figsize=(12,8))
ax.scatter(positive['scor1'], positive['scor2'], s=50, c='b', marker='o', label='Admitted')
ax.scatter(negative['scor1'], negative['scor2'], s=50, c='r', marker='x', label='Not Admitted')
ax.plot(x,f,'y',label='decision boundaty')
ax.legend()
ax.set_xlabel('Exam 1 Score')
ax.set_ylabel('Exam 2 Score')

plt.show()
正则化
在质量保证期间,每个微芯片都要经过各种测试以确保它工作正常。假设你是工厂的产品经理,你有两个不同测试的微芯片测试结果。从这两个测试中,您想确定是否应该接受或拒绝微芯片。为了帮助你做出决定,你有一个过去微芯片测试结果的数据集,从中你可以建立一个逻辑回归模型。
import types
import numpy as np
import pandas as pd
import matplotlib.pyplot as plt
path='ex2data2.txt'
data=pd.read_csv(path,header=None,names=['res1','res2','admit'])
#画图
positive=data[data['admit']==1]
negative=data[data['admit']==0]
fig,ax=plt.subplots(figsize=(12,8))
ax.scatter(positive['res1'],positive['res2'],s=50,c='r',marker='o',label='admit')
ax.scatter(negative['res1'],negative['res2'],s=50,c='b',marker='x',label='not admit')
ax.legend()
ax.set_xlabel('res1')
ax.set_ylabel('res2')
plt.show()
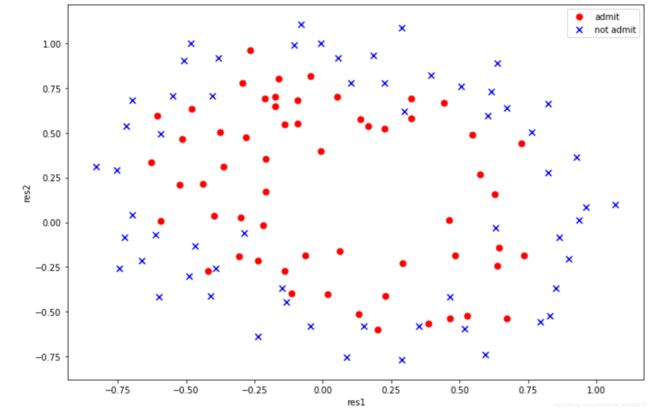
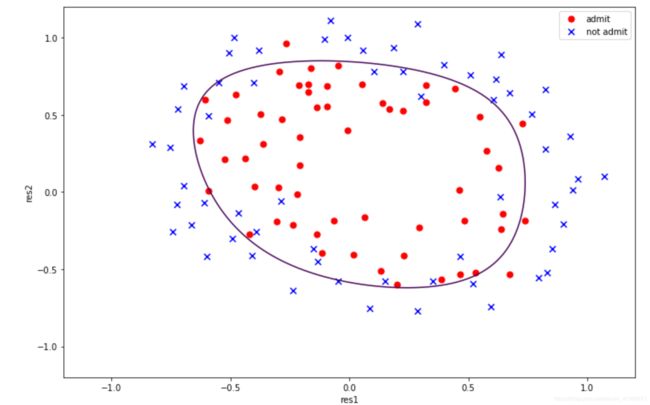
很明显,我们无法再使用一条直线来进行分界,线性不可分,无法再单纯的使用 θ 0 + θ 1 x 1 + θ 2 x 2 \theta_0+\theta_1x_1+\theta_2x_2 θ0+θ1x1+θ2x2,需要使用高维度。
这里我们采用特征映射,变成一个非线性函数
特征映射
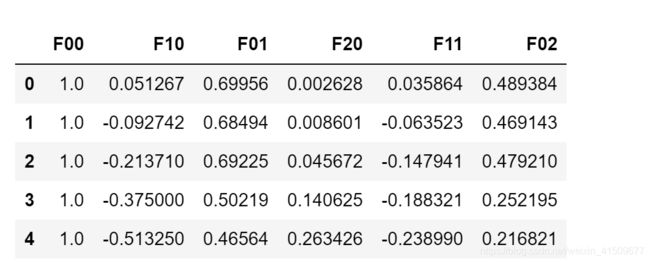
由 118 ∗ 3 118*3 118∗3变成 118 ∗ 28 118*28 118∗28
def featuremap(x1,x2,power):
    #定义一个字典
    data={
     }
    for i in range(power+1):
        for j in range(i+1):
            data['F{}{}'.format(i-j,j)]=np.power(x1,i-j)*np.power(x2,j)
    return pd.DataFrame(data) #

x1=data['res1']
x2=data['res2']
data2=featuremap(x1,x2,2)
data2.head()
解释一下pandas中的DataFrame可以使用以下构造函数创建 pandas.DataFrame( data, index, columns, dtype, copy)
data表示要传入的数据 ,包括 ndarray,series,map,lists,dict,constant和另一个DataFrame。
index和columns 行索引和列索引 格式[‘x1’,‘x2’]
x=data2.values
x.shape  #118*28
y=data.iloc[:,-1].values
y=y.reshape(y.shape[0],1)
type(y)
def sigmoid(z):
    return 1/(1+np.exp(-z))
    #多一个reg
def computecost(x,y,theta,lambd):
    theta=np.matrix(theta)
    x=np.matrix(x)
    y=np.matrix(y)
    first=np.multiply(-y,np.log(sigmoid(x*theta)))
    second=np.multiply((1-y),np.log(1-sigmoid(x*theta)))
    reg=(lambd/(2*len(x)))*np.sum(np.power(theta[1:],2))
    return np.sum(first-second)/(len(x))+reg
向量化梯度下降
def gradientdescent(x,y,theta,lr,epochs,lambd):
    costs=[]

    for i in range(epochs):
        reg=theta[1:]*(lambd/len(x))  #27*1
        #与pandas的insert类似,加入一行使theta可以以向量形式计算,可参考https://www.cnblogs.com/lucky75/p/11173717.html
        reg=np.insert(reg,0,values=0,axis=0)  #28*1

        A=sigmoid(x@theta)
        error=A-y  #
        theta=theta-(lr/len(x))*x.T@error-reg   #theta 28*1
        cost=computecost(x,y,theta,lambd)
        costs.append(cost)
    return theta,cost
theta=np.zeros((28,1))
lr=0.001
epochs=100000
lambd=0.001
theta_final,costs=gradientdescent(x,y,theta,lr,epochs,lambd)
theta_final
准确率是0.8305084745762712
#画图
x=np.linspace(-1.2,1.2,200)
#y=np.linspace(-1.2,1.2,200)
xx,yy=np.meshgrid(x,x)   #生成由x组成的网格图 横坐标x和纵坐标y经过meshgrid(x,y)后返回了所有直线相交的网络坐标点的横坐标xx和纵坐标yy  200*200

z=featuremap(xx.ravel(),yy.ravel(),6).values   #ravel和flatten扁平化操作  (40000, 28)  40000个值
zz=z@theta_final  #(40000, 1)
zz=zz.reshape(xx.shape)  #zz数组的大小必须和xx,yy大小一致

positive=data[data['admit']==1]
negative=data[data['admit']==0]
fig,ax=plt.subplots(figsize=(12,8))
ax.scatter(positive['res1'],positive['res2'],s=50,c='r',marker='o',label='admit')
ax.scatter(negative['res1'],negative['res2'],s=50,c='b',marker='x',label='not admit')
ax.legend()
ax.set_xlabel('res1')
ax.set_ylabel('res2')
plt.contour(xx,yy,zz,0)  #绘制等高线
plt.show()
def gradientdescent(x,y,theta,lr,epochs,lambd):
    costs=[]
    nums=theta.shape[0]
    theta=np.matrix(theta)
    x=np.matrix(x)
    y=np.matrix(y)
    grad = np.zeros((nums,1))
    for i in range(epochs):
        error=sigmoid(x*theta)-y
        for j in range(nums):
            term = np.multiply(error, x[:,j])

            if j==0:

                grad[j,0]=theta[j,0]-(lr/len(x))*np.sum(term)

            else:
                grad[j,0]=(1-lr*(lambd/len(x)))*theta[j,0]-((lr/len(x))*np.sum(term))

        theta=grad
        cost=computecost(x,y,theta,lambd)
        costs.append(cost)
    return theta,costs

lr=0.001
epochs=200000
lambd=0.001
theta_final,costs=gradientdescent(x,y,theta,lr,epochs,lambd)

def predict(x,theta):
    y_pre=sigmoid(x@theta)  #m*1
    return [1 if x>=0.5 else 0 for x in y_pre]  #这是一个列表list
y_pre=np.array(predict(x,theta_final))  #转换成ndarray格式
y_pre=y_pre.reshape(len(y_pre),1)
acc=np.mean(y_pre==y)
print(acc)
结果是0.8135593220338984
提示资料
1、pandas 中的三大数据结构:Series、DATa Frame、Index https://www.jianshu.com/p/98fcfcd2bd9d
2、

