酷炫!可视化神器Plotly玩转饼图
酷炫!可视化神器Plotly玩转饼图
之前发表过两篇关于Plotly的文章:
-
入门篇:酷炫!36张图爱上高级可视化神器Plotly_Express
-
散点图:酷炫!可视化神器Plotly玩转散点图
Plotly绘图最大的特点就是代码量少、图形颜色好看而且动态可视化,以后会连载Plotly绘图系列。
导入库
本文中使用的环境:
- Python3.7.5
- jupyter notebook
- plotly4.11.0
- plotly-express0.4.1
import pandas as pd
import numpy as np
import plotly_express as px
import plotly.graph_objects as go
from plotly.subplots import make_subplots
主要是通过两种方法制作饼图:
- plotly_express:px.pie
- plotly.graph_objects:go.Pie
基于Plotly_express实现饼图
默认饼图
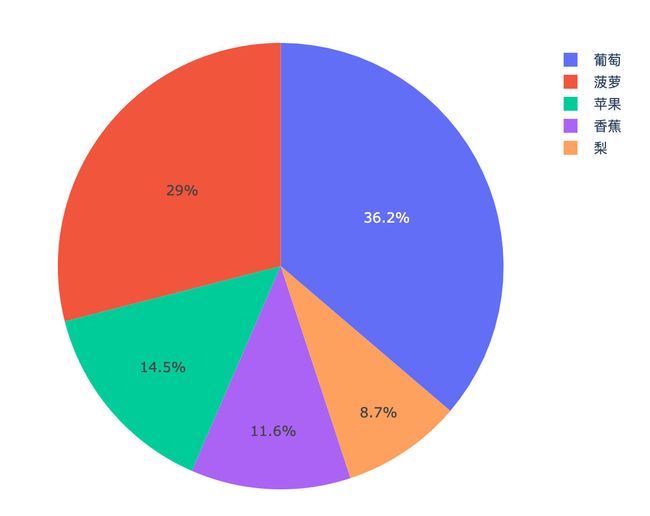
使用模拟的数据生成的基础饼图,生成了一个水果店5种水果的数量:
fruit = pd.DataFrame({

    "name":["苹果","香蕉","梨","菠萝","葡萄"],
    "number":[1000,800,600,2000,2500]})

fruit
fig = px.pie(fruit,names="name",values="number")
fig.show()
默认显示的是占比和右侧的分类名称
添加标题
fig = px.pie(fruit,
             names="name",
             values="number",
             title="水果数量占比"  # 添加标题
            )
fig.show()
⚠️:标题默认是在右上角,有时候我们想要标题居中,如何实现呢?
fig = px.pie(fruit,
             names="name",
             values="number"
            )

fig.update_layout(
    title={
        # 设置整个标题的名称和位置
        "text":"水果数量占比",
        "y":0.96,  # y轴数值
        "x":0.5,  # x轴数值
        "xanchor":"center",  # x、y轴相对位置
        "yanchor":"top"
    }
)

fig.show()
改变饼图颜色
通过上面饼图的制作,我们已经看到了Plotly_express的默认颜色,下面我们改变饼图的颜色:
1、通过参数color改变颜色:
fig = px.pie(fruit,
             names="name",
             values="number",
             color="number"
            )
fig.show()
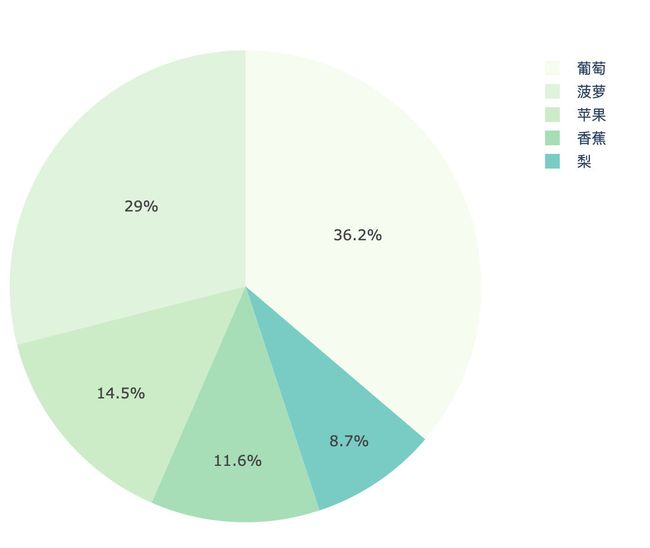
2、通过参数color_discrete_sequence设置:
fig = px.pie(fruit,
             names="name",
             values="number",
             # 不同颜色:RdBu、Peach
             color_discrete_sequence=px.colors.sequential.RdBu  # 只需要改变最后的RdBu即可
            )
fig.show()
上面的饼图展示了3种不同的颜色
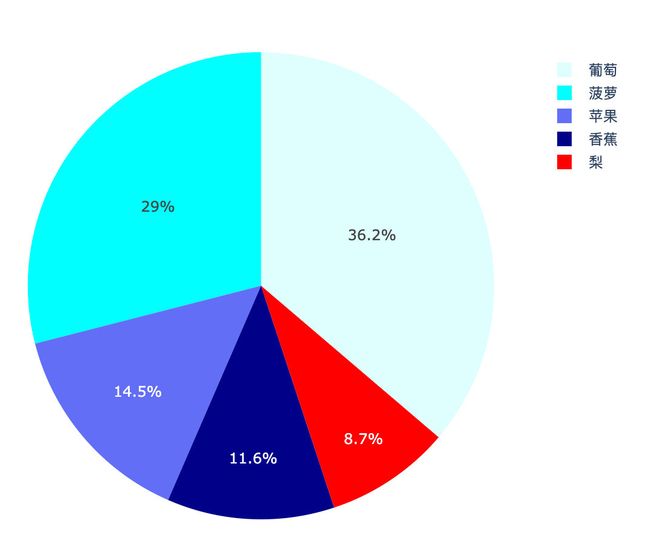
3、通过字典形式设置颜色:
fig = px.pie(fruit,
             names="name",
             values="number",
             color="name",
             color_discrete_map={
        # 字典形式设置颜色
                 '葡萄':'lightcyan',
                 '菠萝':'cyan',
                 '苹果':'royablue',
                 '香蕉':'darkblue',
                 '梨':'red'}
            )
fig.show()
文本信息设置
很多情况下我们想对显示在饼图中的文本信息进行设置
1、默认的饼图是显示百分比,改变显示的数据:
fig = px.pie(fruit,names="name",values="number")

fig.update_traces(
    textposition='inside',   # 文本显示位置:['inside', 'outside', 'auto', 'none']
    textinfo='percent+label'
)

fig.show()
上面的饼图中多显示了各种水果的名称:名称+百分比
fig = px.pie(fruit,names="name",values="number")

fig.update_traces(
    textposition='inside',
    textinfo='percent+value'
)

fig.show()
上面的饼图中显示的是:数值+百分比
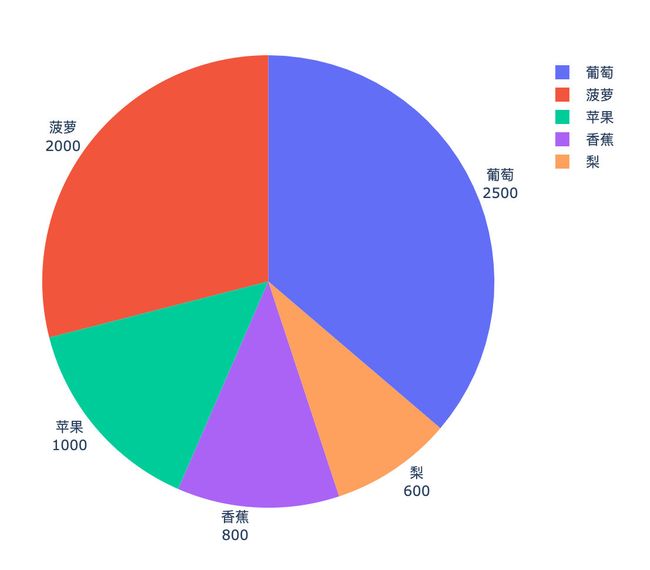
2、改变显示数据的位置,默认是在扇形区域内,可以设置成显示在外面:
fig = px.pie(fruit,names="name",values="number")

fig.update_traces(
    textposition='outside',  # 显示在外面
    textinfo='label+value'  # 标签名+数据
)

fig.show()
3、文本隐藏
比如Plotly中自带的数据绘制的饼图:
df = px.data.gapminder().query("year == 2007").query("continent == 'Europe'")

# 将满足条件的全部改为Other countries
df.loc[df["pop"] < 2.e6, "country"] = "Other countries"

fig = px.pie(df,
             names="country",
             values="pop",
             title="Population of Eurpean contient")
fig.show()
百分比过低的某些数据,我们想隐藏不显示:
fig = px.pie(gap, values='pop', names='country')

fig.update_traces(textposition='inside') # 文本显示位置:['inside', 'outside', 'auto', 'none']

fig.update_layout(uniformtext_minsize=15,  # 文本信息最小值
                  uniformtext_mode='hide'  # 3种模式:[False, 'hide', 'show']

                 )
fig.show()
uniformtext_mode设置成False:
4、文本信息显示方向
文本信息有3种显示方向:horizontal、radial、tangential,默认是水平方向horizontal显示的
# 默认效果是水平

fig = px.pie(fruit,names="name",values="number")

fig.update_traces(
    textposition='inside',   # 'inside','outside','auto','none'
    textinfo='percent+label',
    insidetextorientation='radial'   # horizontal、radial、tangential
)

fig.show()
甜甜圈图-Donut chart
甜甜圈图就是通过中间挖空来实现的,使用参数hole:
fig = px.pie(fruit,
             names="name",
             values="number",
             hole=0.3,   # 设置中间空心圆的比例:0-1之间
             title="水果数量占比"
            )
fig.show()
基于go.Pie实现
基础础饼图制作
import plotly.graph_objects as go

name=fruit["name"].tolist()
value=fruit["number"].tolist()

fig = go.Figure(
    data=[go.Pie(
        labels=name,
        values=value)
         ]
)

fig.show()
个性化边框设置
import plotly.graph_objects as go

name=fruit["name"].tolist()
value=fruit["number"].tolist()
colors = ['gold', 'mediumturquoise', 'darkorange', 'lightgreen', 'cyan']

# 绘图
fig = go.Figure(
    data=[go.Pie(
        labels=name,
        values=value)
         ]
)

# 更新traces
fig.update_traces(
    hoverinfo='label+percent',
    textinfo='value',
    textfont_size=20,
    marker=dict(colors=colors,
                line=dict(color='#000000',
                          width=2)))

fig.show()
文本方向设置
import plotly.graph_objects as go

labels = ['Oxygen','Hydrogen','Carbon_Dioxide','Nitrogen']
values = [4500, 2500, 1053, 500]

fig = go.Figure(data=[go.Pie(
    labels=labels,
    values=values,
    textinfo='label+percent',
    insidetextorientation='radial'
)])  #  同样也是3种朝向

fig.show()
甜甜圈图
import plotly.graph_objects as go

labels = ['Oxygen','Hydrogen','Carbon_Dioxide','Nitrogen']
values = [3000, 1500, 1000, 2500]

fig = go.Figure(data=[go.Pie(
    labels=labels,
    values=values,
    hole=.4)])

fig.show()
扇形区域脱离
import plotly.graph_objects as go

labels = ['Oxygen','Hydrogen','Carbon_Dioxide','Nitrogen']
values = [3000, 1000, 4000, 2500]

fig = go.Figure(data=[go.Pie(
    labels=labels,
    values=values,
    pull=[0.3,0.1,0,0]  # 设置脱离参数
)])

fig.show()
多饼图制作
这是来自官网的例子,讲解的是如何设置多饼图
from plotly.subplots import make_subplots

labels = ["US", "China", "European Union", "Russian Federation", "Brazil", "India",
          "Rest of World"]

# 制作子图:'domain' 表示饼图
fig = make_subplots(
    rows=1,
    cols=2,
    specs=[[{
     'type':'domain'},
            {
     'type':'domain'}]])

# 添加两个子图
fig.add_trace(go.Pie(
    labels=labels,
    values=[16, 15, 12, 6, 5, 4, 42],
    name="GHG Emissions"),
              row=1,
              col=1)

fig.add_trace(go.Pie(
    labels=labels,
    values=[27, 11, 25, 8, 1, 3, 25],
    name="CO2 Emissions"),
              1, 2)   # 参数row和col可以省略

# 使用hole参数制作一个中空的甜甜圈
fig.update_traces(hole=.4, hoverinfo="label+percent+name")

fig.update_layout(
    title_text="Global Emissions 1990-2011",  # 图形的名字
    # 给甜甜圈添加注解
    annotations=[dict(text='GHG', x=0.15, y=0.5, font_size=20, showarrow=True),
                 dict(text='CO2', x=0.82, y=0.5, font_size=15, showarrow=False)])

fig.show()
import plotly.graph_objects as go
from plotly.subplots import make_subplots

# 通过rgb设置不同区块的颜色
night_colors = ['rgb(200, 75, 126)', 'rgb(18, 36, 37)', 'rgb(134, 53, 101)',
                'rgb(136, 55, 57)', 'rgb(206, 4, 4)']
sunflowers_colors =  ['rgb(200, 75, 126)', 'rgb(18, 36, 37)', 'rgb(134, 53, 101)',
                'rgb(136, 55, 57)', 'rgb(206, 4, 4)']
irises_colors =  ['rgb(200, 75, 126)', 'rgb(18, 36, 37)', 'rgb(134, 53, 101)',
                'rgb(136, 55, 57)', 'rgb(206, 4, 4)']
cafe_colors =   ['rgb(200, 75, 126)', 'rgb(18, 36, 37)', 'rgb(134, 53, 101)',
                'rgb(136, 55, 57)', 'rgb(206, 4, 4)']

# 设置子图个数和类型spec
specs = [[{
     'type':'domain'},   # 类型全部为饼图domain
          {
     'type':'domain'}],

         [{
     'type':'domain'},
          {
     'type':'domain'}]]

fig = make_subplots(rows=2, cols=2, specs=specs)  # 2行2列

# 添加4个饼图

labels = ['1st', '2nd', '3rd', '4th', '5th']

fig.add_trace(go.Pie(labels=labels,
                     values=[38, 27, 18, 10, 7],
                     name='Pie one',
                     marker_colors=night_colors), 1, 1)

fig.add_trace(go.Pie(labels=labels,
                     values=[28, 26, 21, 15, 10],
                     name='Pie two',
                     marker_colors=sunflowers_colors
                    ), 1, 2)

fig.add_trace(go.Pie(labels=labels,
                     values=[8, 19, 16, 14, 13],
                     name='Pie three',
                     marker_colors=irises_colors), 2, 1)

fig.add_trace(go.Pie(labels=labels,
                     values=[31, 24, 19, 18, 8],
                     name='Pie four',
                     marker_colors=cafe_colors), 2, 2)

#
fig.update_traces(hoverinfo='label+percent+name', textinfo='value')  # ['label', 'text', 'value', 'percent']

fig.update(layout_title_text='plotly绘制4个子饼图',  #  设置标题
           layout_showlegend=True)   # 是否显示右侧图例

fig = go.Figure(fig)
fig.show()
旭日图制作
旭日图表示数据层级之间的大小关系:
1、基础旭日图
import plotly.express as px
data = dict(
    # 设置每个元素及父级元素(个数相同,注意最里层的空集)
    character=["Eve", "Cain", "Seth", "Enos", "Noam", "Abel", "Awan", "Enoch", "Azura"],
    parent=["", "Eve", "Eve", "Seth", "Seth", "Eve", "Eve", "Awan", "Eve" ],
    value=[10, 14, 12, 10, 4, 6, 2, 4, 3])

fig =px.sunburst(
    data,
    names='character',
    parents='parent',
    values='value',
)
fig.show()
2、基于DataFrame长表的旭日图
fig = px.sunburst(tips,
                  path=['day','time','sex'],  # 最里层是day,中间是time,最外层是sex
                  values='total_bill'
                 )
fig.show()
2、改变旭日图颜色
df = px.data.tips()

fig = px.sunburst(
  df,
  path=['time', 'sex', 'day'],
  values='total_bill',
  color='day')    # 设置color参数

fig.show()
3、通过color_continuous_scale参数改变
# 设置旭日图颜色

fig = px.sunburst(
    tips,
    path=['day','time','sex'],  # 最里层是day,中间是time,最外层是sex
    values='total_bill',
    color='total_bill',
    hover_data=['total_bill'],
    color_continuous_scale='RdBu',
#     color_continuous_midpoint=np.average(tips["total_bill"] * 1.5)
                 )
fig.show()
参数备忘录
基于plotly.express.pie的参数
plotly.express.pie(
  data_frame=None,  # 绘图数据
  names=None,   # 每个扇形区域名字
  values=None,  # 数值大小
  color=None,   # 颜色
  color_discrete_sequence=None,   # 颜色连续型设置
  color_discrete_map=None,  # 通过字典类型设置
  hover_name=None,   # 悬停显示的名称和数据
  hover_data=None,
  custom_data=None,
  labels=None, #  带字符串键和字符串值的dict,默认为{}。此参数用于修改图表中显示的列名称
  title=None, # 标题
  template=None, # 字符串或Plotly.py模板对象,有三个内置的 Plotly 主题:plotly, plotly_white 和 plotly_dark
  width=None, # 长、宽、透明度
  height=None,
  opacity=None,
  hole=None) # 中空比例
尤而小屋,一个温馨的小屋。小屋主人,一手代码谋求生存,一手掌勺享受生活,欢迎你的光临


