#creat a dataset(生成数据)
specie<-c(rep("sorgho",3),rep("poacee",3),rep("banana",3),rep("triticum",3))
condition<-rep(c("normal","stress","Nitrogen"),4)
value<-abs(round(rnorm(12,0,15),2))
df<-data.frame(specie,condition,value)
library(ggplot2)
#分组柱形图
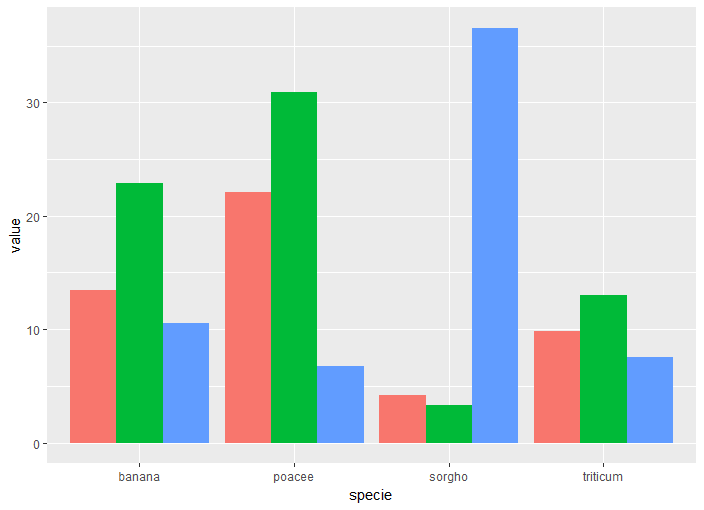
p1<-ggplot(df,aes(x=specie,y=value,fill=condition))+geom_bar(position="dodge",stat="identity")
p1+theme(legend.position = "none")#去掉右侧图例
p1+scale_fill_manual(values=c("blue","red","green"))#自定义填充色
#堆积柱形图
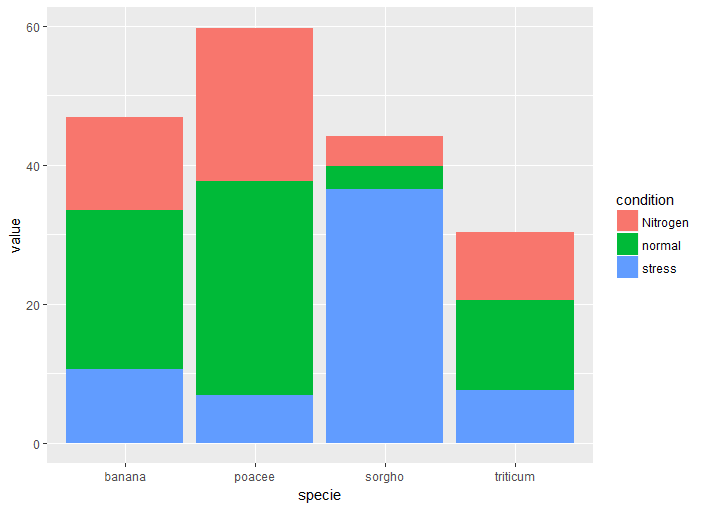
ggplot(df,aes(x=specie,y=value,fill=condition))+geom_bar(stat="identity")
ggplot(df,aes(x=specie,y=value,fill=condition))+
  geom_bar(stat="identity")+
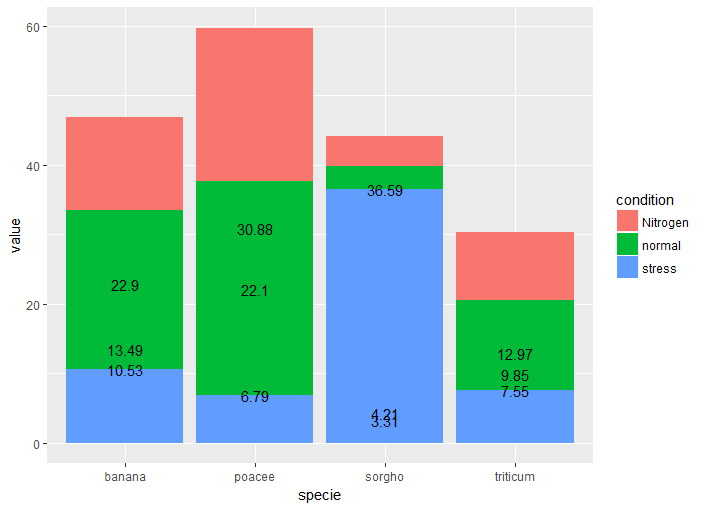
  geom_text(aes(label=value),position=position_stack(vjust=0.5))#添加标签
可以比较一下一下三条命令出图的区别
ggplot(df,aes(x=specie,y=value,fill=condition))+
  geom_bar(stat="identity")+
  geom_text(aes(label=value))#1
ggplot(df,aes(x=specie,y=value,fill=condition))+
  geom_bar(stat="identity")+
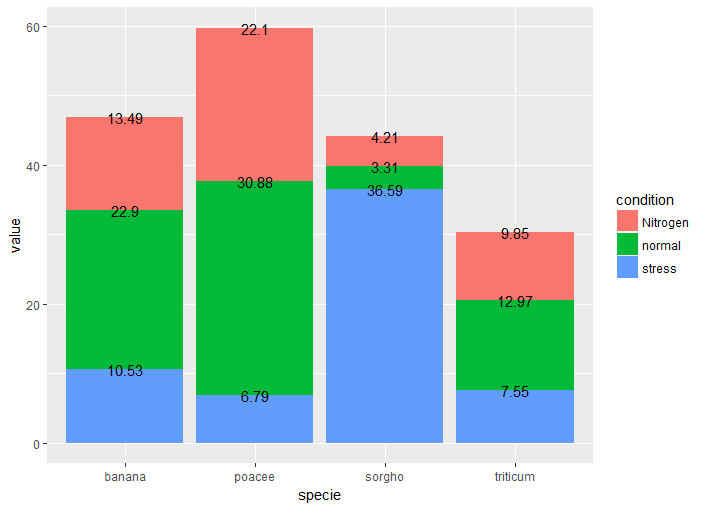
  geom_text(aes(label=value),position=position_stack())#2 position_stack()参数用来调整添加的标签和每部分堆积柱子相匹配,默认应该是添加到每部分顶端
ggplot(df,aes(x=specie,y=value,fill=condition))+
  geom_bar(stat="identity")+
  geom_text(aes(label=value),position=position_stack(vjust=0.5))#3 vjust参数用来调整标签的为重,vjust=0.5将标签放到对应部位的中部
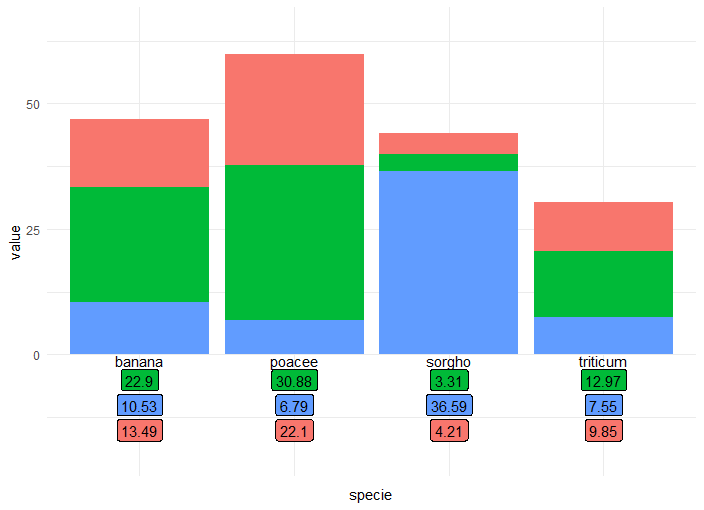
基本的堆积柱形图应该做完了,接下来模仿这张图片
暂时只想到一种解决办法,更改数据格式,把之前用到的df数据集改成这样:添加两列用来指定文本和标签的位置
ggplot(df,aes(x=specie,y=value,fill=condition))+
  geom_bar(stat="identity")+
  geom_text(aes(label=specie,y=var4))+ylim(-20,65)+#设置纵坐标范围以掩盖多余的标签
  geom_label(aes(label=value,y=var5))+theme_bw()+
  theme(axis.text.x = element_blank(),#去除横坐标轴标签
        axis.ticks.x = element_blank(),#去除横坐标刻度
        axis.line.x = element_blank(),
        panel.border = element_blank(),#去掉边框
        axis.ticks.y = element_blank(),#去掉纵坐标刻度
        legend.position="none")#去掉图例
PS:突然想到之前遇到的一个问题找到了解决办法,明天(20180702)来补充;找资料还找到了python绘制堆积柱形图的代码,明天也重复一下。有些困了,睡觉
更新
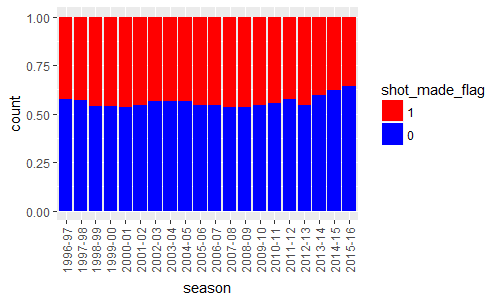
之前学习过kaggle的一篇文章https://www.kaggle.com/apapiu/exploring-kobe-s-shots探索科比的投篮选择
#完全重复其代码
setwd("Rpractice/kaggle_practice_data/Kobe_shot_selection/")
df<-read.csv("data.csv",stringsAsFactors=F)
train<-df[!is.na(df$shot_made_flag),]
names(train)
train$shot_made_flag<-factor(train$shot_made_flag,levels=c("1","0"))#这句代码很重要
ggplot(train,aes(x=season,fill=shot_made_flag))+geom_bar(stat="count",position="fill")+
scale_fill_manual(values=c("red","blue"))+
theme(axis.text.x = element_text(angle=90,vjust=0.5))#将横坐标标签调整为垂直,vjust 轻微调整位置

scale_fill_brewer(palette="Set1",direction=-1)#填充颜色
重复里面的堆积柱形图时遇到的问题:如果我想让上半部分红色与下半部分蓝色互换位置应该怎么办,答案:将代码一换成代码二
train$shot_made_flag<-factor(train$shot_made_flag,levels=c("1","0"))#代码一
train$shot_made_flag<-factor(train$shot_made_flag,levels=c("0","1"))#代码二
参考文章
https://stackoverflow.com/questions/34903368/how-to-center-stacked-percent-barchart-labels
https://stackoverflow.com/questions/45469147/ggplot2-update-stacked-barplot-with-percentage-labels
https://www.r-graph-gallery.com/48-grouped-barplot-with-ggplot2/
https://blog.csdn.net/Bone_ACE/article/details/47427453

