-
疫情

-
措施

利用echarts模仿WHO做疫情展示图II--X/Y轴区域内展示更多信息
上回指路:利用echarts模仿WHO做疫情展示图
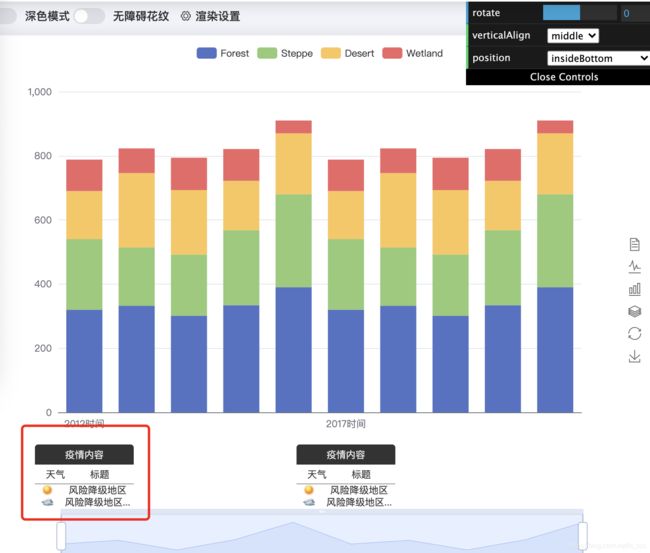
接上回项目页面需求更改,需要默认展示更多信息内容,于是提出两种展示方式,第一:在x轴展示区域内加一个类似表格方式展示疫情标题信息;第二:将该展示内容放在对应的y轴区域展示,即一个在X坐标轴以下,一个在X轴以上。利用官网案例演示的大概效果如下所示:
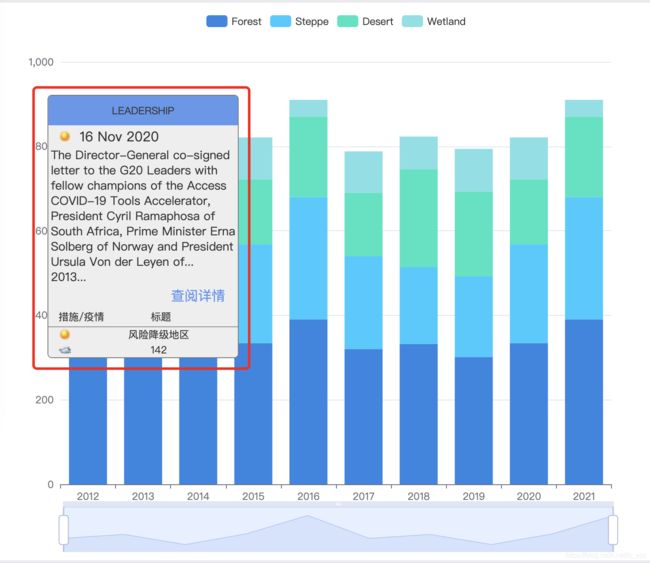
在Y轴对应区域展示(不同于在tooltip,是可以同时存在的另外一种展示形式)
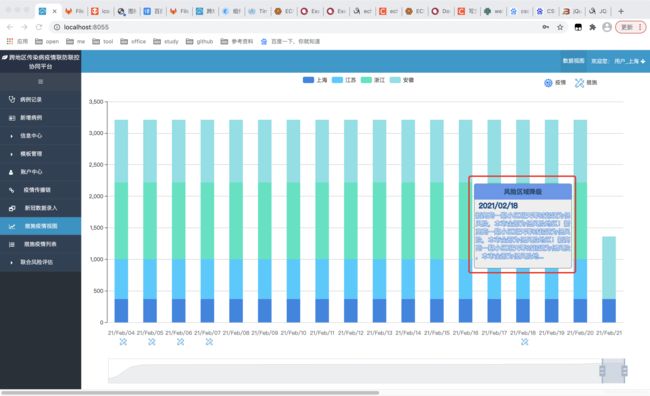
我的实现大致如下:
一、echarts的富文本标签实现
参考链接echarts的富文本标签实现原理大致实现上述效果
多行内容换行展示:换行展示内容
展示框主要利用formatter:function(param)和rich定义各个标签样式结合而成,因为不能自定义html所以只能利用这种方式展示了
我的代码相关片段:
itemStyle:{
normal:{
// extraCssText: 'z-index: 99',
// color:'rgb(0,128,70)',
label:{
show:true,
position:'insideBottom',
distance: 120,
// 默认展示最新一天的详情
formatter:function(param){
if(param.dataIndex==index){
console.log("tips",tips)
var main = '{title|'+ tips.newTitle[0] +'}'+'{abg|}'+'\n'+
'{time|'+ tips.datas +'}'+'\n'
var mainShow = tips.main[0];
// 数据问题--内容为空时直接返回
if (mainShow == undefined) {
return main;
}
var i = 0;
while (mainShow.length > 0 && i <= 5){
if (mainShow.length < 15) {
main += '{main|'+ mainShow +'}'+'\n'
break;
} else if (i >= 5 && mainShow.length >= 15) {
main += '{main|'+ mainShow.substring(0, 10) +'...'+'}'+'\n'
} else {
main += '{main|'+ mainShow.substring(0, 15) +'}'+'\n'
mainShow = mainShow.substring(15)
}
i++;
}
return main;
// return '{title|风险区域降级}{abg|}'+'\n'+
// '{measuresIcon|}{time|21/Feb/20}'+'\n'+
// '{main| 新高苑一期小区明天零时起调为低}'+'\n'+
// '{main|风险本市全部为低风险地区!新高苑}'+'\n'+
// '{main|一期小区明天零时起调为低风险,本市}'+'\n'+
// '{main|全部为低风险地区!新高苑一期小区明}'+'\n'+
// '{main|天零时起调为低风险,本市全部为}'+'\n'+
// '{main|低风险地区!...}';
// '{detail|查阅详情}';
// ' {weatherHead|措施/疫情}{valueHead|标题}'+'\n'+
// '{hr|}'+'\n'+
// ' {measuresIcon|}{value|风险降级地区}'+'\n'+
// ' {policyIcon|}{value|142}';
} else {
return '';
}
},
name: 'my_el',
backgroundColor: '#eee',
borderColor: '#777',
borderWidth: 1,
borderRadius: 4,
rich: {
title: {
// color: '#eee',
fontSize: 14,
color: '#333',
align: 'center'
},
br: {
borderColor: 'red',
width: 1,
borderWidth: 1,
height: 80,
},
abg: {
// backgroundColor: '#333',
backgroundColor: 'cornflowerblue',
width: '100%',
align: 'right',
height: 35,
borderRadius: [4, 4, 0, 0]
},
time: {
fontSize: 16,
color:'#333',
padding:[5,5,5,10],
align: 'left'
},
main:{
fontSize: 14,
color:'#eee',
padding:[2,3,2,3],
align: 'left'
},
detail:{
fontSize: 16,
color:'cornflowerblue',
padding:[5,15,5,5],
align: 'right'
},
weatherHead: {
color: '#eee',
height: 24,
align: 'left'
},
hr: {
borderColor: '#777',
width: '100%',
borderWidth: 0.5,
height: 0,
align: 'left',
},
value: {
color: '#eee',
width: 20,
padding: [0, 20, 0, 30],
align: 'left'
},
valueHead: {
color: '#eee',
width:20,
padding: [0, 20, 0, 30],
align: 'center'
},
rate: {
color: '#eee',
width: 40,
align: 'right',
padding: [0, 10, 0, 0]
},
rateHead: {
color: '#eee',
width: 40,
align: 'center',
padding: [0, 10, 0, 0]
},
// 配置底部x轴内容
measuresIcon: {
height: 15,
align: 'left',
backgroundColor: {
image: measuresIcon // 措施标识
},
},
policyIcon: {
height: 15,
align: 'left',
backgroundColor: {
image: policyIcon // 疫情标识
}
},
},
textStyle:{fontSize:18}
}
}
}二、解决js `setOption` should not be called during main process问题
因为我需要点击x轴后触发更换显示框内容,且显示内容必须跟随坐标轴位置移动,所以会有频繁调用后端查询接口请求,这时候就出现上述问题,解决方式如下:
用ajax请求的到json数据后去更新series中的数据,把实例和Option更改部分都放在ajax函数里就不报错了。
参考解决上述问题链接:
setOption问题解决参考方式一
其他可能对你有用方式:
ECharts:基础知识与问题解决
echarts重绘 &setOption第二个参数的含义
echarts多次使用SetOption时的数据问题
三、echarts点击数据添加跳转链接
参考链接:echarts点击数据添加调整链接
关于echarts添加点击事件,并实现跳转链接
四、点击x轴切换显示框内容
参考博文echarts中事件列表
事件on详细参数即案例
我的代码相关:
myChart.setOption(option, true);
     myChart.on('click',{element: 'my_el'},  function (params) {
     console.log("点击参数",params)

    if(params.componentType == "series" && params.dataIndex == day){
            // 弹框展示-- 后台请求获取当天所有数据
            getMain(time);
         }
    });

// 弹框--请求某天措施疾病内容
    function getMain(day) {
        $.ajax({
            type: 'GET',
            url: 'api/policy/',
            data: {
                time_format: day.split("\-")[0]
            },
            success: function (rm) {
                modalClose();
                var datas = rm.result;
                // 有措施或政策点击显示轮播图
                if (datas.length != 0) {
                    for (var i = 0; i < datas.length; i++) {
                        if (datas[i].type == 1) {
                            tips.title.push("疫情");
                        } else {
                            tips.title.push("措施");
                        }
                        tips.main.push(datas[i].content);
                        tips.newTitle.push(datas[i].title);
                        tips.city.push(datas[i].city);
                        window.start = {
                            format: 'YYYY/MM/DD',
                            insTrigger: true,
                            maxDate: moment(datas[i].time).format('YYYY/MM/DD')
                        };
                        tips.datas = start.maxDate;
                    }
                    modalOpen(tips);
                }

            }
        });
    }
五、其他七七八八的小问题
柱状图遮盖住我的提示框:增加:z:10000, // label展示内容在柱状图上层显示
完整代码段如下:
Title


