一、基础
一般画图的逻辑包括:
- 图片大小
- 是否分图
- 图表形式(什么图、里面的画线格式等)
- 图标题
- 横纵坐标轴
- 横纵坐标刻度
- 图例
- 网格
- 颜色
- text
1.1 基础设置
https://www.jianshu.com/p/9cddc1a3e43f
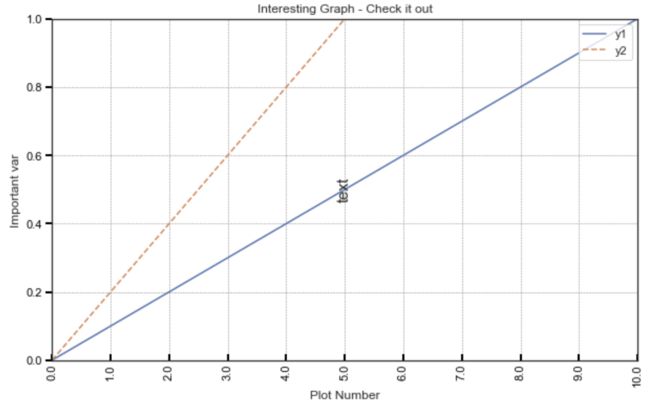
plt.figure(figsize=(10,6)) #设置图表大小

# 画图
x = range(11)
y1 = np.arange(0,1.1,0.1)
y2 = np.arange(0,2.1,0.2)

plt.plot(x,y1,label='y1')
plt.plot(x,y2,label='y2',linestyle='--')

#label设置
plt.title('Interesting Graph - Check it out')  # 图名
plt.xlabel('Plot Number')  # x轴标签
plt.ylabel('Important var') # y轴标签
plt.legend(loc = 'upper right')  # 显示图例,loc表示位置
# 'best'         : 0, (only implemented for axes legends)(自适应方式)
# 'upper right'  : 1,
# 'upper left'   : 2,
# 'lower left'   : 3,
# 'lower right'  : 4,
# 'right'        : 5,
# 'center left'  : 6,
# 'center right' : 7,
# 'lower center' : 8,
# 'upper center' : 9,
# 'center'       : 10,

# lim和ticks会互相覆盖,最终的尺度会以最后一个设置为标准
plt.xticks(range(11),labels=["%.1f" %i for i in range(11)],rotation = 90)  # 设置x刻度和标签,旋转角度
plt.yticks([0,0.2,0.4,0.6,0.8,1.0,1.2])  # 设置y刻度
plt.xlim([0,10])  # x轴边界
plt.ylim([0,1])  # y轴边界


# 刻度显示
plt.tick_params(axis='x',which = 'major',direction='in', length=6, width=2, colors='black')
plt.tick_params(axis='y',direction='out', length=6, width=2, colors='black')


# 显示网格
# linestyle:线型
# color:颜色
# linewidth:宽度
# axis:x,y,both,显示x/y/两者的格网
plt.grid(True, linestyle = "--",color = "gray", linewidth = "0.5",axis = 'both')

# 显示图标
plt.text(x=5, y=0.5,s='text',ha='center', va='center',fontsize=15, rotation=90)
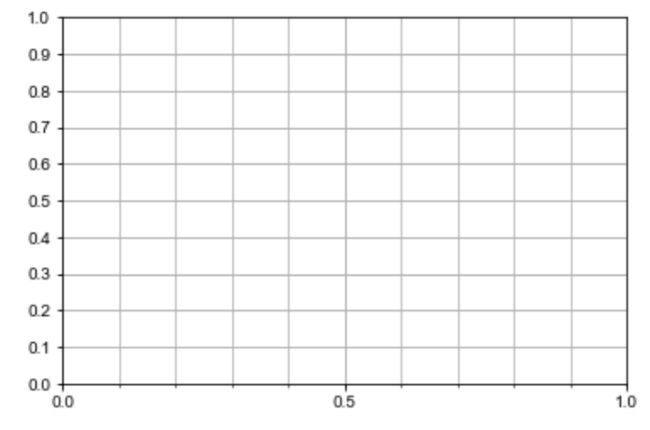
如果要设置主刻度和次刻度,比较麻烦,必须配合matplotlib.ticker使用。最终的参数用plt.tick_params来设置显示格式
from matplotlib.ticker import MultipleLocator, FormatStrFormatter

xmajorLocator = MultipleLocator(0.5) # 将x主刻度标签设置为10的倍数
xmajorFormatter = FormatStrFormatter('%.1f') # 设置x轴标签文本的格式
xminorLocator   = MultipleLocator(0.1) # 将x轴次刻度标签设置为5的倍数
ymajorLocator = MultipleLocator(0.1) # 将y轴主刻度标签设置为0.5的倍数
ymajorFormatter = FormatStrFormatter('%.1f') # 设置y轴标签文本的格式
yminorLocator   = MultipleLocator(0.1) # 将此y轴次刻度标签设置为0.1的倍数

# plt.gca()也可以用ax1来代替
plt.gca().xaxis.set_major_locator(xmajorLocator)  # 设置x轴主刻度
plt.gca().xaxis.set_major_formatter(xmajorFormatter)  # 设置x轴标签文本格式
plt.gca().xaxis.set_minor_locator(xminorLocator)  # 设置x轴次刻度

plt.gca().yaxis.set_major_locator(ymajorLocator)  # 设置y轴主刻度
plt.gca().yaxis.set_major_formatter(ymajorFormatter)  # 设置y轴标签文本格式
plt.gca().yaxis.set_minor_locator(yminorLocator)  # 设置y轴次刻度

plt.gca().xaxis.grid(True, which='major') #x坐标轴的网格使用主刻度
plt.gca().xaxis.grid(True, which='minor') #x坐标轴的网格使用主刻度
plt.gca().yaxis.grid(True, which='minor') #y坐标轴的网格使用次刻度
plt.gca().yaxis.grid(True, which='major') #y坐标轴的网格使用次刻度
1.2 多图
https://www.cnblogs.com/yymn/p/9479666.html
x= np.linspace(0,2*np.pi,500)
y1 = np.sin(x)
y2 = np.cos(x)
y3 = np.sin(x*x)

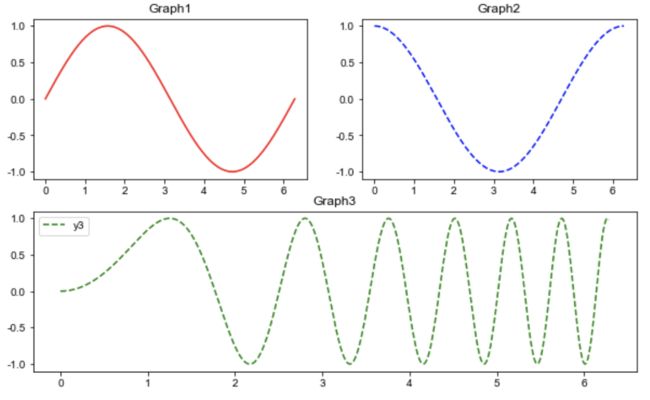
plt.figure(figsize=(10,6)) #设置图表大小
ax1 = plt.subplot(2,2,1)
ax2 = plt.subplot(2,2,2)
ax3 = plt.subplot(2,1,2)

# 选择ax1
plt.sca(ax1)
plt.plot(x,y1,color='red')
plt.title('Graph1')  # 图名

# 选择ax2
plt.sca(ax2)
plt.plot(x,y2,color='blue',linestyle='--')
plt.title('Graph2')  # 图名

# 选择ax3
plt.sca(ax3)
plt.plot(x,y3,'g--',label='y3')
plt.title('Graph3')  # 图名
plt.legend()
1.3 颜色
https://www.cnblogs.com/qianblue/p/10783261.html
自己搭的10色系
colors =['lightcoral', 'lightseagreen', 'cornflowerblue', 'orange','dodgerblue', 'tomato','mediumslateblue', 'gold',  'dimgray', 'peru']
plt.figure(figsize=(10,6))
plt.bar(range(10),range(1,11),color= colors)
二、常用图(基于seaborn)
https://blog.csdn.net/qq_40195360/article/details/86605860
- 直线图
import pandas as pd
import numpy as np
import matplotlib.pyplot as plt
import seaborn as sns
sns.set(style='darkgrid')
# Seaborn有五个预设好的主题: darkgrid , whitegrid , dark , white ,和 ticks 默认: darkgrid
# 用默认的格式可能存在不显示ticks的问题,如果要显示ticks,最好不要用预设主题

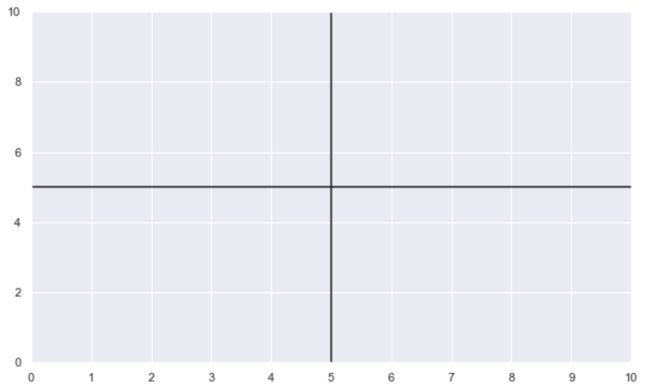
plt.figure(figsize=(10,6))
plt.hlines(5,0,10)
plt.vlines(5,0,10)
plt.xticks(range(11))

plt.xlim(0,10)
plt.ylim(0,10)
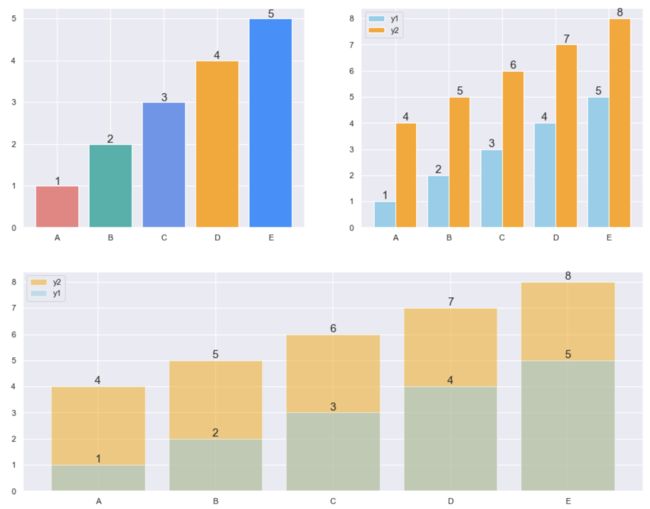
- 柱状图
plt.figure(figsize=(15,12))
ax1 = plt.subplot(2,2,1)
ax2 = plt.subplot(2,2,2)
ax3 = plt.subplot(2,1,2)


# 一般柱状图
plt.sca(ax1)
bar_width = 0.8
plt.bar(range(5),range(1,6),color= colors,width=bar_width)
plt.xticks(ticks=range(5), labels=('A','B','C','D','E'))
for i in range(5): #显示数值
    plt.text(i,i+1.1,i+1,ha='center', va='center',fontsize=15,)

# 双柱状图
plt.sca(ax2)
bar_width = 0.4
plt.bar(np.arange(5)-bar_width/2,range(1,6),color='skyblue',width=bar_width,label='y1')
plt.bar(np.arange(5)+bar_width/2,range(4,9),color='orange',width=bar_width,label='y2')
plt.xticks(ticks=range(5), labels=('A','B','C','D','E'))
plt.legend()

for i in range(5): #显示数值
    plt.text(i-bar_width/2,i+1.2,i+1,ha='center', va='center',fontsize=15,)
    plt.text(i+bar_width/2,i+4.2,i+4,ha='center', va='center',fontsize=15,)

# 叠加柱状图
plt.sca(ax3)
bar_width = 0.8
plt.bar(np.arange(5),range(4,9),color='orange',width=bar_width,label='y2',alpha=0.5)
plt.bar(np.arange(5),range(1,6),color='skyblue',width=bar_width,label='y1',alpha=0.5)
plt.xticks(ticks=range(5), labels=('A','B','C','D','E'))
plt.legend()

for i in range(5): #显示数值
    plt.text(i,i+1.2,i+1,ha='center', va='center',fontsize=15,)
    plt.text(i,i+4.2,i+4,ha='center', va='center',fontsize=15,)
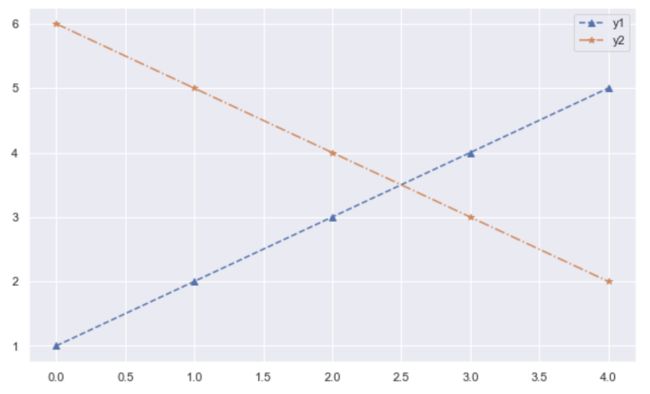
- 折线图
plt.figure(figsize=(10,6))
plt.plot(range(5),range(1,6),marker='^',linestyle='--',label='y1')
plt.plot(range(5),range(6,1,-1),marker='*',linestyle='-.',label='y2')
plt.legend()
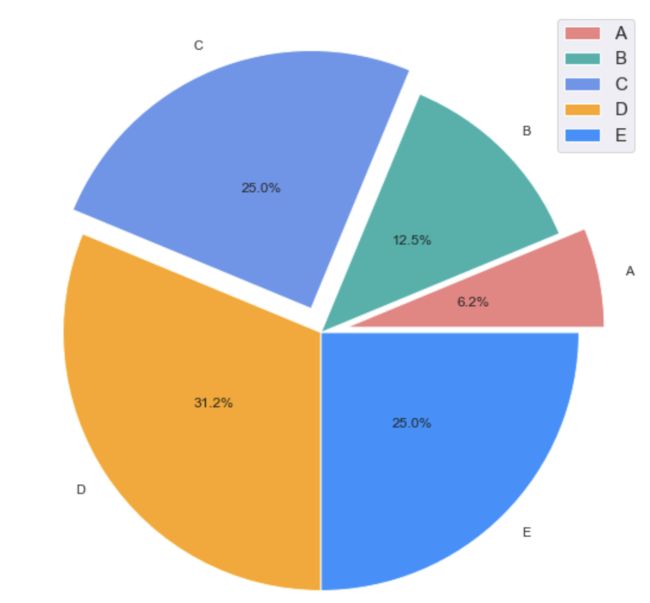
- 饼图
plt.figure(figsize=(10,10))
plt.pie([1,2,4,5,4],explode=[0.1,0,0.1,0,0],colors=colors,autopct='%1.1f%%',labels=['A','B','C','D','E'],\
        labeldistance=1.1,pctdistance=0.5,radius=1)
# labeldistance: 控制labels显示的位置
# pctdistance: 控制百分比显示的位置
# radius: 控制圆半径,会和figsize冲突
plt.legend(fontsize=15)
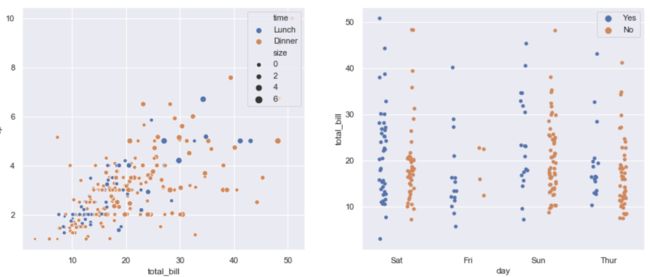
- 散点图
tips = sns.load_dataset("tips")
plt.figure(figsize=(15,6))
ax1 = plt.subplot(1,2,1)
ax2 = plt.subplot(1,2,2)

plt.sca(ax1)
sns.scatterplot(x="total_bill", y="tip", size='size',hue='time', data=tips)
plt.legend(loc='upper right')

plt.sca(ax2)
sns.stripplot(x="day", y="total_bill",hue='smoker',order=['Sat','Fri','Sun', 'Thur'], jitter=True, dodge=True, data=tips)
plt.legend(loc='upper right')

# order:用order参数进行筛选分类类别,例如:order=[‘sun’,‘sat’];
# jitter:抖动项,表示抖动程度,可以使float,或者True;
# dodge:重叠区域是否分开,当使用hue时,将其设置为True,将沿着分类轴将不同色调级别的条带分开。
# orient:“v” | “h”,vertical(垂直) 和 horizontal(水平)的意思;
- 箱线图/小提琴图
tips = sns.load_dataset("tips")
plt.figure(figsize=(15,6))
ax1 = plt.subplot(1,2,1)
ax2 = plt.subplot(1,2,2)

plt.sca(ax1)
sns.boxplot(x="day", y="total_bill", hue="time",data=tips,)
#箱型图是四分位点

plt.sca(ax2)
sns.violinplot(x="day", y="total_bill", hue="sex",data=tips)
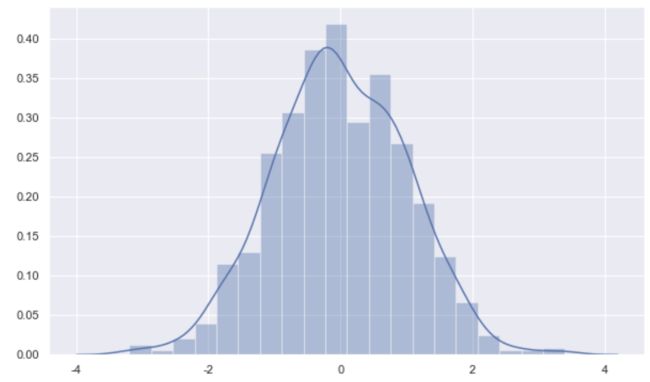
- 直方图
plt.figure(figsize=(10,6))

np.random.seed(666)
x = np.random.randn(1000)
ax = sns.distplot(x,bins=20,hist=True,kde=True)
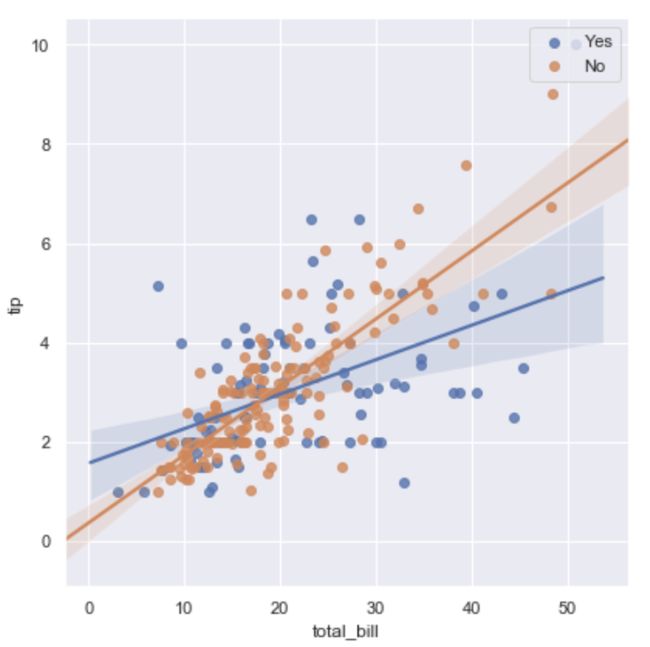
- 回归图
plt.figure(figsize=(10,6))

sns.lmplot(x="total_bill", y="tip", hue="smoker", data=tips, legend_out=False, height=6,)
plt.legend(loc='upper right')
#回归图无法调整图片大小,只能用height来设置参数
- 热力图
plt.figure(figsize=(10,6))

x= np.random.rand(10, 10)
ax = sns.heatmap(x,annot=True,annot_kws={'size':9, 'color':'black'},fmt='.4f',)
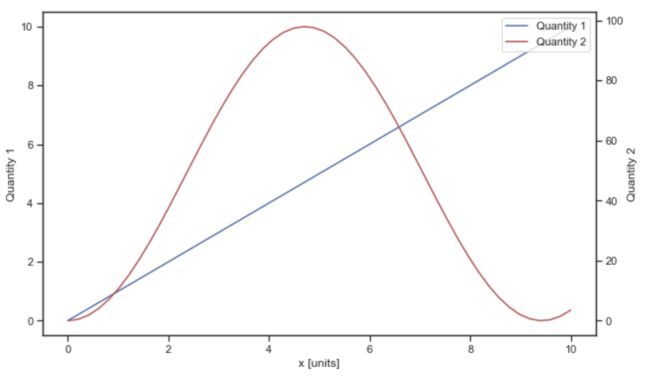
- 组合图
x = np.linspace(0,10)
y = np.linspace(0,10)
z = np.sin(x/3)**2*98

sns.set(style='ticks')
plt.figure(figsize=(10,6))
ax1 = plt.gca()
ax1.plot(x,y, '-', label = 'Quantity 1')

ax2 = ax1.twinx()
ax2.plot(x,z, '-r', label = 'Quantity 2')

ax1.set_xlabel("x [units]")
ax1.set_ylabel(r"Quantity 1")
ax2.set_ylabel(r"Quantity 2")

#图例
handles1, labels1 = ax1.get_legend_handles_labels()
handles2, labels2 = ax2.get_legend_handles_labels()
plt.legend(handles1+handles2, labels1+labels2, loc='upper right')
