Introduction
This blog post is a companion piece for my talk at https://devopsdaysindia.org. I will discuss the motivations, architecture, and the future of logging in Grafana! Let’s get right down to it. You can see the slides for the talk here: https://speakerdeck.com/gouthamve/devopsdaysindia-2018-loki-prometheus-but-for-logs
Motivation
Grafana is the defacto dashboarding solution for time-series data. It supports over 40 datasources (as of this writing), and the dashboarding story has matured considerably with new features, including the addition of teams and folders. We now want to move on from being a dashboarding solution to being an observability platform, to be the go-to place when you need to debug systems on fire.
Full Observability
Observability. There are a lot of definitions out there as to what that means. Observability to me is visibility into your systems and how they are behaving and performing. I quite like the model where observability can be split into 3 parts (or pillars): metrics, logs and traces; each complimenting each other to help you figure out what’s wrong quickly.
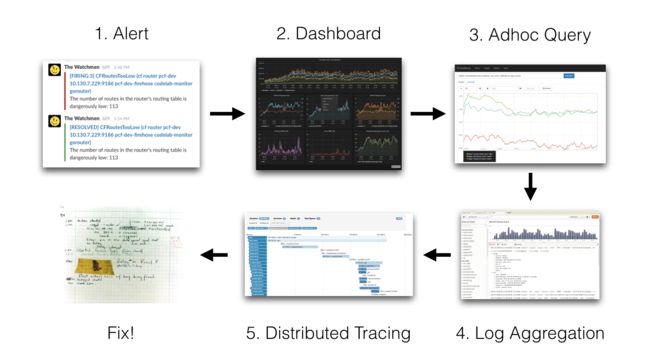
The following example illustrates how I tackle incidents at my job:Prometheus sends me an alert that something is wrong and I open the relevant dashboard for the service. If I find a panel or graph anomalous, I’ll open the query in Grafana’s new Explore UI for a deeper dive. For example, if I find that one of the services is throwing 500 errors, I’ll try to figure out if a particular handler/route is throwing that error or if all instances are throwing the error, etc.
Next up, once I have a vague mental model as to what is going wrong or where it is going wrong, I’ll look at logs. Pre Loki, I used to use kubectl to get the relevant logs to see what the error is and if I could do something about it. This works great for errors, but sometimes I get paged due to high latency. In this situation I get more info from traces regarding what is slow and which method/operation/function is slow. We use Jaeger to get the traces.
While these didn’t always directly tell me what is wrong, they usually got me close enough to look at the code and figure out what is going wrong. Then I can either scale up the service (if the service is overloaded) or deploy the fix.
Logging
Prometheus works great, Jaeger is getting there, and kubectl was decent. The label model was powerful enough for me to get to the bottom of erroring services. If I found that the ingester service was erroring, I’d do: kubectl --namespace prod logs -l name=ingester | grep XXX to get the relevant logs and grep through them.
If I found a particular instance was erroring or if I wanted to tail the logs of a service, I’d have to use the individual pod for tailing as kubectl doesn’t let you tail based on label selectors. This is not ideal, but works for most use-cases.
This worked, as long as the pod wasn’t crashing or wasn’t being replaced. If the pod or node is terminated, the logs are lost forever. Also, kubectl only stores recent logs, so we’re blind when we want logs from the day before or earlier. Further, having to jump from Grafana to CLI and back again wasn’t ideal. We needed a solution that reduced context switching, and many of the solutions we explored were super pricey or didn’t scale very well.
This was expected as they do waaaay more than select + grep, which is essentially what we needed. After looking at existing solutions, we decided to build our own.
Loki
Not happy with any of the open-source solutions, we started speaking to people and noticed that A LOT of people had the same issues. In fact, I’ve come to realise that lots of developers still SSH and grep/tail the logs on machines even today! The solutions they were using were either too pricey or not stable enough. In fact, people were being asked to log less which we think is an anti-pattern for logs. We thought we could build something that we internally, and the wider open-source community could use. We had one main goal:
- Keep it simple. Just support grep!
This tweet from @alicegoldfuss is not an endorsement and only serves to illustrate the problem Loki is attempting to solve
- We also aimed for other things:
- Logs should be cheap. Nobody should be asked to log less.
- Easy to operate and scale
- Metrics, logs (and traces later) need to work together
The final point was important. We were already collecting metadata from Prometheus for the metrics and we wanted to use that for log correlation. For example, Prometheus tags each metric with the namespace, service name, instance ip, etc. When I get an alert, I use the metadata to figure out where to look for logs. If we manage to tag the logs with the same metadata, we can seamlessly switch between metrics and logs. You can see the internal design doc we wrote here. See a demo video of Loki in action below:
Video: Loki - Prometheus-inspired, open source logging for cloud natives.
Architecture
With our experience building and running Cortex– the horizontally scalable, distributed version of Prometheus we run as a service– we came up with the following architecture:
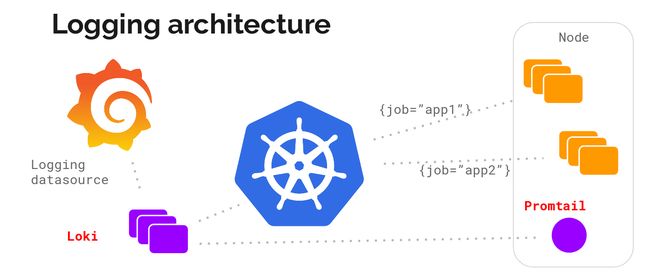
Metadata between metrics and logs matching is critical for us and we initially decided to just target Kubernetes. The idea is to run a log-collection agent on each node, collect logs using that, talk to the kubernetes API to figure out the right metadata for the logs, and send them to a central service which we can use to show the logs collected inside Grafana.
The agent supports the same configuration (relabelling rules) as Prometheus to make sure the metadata matches. We called this agent promtail.
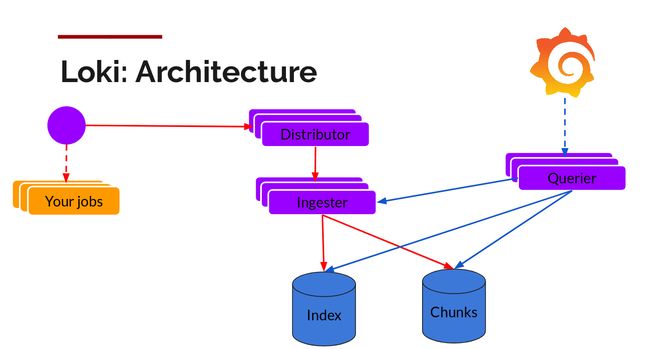
Enter Loki, the scalable log collection engine. The write path and read path (query) are pretty decoupled from each other and it helps to talk about it each separately.Distributor
Once promtail collects and sends the logs to Loki, the distributor is the first component to receive them. Now we could be receiving millions of writes per second and we wouldn’t want to write them to a database as they come in. That would kill any database out there. We would need batch and compress the data as it comes in.
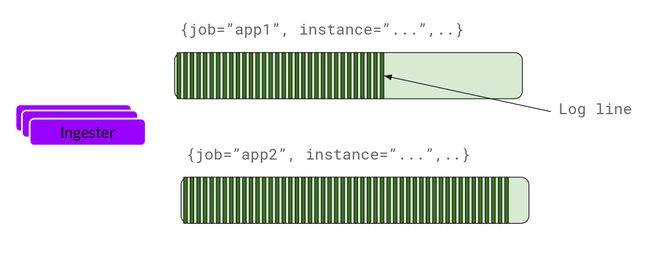
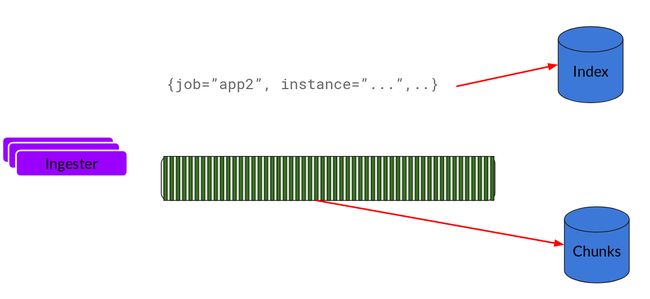
We do this via building compressed chunks of the data, by gzipping logs as they come in. The ingester component is a stateful component in charge of building and then later flushing the chunks. We have multiple ingesters, and the logs belonging to each stream should always end up in the same ingester for all the relevant entries to end up in the same chunk. We do this by building a ring of ingesters and using consistent hashing. When an entry comes in, the distributor hashes the labels of the logs and then looks up which ingester to send the entry to based on the hash value.Further, for redundancy and resilience, we replicate it n (3, by default) times.
Ingester
Now the ingester will receive the entries and start building chunks.This is basically gzipping the logs and appending them. Once the chunk “fills up”, we flush it to the database. We use separate databases for the chunks (ObjectStorage) and the index, as the type of data they store is different.
After flushing a chunk, the ingester then creates a new empty chunk and adds the new entries into that chunk.
Querier
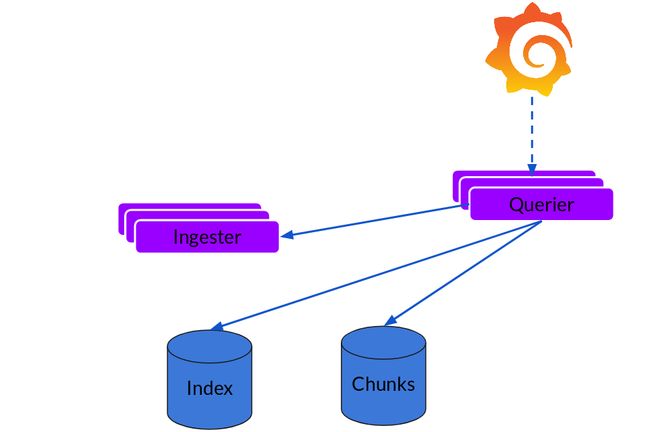
The read path is quite simple and has the querier doing most of the heavy lifting. Given a time-range and label selectors, it looks at the index to figure out which chunks match, and greps through them to give you the results. It also talks to the ingesters to get the recent data that has not been flushed yet.
Note that, right now, for each query, a single querier greps through all the relevant logs for you. We’ve implemented query parallelisation in Cortex using a frontend and the same can be extended to Loki to give distributed grep which will make even large queries snappy enough.
Scalability
Now let’s see if this scales.
- We’re putting the chunks into an object store and that scales.
- We put the index into Cassandra/Bigtable/DynamoDB which again scales.
- The distributors and queriers are stateless components that you can horizontally scale.
Coming to the ingester, it is a stateful component but we’ve built the full sharding and resharding lifecycle into them. When a rollout is done or when ingesters are scaled up or down, the ring topology changes and the ingesters redistribute their chunks to match the new topology. This is mostly code taken from Cortex which has been running in production for more than 2 years.
Caveats
While all of this works conceptually, we expect to hit new issues and limitations as we grow. It should be super cheap to run, given all the data will be sitting in an Object Store like S3. But you would only be able to grep through the data. This might not be suitable for other use-cases like alerting or building dashboards, which you’re better off doing in metrics.
Conclusion
Loki is very much alpha software and should not be used in production environments. We wanted to announce and release Loki as soon as possible to get feedback and contributions from the community and find out what’s working and what needs improvement. We believe this will help us deliver a higher quality and more on-point production release next year.
Loki can be run on-prem or as a free demo on Grafana Cloud. We urge you to give it a try and drop us a line and let us know what you think. Visit the Loki homepage to get started today.
