上次基本搞懂了怎么用各种滤波器,这次重点看看EMD的算法应用,怎么调参数以产生不同的分解波形。
# EMD经验模态分解
emd <- as.data.frame(emd(xt=diff(load[,"Load"]),boundary="wave",stoprule="type2")$imf)
dat <- cbind(dat,data.frame("EMD"=c(NA,cumsum(rowSums(emd[,3:6])))))
g <- melt(dat[,c("Time","EMD","Load")],id.vars="Time",na.rm=TRUE)
levels(g[,2]) <- c("EMD","Load")
plot.cycles(g,"EMD vs. Load")
emdff <- data.frame("Time"=dat[,"Time"],"EMD.Filter"=dat$EMD)
emdfilter = ggplot(data=emdff, aes(x = Time, y = EMD.Filter )) + geom_hline(yintercept=0,colour="red") + geom_line(aes(color = EMD.Filter)) + labs(y="EMD Filter")
emdfilter
案例中没有提到怎么绘制不同的IMF,下面开始尝试,参考EMD包的手册。
Usage
emd(xt, tt=NULL, tol=sd(xt)*0.1^2, max.sift=20, stoprule="type1",
boundary="periodic", sm="none", smlevels=c(1), spar=NULL, alpha=NULL,check=FALSE, max.imf=10, plot.imf=FALSE, interm=NULL, weight=NULL)
基础用法
emd <- emd(xt=load[,"Load"])
此方法会生成一个三维数组结果
1.imf为分解得到的特征模态函数
2.residue为余下的残差
3.nimf为特征模态函数的个数
可选参数
emd <-emd(xt=load[,"Load"],boundary="wave",stoprule="type5")
参数说明:主要有两个,boundary和stoprule,参考官方手册说明:
转化为data.frame,方便操作
emd <-emd(xt=load[,"Load"],boundary="wave",stoprule="type5")
生成用于绘图的dataframe
emdff <- data.frame("Time"=dat[,"Time"],"EMD"=emd[,1])
绘图
emdfilter = ggplot(data=emdff, aes(x = Time, y = EMD )) + geom_hline(yintercept=0,colour="red") + geom_line(aes(color = EMD)) + labs(y="IMF1")
emdfilter
这个图生成了颜色标签
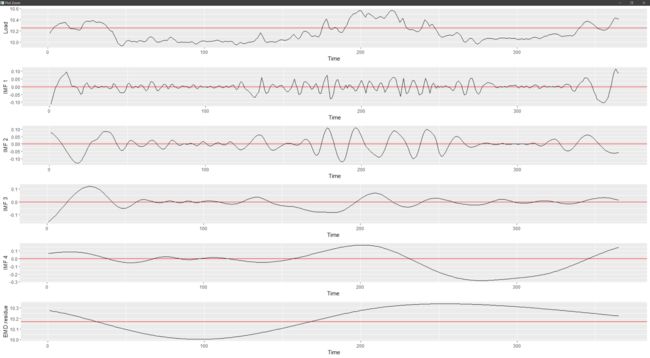
下面做一个完整实验用于生成合成图
emd实施,参数选择boundary=wave,stoprule=type5,type5是最新的一种类型,分类出来的结果重复性也较小。
emd1<-emd(xt=load[,"Load"],boundary="wave",stoprule="type5")
创建一个用于存储图表的list
plotlist=list()
先绘制原负载函数
plotlist[[1]]<-ggplot(data=load, aes(x = Time, Load)) + geom_hline(yintercept=((max(load[,"Load"])+min(load[,"Load"]))/2),colour="red") + geom_line(size=0.5)
循环绘制IMF
for(i in 1: emd1$nimf+1) {
  print(i)
emdframe <- data.frame("Time"=dat[,"Time"],"EMD"=emd1$imf[,i-1])
plotlist[[i]]<-ggplot(data=emdframe, aes(x = Time, y = EMD)) + geom_hline(yintercept=0,colour="red")+ geom_line(size=.5)+ labs(y=paste("IMF",i-1))
}
绘制残差
resdat <- data.frame("Time"=dat[,"Time"],"EMD.residue"=emd1$residue)
plotlist[[emd1$nimf+2]]<-ggplot(data=resdat, aes(x = Time, y =EMD.residue)) + geom_hline(yintercept=((max(resdat[,"EMD.residue"])+min(resdat[,"EMD.residue"]))/2),colour="red")  + geom_line(size=.5)
绘制组合图
totalplot<-cowplot::plot_grid(plotlist=plotlist,ncol=1)#将p1-p4四幅图组合成一幅图,按照两行两列排列,标签分别为A、B、C、D。(LETTERS[1:4] 意为提取26个大写英文字母的前四个:A、B、C、D)
totalplot
图1 boundary="wave",stoprule="type5"
全流程实现了只改emd函数的参数即可直接生成合成图,下面生成几个不一样参数的看看。


