官网:http://colorbrewer2.org
R语言中的颜色设置
brewer.pal()
参数为:brewer.pal(n ,name),其中n为不同颜色数,最小为3,最大取决于调色板中的颜色数。name指颜色的名称,如下所示:
> mypalette<-brewer.pal(7,"Greens")
> mypalette
[1] "#EDF8E9" "#C7E9C0" "#A1D99B" "#74C476" "#41AB5D" "#238B45" "#005A32"
display.brewer.pal()
在窗口中显示显示的颜色,如下所示:
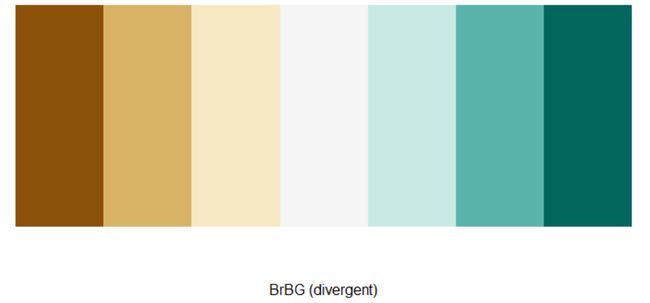
display.brewer.pal(7,"BrBG")
运行结果如下所示:
brewer.pal.info()可以查看颜色信息
> brewer.pal.info["Blues",]
      maxcolors category colorblind
Blues         9      seq       TRUE
display.brewer.all()
display.brewer.all(n=10, type="all", select=NULL, exact.n=TRUE,
colorblindFriendly=FALSE)
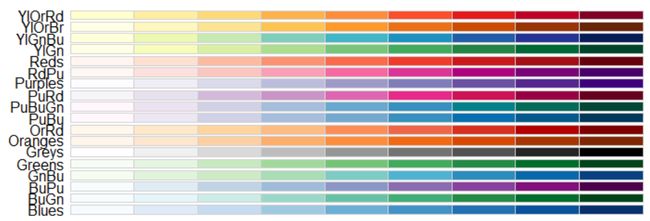
同时显示几个调色板,如下所示:
颜色类型
其中参数type是显示颜色类型,一共有三种颜色类型,分别是seq连续型,div离散型,qual极端型,如下所示:
display.brewer.all(type = "seq")
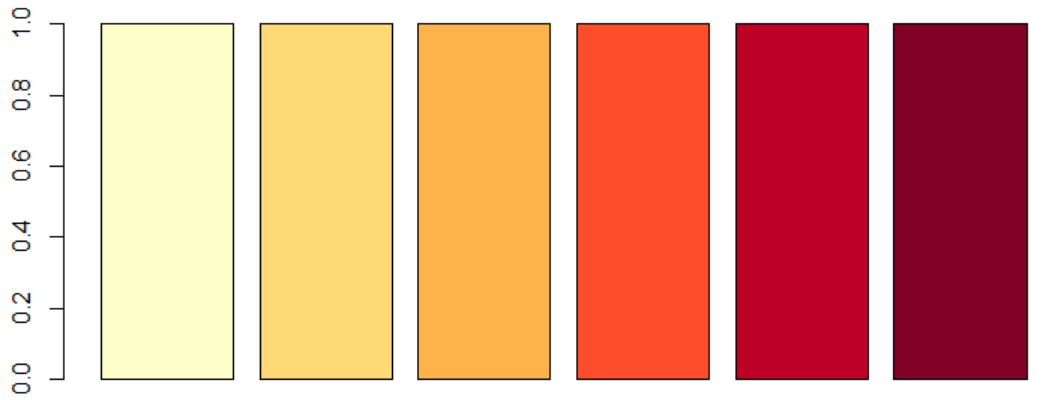
如果我们要使用YIOrRd组中的第1,3,4,6,8,9这6种颜色,可以使用下面的代码
barplot(rep(1,6),col = brewer.pal(9,"YlOrRd")[c(1,3,4,6,8,9)])
div离散型颜色,如下所示:
display.brewer.all(type = "div")
这种颜色两边亮,中间暗,比较适合进行高低对比。
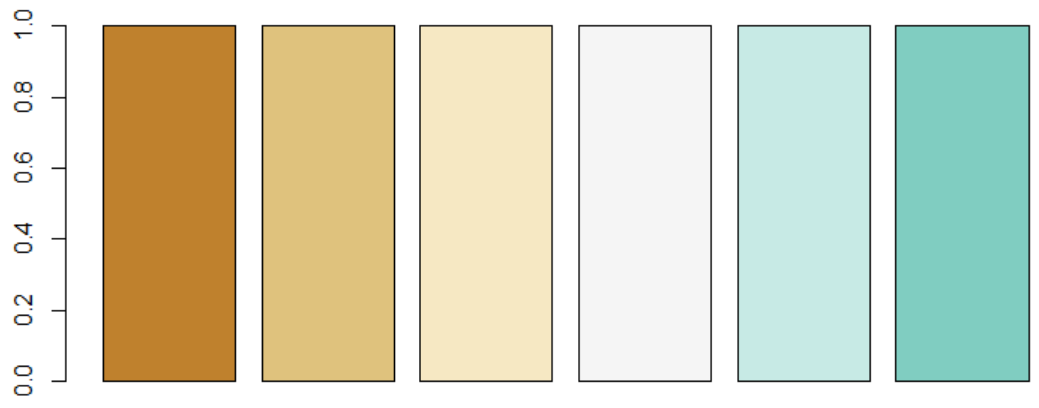
现在我们使用BrBG组中的3到8种颜色,如下所示:
barplot(rep(1,6),col = brewer.pal(11,"BrBG")[3:8])
qual极端型颜色
display.brewer.all(type = "qual")
这种颜色比较适合呈现分类变量。
现在使用Set3中的3到8种颜色,如下所示:
barplot(rep(1,6),col = brewer.pal(12,"Set3")[3:8])
RColorBrewer包使用案例
第1案例:从现在的颜色中挑选颜色
代码如下所示:
### Set the display a 1 by 1 grid
par(mfrow=c(1,1))
### Generate random data matrix
rand.data <- replicate(8,rnorm(100,100,sd=1.5))
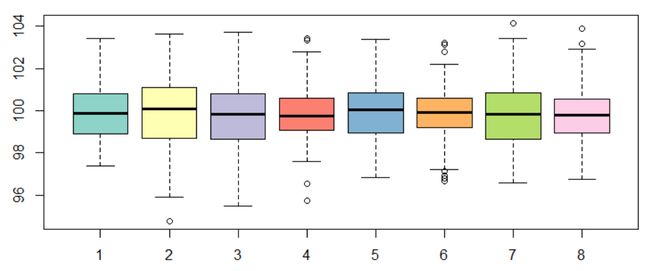
### Draw a box plot, with each box coloured by the 'Set3' palette
boxplot(rand.data,col=brewer.pal(8,"Set3"))
这里使用到了replicate()函数,这个函数在rand.data <- replicate(8,rnorm(100,100,sd=1.5))这个语句中的意思是,将后面的rnorm(100,100,sd=1.5)这个语句运行100次,也就是生成800个均值为100,sd为1.5的,符合正态分布的数据,结果如下所示:
第2案例:使用colorRampPalette()来扩展颜色
代码如下所示:
### 使用colorRampPalette可以扩展颜色。
newpalette<-colorRampPalette(brewer.pal(9,"Blues"))(10)
### Generate random data matrix
rand.data <- replicate(10,rnorm(100,100,sd=1.5))
### Draw a box plot, with each box coloured by the 'newpalette' palette
boxplot(rand.data,col=newpalette)
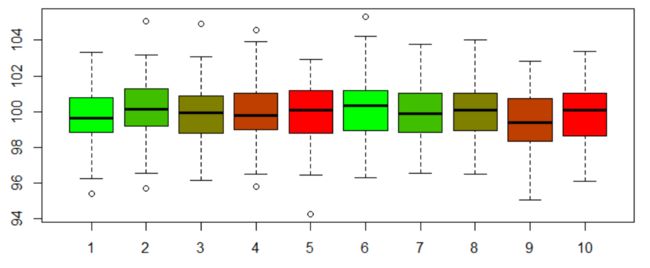
这里使用到了colorRampPalette()函数,此函数可以自定义一繁殖颜色梯度,如下所示:
colors <- colorRampPalette(c("green", "red"))(5)
colors
rand.data <- replicate(10,rnorm(100,100,sd=1.5))
boxplot(rand.data,col=colors)
这种功能在绘制热图时很有用。
wesanderson颜色包
可用的颜色有好几个,如下所示:
> names(wes_palettes)
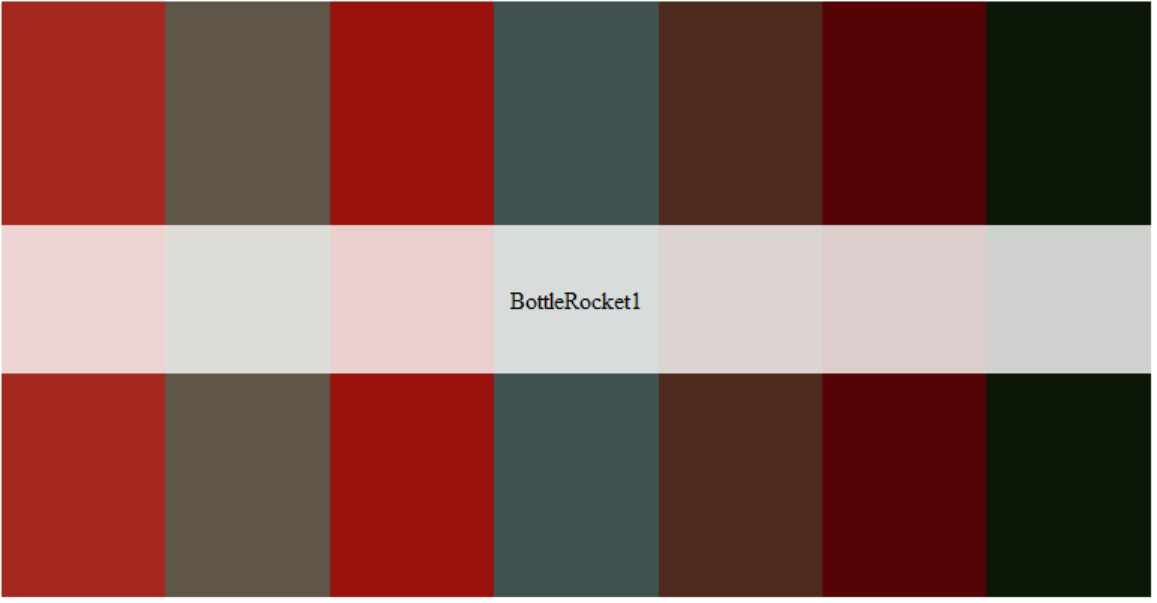
 [1] "BottleRocket1"  "BottleRocket2"  "Rushmore1"      "Rushmore"
 [5] "Royal1"         "Royal2"         "Zissou1"        "Darjeeling1"
 [9] "Darjeeling2"    "Chevalier1"     "FantasticFox1"  "Moonrise1"
[13] "Moonrise2"      "Moonrise3"      "Cavalcanti1"    "GrandBudapest1"
[17] "GrandBudapest2" "IsleofDogs1"    "IsleofDogs2"
查看一下,如下所示:
wes_palette("BottleRocket1")
wes_palette("BottleRocket2")
看一下使用案例:
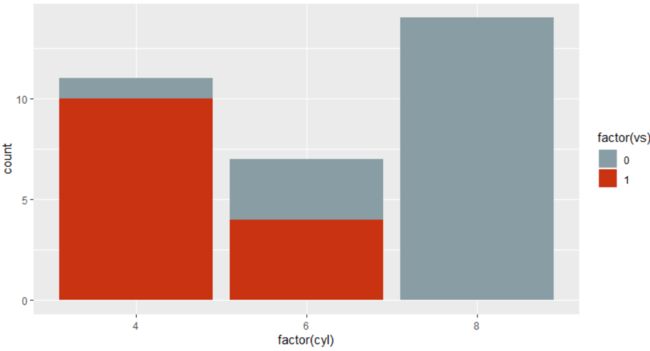
library("ggplot2")
ggplot(mtcars, aes(factor(cyl), fill=factor(vs))) +  geom_bar() +
  scale_fill_manual(values = wes_palette("Royal1"))
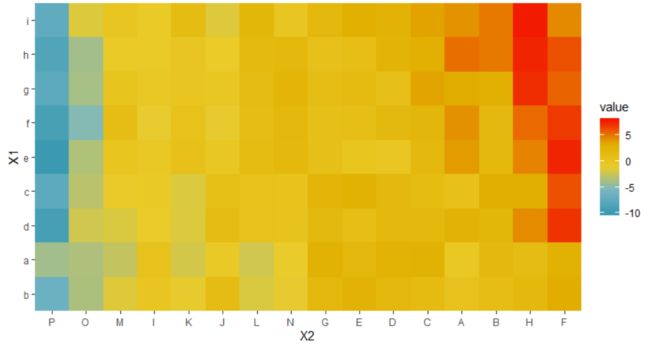
看一下热图案例:
pal <- wes_palette("Zissou1", 100, type = "continuous")
# heatmap is a local dataset
ggplot(heatmap, aes(x = X2, y = X1, fill = value)) +
  geom_tile() +
  scale_fill_gradientn(colours = pal) +
  scale_x_discrete(expand = c(0, 0)) +
  scale_y_discrete(expand = c(0, 0)) +
  coord_equal()
