OpenCV-Python实战(7)——直方图详解(❤️含大量实例,建议收藏❤️)
OpenCV-Python实战(7)——直方图详解(❤️含大量示例,建议收藏❤️)
-
- 0. 前言
- 1. 直方图简介
-
- 1.1 直方图相关术语
- 2. 灰度直方图
-
- 2.1 不带蒙版的灰度直方图
- 2.2 带有蒙版的灰度直方图
- 3. 颜色直方图
- 4. 直方图的自定义可视化
- 小结
- 相关链接
0. 前言
直方图是一种强大的技术,可以用于更好地理解图像内容。例如,许多相机在拍照时会实时显示正在捕获的场景的直方图,以调整相机拍摄的一些参数(例如曝光时间、亮度或对比度等)。在本文中,我们将学习直方图的相关概念,以及如何创建直方图。
1. 直方图简介
图像直方图是一种反映图像色调分布的直方图,其绘制每个色调值的像素数。每个色调值的像素数也称为频率( frequency )。因此,强度值在 [0, K-1] 范围内的灰度图像的直方图将恰好包含 K 个矩形。例如,在 8 位灰度图像的情况下,K = 256 ( 2 8 = 256 2^8 = 256 28=256),因此,强度值在 [0, 255] 范围内。直方图的每个矩形的高度定义为:
h ( i ) = number of pixels with intensity i , ( i ∈ [ 0 , 255 ] ) h(i) = \text{number of pixels with intensity }i,(i\in[0, 255]) h(i)=number of pixels with intensity i,(i∈[0,255])
例如, h ( 80 ) h(80) h(80) 即为= 强度为 80 的像素数。
为了更好的理解直方图,我们构建一个由 7 个不同的灰度级方块组成的图形。灰度值分别为: 30 、 60 、 90 、 120 、 150 、 180 和 210 。
def build_sample_image():
    # 定义不同的灰度值: 60, 90, 120, ..., 210
    tones = np.arange(start=60, stop=240, step=30)
    # 使用灰度值30初始化第一个60x60方块
    result = np.ones((60, 60, 3), dtype="uint8") * 30
    # 连接构建的所有灰度方块
    for tone in tones:
        img = np.ones((60, 60, 3), dtype="uint8") * tone
        result = np.concatenate((result, img), axis=1)

    return result

def build_sample_image_2():
    # 翻转构建的灰度图像
    img = np.fliplr(build_sample_image())
    return img
接下来,构建直方图并进行可视化:
def show_img_with_matplotlib(color_img, title, pos):
    img_RGB = color_img[:, :, ::-1]

    ax = plt.subplot(2, 2, pos)
    plt.imshow(img_RGB)
    plt.title(title)
    plt.axis('off')

def show_hist_with_matplotlib_gray(hist, title, pos, color):
    ax = plt.subplot(2, 2, pos)
    plt.title(title)
    plt.xlabel("bins")
    plt.ylabel("number of pixels")
    plt.xlim([0, 256])
    plt.plot(hist, color=color)

plt.figure(figsize=(14, 10))
plt.suptitle("Grayscale histograms introduction", fontsize=14, fontweight='bold')

# 构建图像并转换为灰度图像
image = build_sample_image()
gray_image = cv2.cvtColor(image, cv2.COLOR_BGR2GRAY)
image_2 = build_sample_image_2()
gray_image_2 = cv2.cvtColor(image_2, cv2.COLOR_BGR2GRAY)

# 构建直方图
hist = cv2.calcHist([gray_image], [0], None, [256], [0, 256])
hist_2 = cv2.calcHist([gray_image_2], [0], None, [256], [0, 256])

# 绘制灰度图像及直方图
show_img_with_matplotlib(cv2.cvtColor(gray_image, cv2.COLOR_GRAY2BGR), "image with 60x60 regions of different tones of gray", 1)
show_hist_with_matplotlib_gray(hist, "grayscale histogram", 2, 'm')
show_img_with_matplotlib(cv2.cvtColor(gray_image_2, cv2.COLOR_GRAY2BGR), "image with 60x60 regions of different tones of gray", 3)
show_hist_with_matplotlib_gray(hist_2, "grayscale histogram", 4, 'm')

plt.show()
直方图(下图中右侧图形)显示图像中每个色调值出现的次数(频率),由于每个方块区域的大小为 60 x 60 = 3600 像素,因此上述所有灰度值的频率都为 3,600,其他值则为 0:
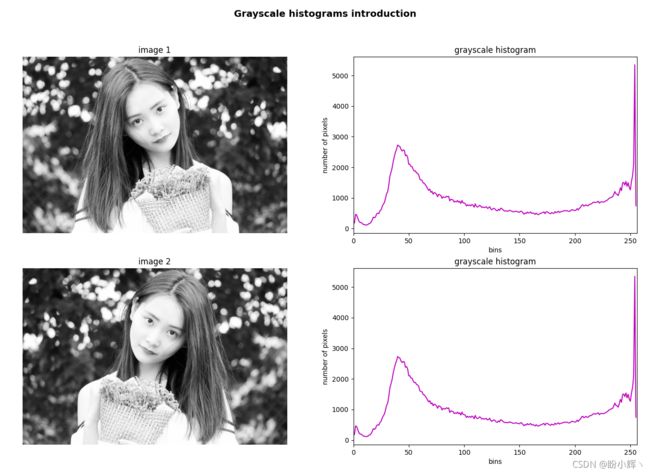
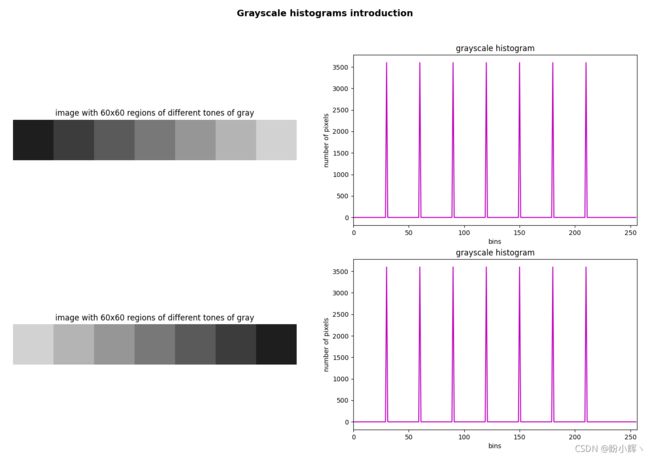 如上图所示,直方图仅显示统计信息,而不显示像素的位置。也可以加载真实照片,并绘制直方图,只需要修改
 build_sample_image() 函数:
def build_sample_image():
    image = cv2.imread('example.png')
    return image
1.1 直方图相关术语
上例中我们已经看到了构建直方图的简单示例,在深入了解直方图以及使用 OpenCV 函数构建和可视化直方图之前,我们需要了解一些与直方图相关的术语:
| 术语 | 介绍 |
|---|---|
| bins | 直方图显示了每个色调值(范围从 0 到 255)的像素数,每一个色调值都称为一个 bin。可以根据需要选择 bin 的数量,常见的值包括 8 、 16 、 32 、 64 、 128 、 256,OpenCV 使用 histSize 来表示 bins |
| range | 要测量的色调值的范围,通常为 [0,255] ,以对应所有色调值 |
2. 灰度直方图
OpenCV 中使用 cv2.calcHist() 函数来计算一个或多个数组的直方图。因此,该函数可以应用于单通道图像和多通道图像。
我们首先了解如何计算灰度图像的直方图:
cv2.calcHist(images, channels, mask, histSize, ranges[, hist[, accumulate]])
其中,函数参数如下:
| 参数 | 解释 |
|---|---|
| images | 以列表形式提供的 uint8 或 float32 类型的源图像,如 [image_gray] |
| channels | 需要计算直方图的通道的索引,以列表形式提供(例如,灰度图像中使用 [0],或多通道图像中 [0] , [1] , [2] 分别计算第一个、第二个或第三个通道的直方图) |
| mask | 蒙版图像,用于计算蒙版定义的图像特定区域的直方图,如果此参数等于 None,则将在没有蒙版的情况下使用完整图像计算直方图 |
| histSize | 它表示作为列表提供的 bin 数量,如 [256] |
| range | 要测量的强度值的范围,如 [0,256] |
2.1 不带蒙版的灰度直方图
计算全灰度图像(无蒙版)直方图的代码如下:
image = cv2.imread('example.png')
gray_image = cv2.cvtColor(image, cv2.COLOR_BGR2GRAY)
hist = cv2.calcHist([gray_image], [0], None, [256], [0, 256])
show_img_with_matplotlib(cv2.cvtColor(gray_image, cv2.COLOR_GRAY2BGR), "gray", 1)
show_hist_with_matplotlib_gray(hist, "grayscale histogram", 4, 'm')
在上述代码中, hist 是一个形状为 (256, 1) 的数组,每个值( bin )对应于具有相应色调值的像素数。
灰度图像的亮度可以定义为图像所有像素的平均强度,由以下公式给出:
B r i g h t n e s s = 1 m ⋅ n ∑ x = 1 m ∑ y = 1 n I ( x , y ) Brightness=\frac1 {m\cdot n}\sum ^m_{x=1}\sum ^n_{y=1}I(x,y) Brightness=m⋅n1x=1∑my=1∑nI(x,y)
这里, I ( x , y ) I(x, y) I(x,y) 是图像特定像素的色调值。因此,如果图像的平均色调较高,意味着图像的大多数像素将非常接近白色;相反,如果图像的平均色调较低,意味着图像的大多数像素将非常接近黑色。
我们可以对灰度图像执行图像加法和减法,以便修改图像中每个像素的灰度强度,以观察如何更改图像的亮度以及直方图如何变化:
M = np.ones(gray_image.shape, dtype="uint8") * 30
# 每个灰度值加 30
added_image = cv2.add(gray_image, M)
# 计算结果图像的直方图
hist_added_image = cv2.calcHist([added_image], [0], None, [256], [0, 256])
# 每个灰度值减 30
subtracted_image = cv2.subtract(gray_image, M)
# 计算结果图像的直方图
hist_subtracted_image = cv2.calcHist([subtracted_image], [0], None, [256], [0, 256])
# 可视化
show_img_with_matplotlib(cv2.cvtColor(added_image, cv2.COLOR_GRAY2BGR), "gray lighter", 2)
show_hist_with_matplotlib_gray(hist_added_image, "grayscale histogram", 5, 'm')
show_img_with_matplotlib(cv2.cvtColor(subtracted_image, cv2.COLOR_GRAY2BGR), "gray darker", 3)
show_hist_with_matplotlib_gray(hist_subtracted_image, "grayscale histogram", 6, 'm')
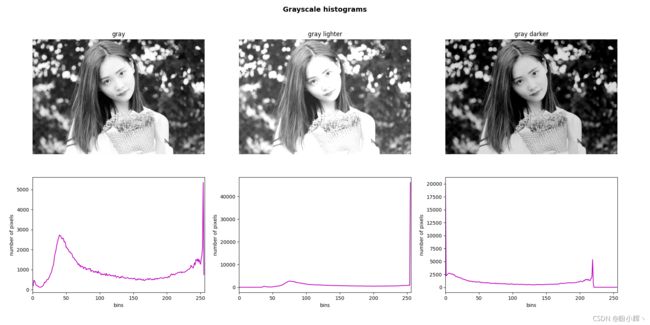
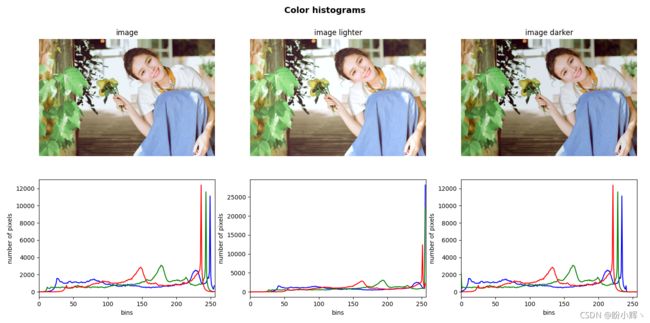
中间的灰度图像对应于原始图像的每个像素加 35 的图像,从而产生更亮的图像,图像的直方图会向右偏移,因为没有强度在 [0-35] 范围内的像素;而右侧的灰度图像对应于原始图像的每个像素都减去 35 的图像,从而导致图像更暗,图像的直方图会向左偏移,因为没有强度在 [220-255] 范围内的像素。
2.2 带有蒙版的灰度直方图
如果需要应用蒙版,需要首先创建一个蒙版。
# 加载并修改图像
image = cv2.imread('example.png')
height, width = image.shape[:2]
# 添加了一些具有 0 和 255 灰度强度的黑色和白色小圆圈
for i in range(0, width, 20):
    cv2.circle(image, (i, 390), 5, (0, 0, 0), -1)
    cv2.circle(image, (i, 10), 5, (255, 255, 255), -1)
# 将图像转换为灰度图像
gray_image = cv2.cvtColor(image, cv2.COLOR_BGR2GRAY)
# 创建蒙版
mask = np.zeros(gray_image.shape[:2], np.uint8)
mask[30:190, 30:190] = 255
蒙版由与加载图像尺寸相同的黑色图像组成,白色图像对应于要计算直方图的区域。
然后使用所创建的蒙版来计算直方图,调用 cv2.calcHist() 函数并传递创建的蒙版:
hist_mask = cv2.calcHist([gray_image], [0], mask, [256], [0, 256])
# 可视化
show_img_with_matplotlib(cv2.cvtColor(gray_image, cv2.COLOR_GRAY2BGR), "gray", 1)
show_hist_with_matplotlib_gray(hist, "grayscale histogram", 2, 'm')
show_img_with_matplotlib(cv2.cvtColor(masked_img, cv2.COLOR_GRAY2BGR), "masked gray image", 3)
show_hist_with_matplotlib_gray(hist_mask, "grayscale masked histogram", 4, 'm')
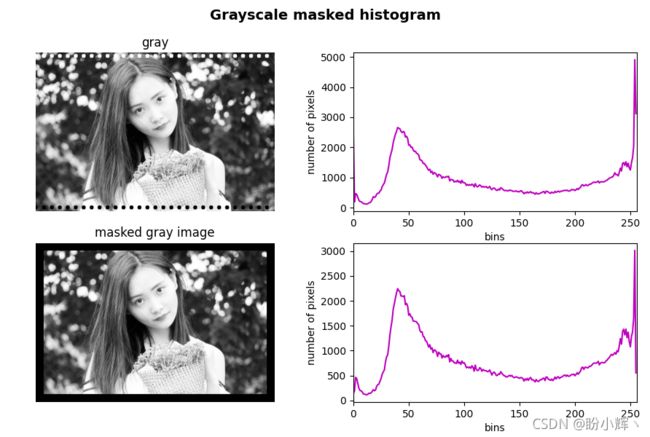
如上图所示,我们对图像进行了修改,我们在其中分别添加了一些黑色和白色的小圆圈,这导致直方图在 bins = 0 和 255 中有较大的值,如第一个直方图所示。但是,添加的这些修改不会出现在蒙版图像直方图中,因为应用了蒙版,因此在计算直方图时没有将它们考虑在内。
3. 颜色直方图
接下来,我们将了解如何计算颜色直方图。在多通道图像中,计算颜色直方图的实质上是计算每个通道的直方图,因此我们需要创建函数来计算多个通道的直方图:
def hist_color_img(img):
    histr = []
    histr.append(cv2.calcHist([img], [0], None, [256], [0, 256]))
    histr.append(cv2.calcHist([img], [1], None, [256], [0, 256]))
    histr.append(cv2.calcHist([img], [2], None, [256], [0, 256]))
    return histr
我们也可以创建一个 for 循环或类似的方法来调用 cv2.calcHist() 函数三次。
接下来需要调用 hist_color_img() 函数计算图像的颜色直方图:
# 加载图像
image = cv2.imread('example.png')
# 计算图像的颜色直方图
hist_color = hist_color_img(image)
# 可视化
show_img_with_matplotlib(image, "image", 1)
# 可视化颜色直方图函数
def show_hist_with_matplotlib_rgb(hist, title, pos, color):
    ax = plt.subplot(2, 3, pos)
    plt.xlabel("bins")
    plt.ylabel("number of pixels")
    plt.xlim([0, 256])
    for (h, c) in zip(hist, color):
        plt.plot(h, color=c)
show_hist_with_matplotlib_rgb(hist_color, "color histogram", 4, ['b', 'g', 'r'])
同样,使用 cv2.add() 和 cv2.subtract() 来修改加载的 BGR 图像的亮度(原始 BGR 图像的每个像素值添加/减去 10),并查看直方图的变化情况:
M = np.ones(image.shape, dtype="uint8") * 10
# 原始 BGR 图像的每个像素值添加 10
added_image = cv2.add(image, M)
hist_color_added_image = hist_color_img(added_image)

# 原始 BGR 图像的每个像素值减去 10
subtracted_image = cv2.subtract(image, M)
hist_color_subtracted_image = hist_color_img(subtracted_image)

# 可视化
show_img_with_matplotlib(added_image, "image lighter", 2)
show_hist_with_matplotlib_rgb(hist_color_added_image, "color histogram", 5, ['b', 'g', 'r'])
show_img_with_matplotlib(subtracted_image, "image darker", 3)
show_hist_with_matplotlib_rgb(hist_color_subtracted_image, "color histogram", 6, ['b', 'g', 'r'])
4. 直方图的自定义可视化
为了可视化直方图,我们调用了 plt.plot() 函数,这是由于没有 OpenCV 函数可以用来直接绘制直方图。因此,如果我们想要使用 OpenCV 绘制直方图,必须利用 OpenCV 原语(例如 cv2.polylines() 和 cv2.rectangle() 等)来绘制直方图。
我们创建实现此功能的 plot_hist() 函数,此函数创建一个 BGR 彩色图像,并在其中绘制直方图。该函数的代码如下:
def plot_hist(hist_items, color):
    # 出于可视化目的,我们添加了一些偏移
    offset_down = 10
    offset_up = 10
    # 这将用于创建要可视化的点(x坐标)
    x_values = np.arange(256).reshape(256, 1)
    # 创建画布
    canvas = np.ones((300, 256, 3), dtype='uint8') * 256

    for hist_item, col in zip(hist_items, color):
        # 在适当的可视化范围内进行规范化
        cv2.normalize(hist_item, hist_item, 0 + offset_down, 300 - offset_up, cv2.NORM_MINMAX)
        # 将值强制转换为int
        around = np.around(hist_item)
        # 数据类型转换
        hist = np.int32(around)
        # 使用直方图和x坐标创建点
        pts = np.column_stack((x_values, hist))
        # 绘制点
        cv2.polylines(canvas, [pts], False, col, 2)
        # 绘制一个矩形
        cv2.rectangle(canvas, (0, 0), (255, 298), (0, 0, 0), 1)

    # 沿上/下方向翻转图像
    res = np.flipud(canvas)
    return res
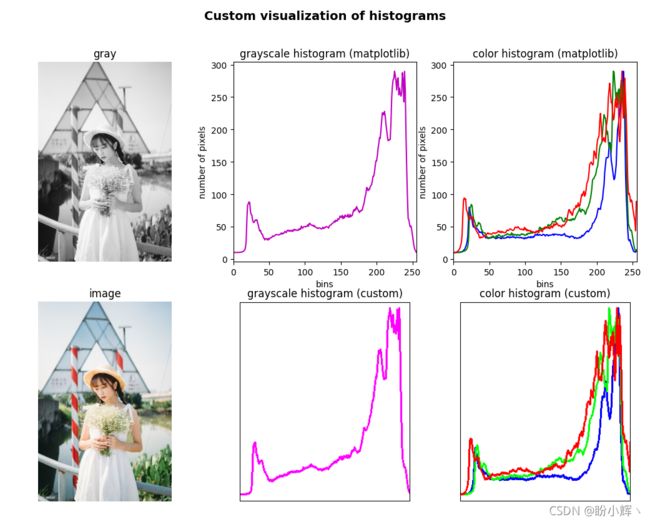
此函数接收直方图并为直方图的每个元素构建 (x, y) 点 pts,其中 y 值表示直方图 x 元素的频率。这些点 pts 是通过使用 cv2.polylines() 函数绘制的,该函数根据 pts 数组绘制曲线。最后,图像需要垂直翻转,因为 y 值颠倒了。最后使用 plt.plot() 和自定义函数的直方图绘制函数进行比较:
# 读取图像
image = cv2.imread('example.png')
gray_image = cv2.cvtColor(image, cv2.COLOR_BGR2GRAY)

# 使用 plt.plot() 绘制的灰度直方图
hist = cv2.calcHist([gray_image], [0], None, [256], [0, 256])

# 使用 plt.plot() 绘制的颜色直方图
hist_color = hist_color_img(image)

# 自定义灰度直方图
gray_plot = plot_hist([hist], [(255, 0, 255)])

# 自定义颜色直方图
color_plot = plot_hist(hist_color, [(255, 0, 0), (0, 255, 0), (0, 0, 255)])

# 可视化
show_img_with_matplotlib(cv2.cvtColor(gray_image, cv2.COLOR_GRAY2BGR), "gray", 1)
show_img_with_matplotlib(image, "image", 4)
show_hist_with_matplotlib_gray(hist, "grayscale histogram (matplotlib)", 2, 'm')
show_hist_with_matplotlib_rgb(hist_color, "color histogram (matplotlib)", 3, ['b', 'g', 'r'])
show_img_with_matplotlib(gray_plot, "grayscale histogram (custom)", 5)
show_img_with_matplotlib(color_plot, "color histogram (custom)", 6)
小结
图像直方图是一种反映图像色调分布的直方图,绘制每个色调值的像素数。我们可以使用 cv2.calcHist() 函数来计算一个或多个数组的直方图,将其应用于单通道图像和多通道图像。
相关链接
OpenCV-Python实战(1)——OpenCV简介与图像处理基础(内含大量示例,建议收藏)
OpenCV-Python实战(2)——图像与视频文件的处理(两万字详解,️建议收藏)
OpenCV-Python实战(3)——OpenCV中绘制图形与文本(万字总结,️建议收藏)
OpenCV-Python实战(4)——OpenCV常见图像处理技术(❤️万字长文,含大量示例❤️)
OpenCV-Python实战(5)——OpenCV图像运算(❤️万字长文,含大量示例❤️)
OpenCV-Python实战(6)——OpenCV中的色彩空间和色彩映射(❤️含大量实例,建议收藏❤️)
