特征工程及主成分分析(PCA)-基于opencv和python的学习笔记(十五)
版权声明:本文为博主原创文章,未经博主允许不得转载。https://blog.csdn.net/weixin_44474718/article/details/86723011
-
特征标准化:是把数据缩放到拥有零均值和单位方差的过程。
-
特征归一化:是缩放单个样本已使它们拥有单位范数的过程。范数表示的是一个向量的长度。包括:L1范数(曼哈顿距离)L2范数(欧氏距离)
-
特征二值化:对准确特征值不关心,仅仅想知道一个特征是否存在。
一、特征降维:主成分分析(PCA)
PCA所做的就是旋转所有的数据点直到它们分布到可以解释大部分数据分布的两个坐标系中。
import numpy as np
import matplotlib.pyplot as plt
import cv2
from sklearn import decomposition

mean = [20, 20]                                           #均值
cov = [[5 ,0], [25, 25]]                                  #协方差矩阵
x, y = np.random.multivariate_normal(mean,cov,1000).T

plt.style.use('ggplot')
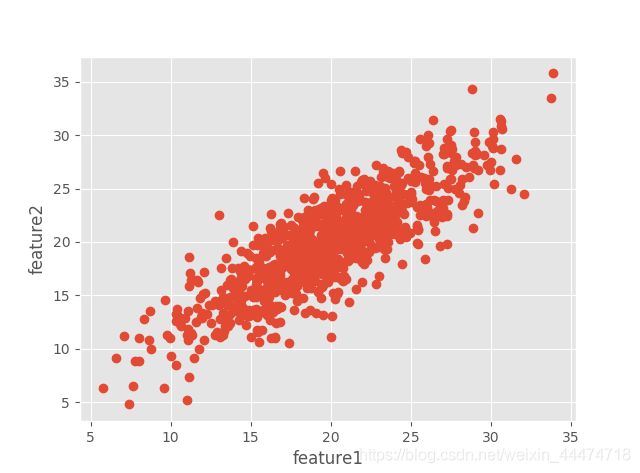
plt.plot(x,y,'o',zorder=1)
plt.xlabel('feature1')
plt.ylabel('feature2')
plt.show()                                 # 原始图像
X= np.vstack((x,y)).T                     #把特征向量x和y组合成一个特征矩阵X
mu,eig= cv2.PCACompute(X, np.array([]))   #在特征X上计算PCA,指定一个空的np.array([])数组用作蒙版参数,告诉opencv使用特征矩阵上的所有数据点。
# print(eig)
# [[ 0.71956079  0.69442946]           # 返回两个值:投影前减去的平均值,和协方差矩阵的特征向量(eig)
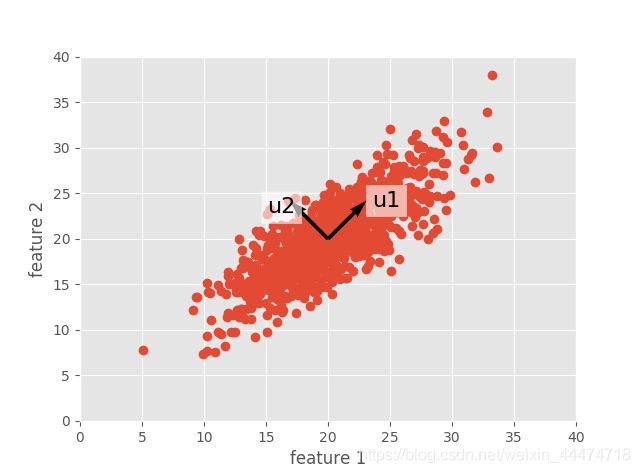
# [-0.69442946  0.71956079]]           # 这些特征向量指向PCA认为最有信息性的方向。

# 通过上面得出的特征向量,画出图与原数据分布是一致的。
plt.plot(x, y, 'o', zorder=1)
plt.quiver(mean[0], mean[1], eig[:, 0], eig[:, 1], zorder=3, scale=0.2, units='xy')
plt.text(mean[0] + 5 * eig[0, 0], mean[1] + 5 * eig[0, 1], 'u1', zorder=5,
         fontsize=16, bbox=dict(facecolor='white', alpha=0.6))
plt.text(mean[0] + 7 * eig[1, 0], mean[1] + 4 * eig[1, 1], 'u2', zorder=5,
         fontsize=16, bbox=dict(facecolor='white', alpha=0.6))
plt.axis([0, 40, 0, 40])
plt.xlabel('feature 1')
plt.ylabel('feature 2')
plt.show()

X2= cv2.PCAProject(X,mu,eig)           # 旋转数据 最大分布方向的两个坐标轴将会与xy轴对齐
plt.figure(figsize=(10, 6))
plt.plot(X2[:, 0], X2[:, 1], 'o')
plt.xlabel('first principal component')
plt.ylabel('second principal component')
plt.axis([-20, 20, -10, 10])
plt.show()

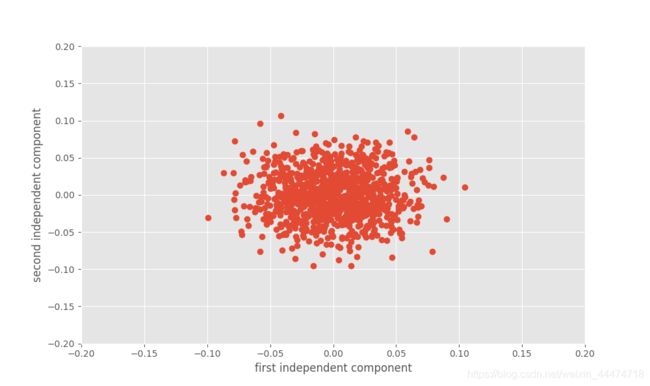
# 实现独立主成分分析      基于sklearn
ica= decomposition.FastICA()
X3= ica.fit_transform(X)
plt.figure(figsize=(10, 6))
plt.plot(X3[:, 0], X3[:, 1], 'o')
plt.xlabel('first independent component')
plt.ylabel('second independent component')
plt.axis([-0.2, 0.2, -0.2, 0.2])
plt.savefig('ica.png')
plt.show()                    # sklearn 提供的快速ICA分析

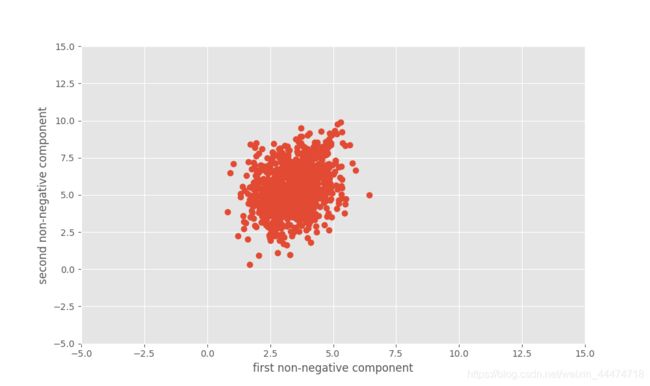
# 实现非负矩阵分解     基于sklearn
nmf = decomposition.NMF()
X4 = nmf.fit_transform(X)
plt.figure(figsize=(10, 6))
plt.plot(X4[:, 0], X4[:, 1], 'o')
plt.xlabel('first non-negative component')
plt.ylabel('second non-negative component')
plt.axis([-5, 15, -5, 15])
plt.show()


