回归模型选择(R语言版)
回归模型选择(R语言版)
选择准测:
- With Cp , AIC and BIC, smaller values are better, but for adjusted R2 , larger values are better.
- Model choice should be guided by economic theory and practical considerations, as well as by model selection criteria.
案例
Illustrate model selection with Nelson-Plosser data set of U.S. yearly macroeconomic variables from 1909 to 1970, a total of 62 years as follows:
变量说明:
# sp: Stock Prices, [Index; 1941-43=100],
# gnp.r: Real GNP,  [Billions of 1958 Dollars],
# gnp.pc: Real Per Capita GNP, [1958 Dollars],
# ip: industrial Production Index, [1967=100],
# cpi: Consumer Price Index, [1967=100],
# emp: Total Employment, [Thousands],
# bond: Basic Yields 30-year Corporate Bonds, [% pa].

# response: diff(log(sp))
# regressors: diff(gnp.r), diff(gnp.pc), diff(log(ip)), diff(log(cpi)), diff(emp), diff(bond).


# install.packages(c("fEcofin","MASS","car","lmtest"),repos= "http://cran.cnr.Berkeley.edu", dep=TRUE)
安装需要的包
rm(list=ls())
install.packages(c("MASS","car","leaps","faraway"))   # install packages
install.packages("fEcofin", repos="http://R-Forge.R-project.org")


library(fEcofin)                                      # call packages
?? fEcofin
data("nelsonplosser")                                 # load data in above packages
list(nelsonplosser)                                  # check data
names(nelsonplosser)

new_np=nelsonplosser[50:111, c(2,4,5,6,9,14,15)]
attach(new_np)
new_np
查看原数据
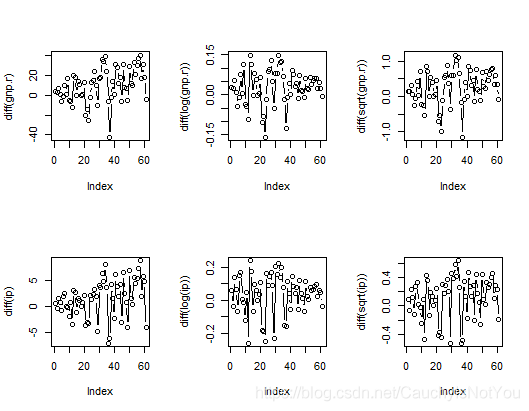
par(mfrow=c(2,3))     # 一页多图: 一个图版显示2行,3列
plot(diff(gnp.r), type="b")
plot(diff(log(gnp.r)),type="b")
plot(diff(sqrt(gnp.r)),type="b")
plot(diff(ip),type="b")  #喇叭形,用对数消去
plot(diff(log(ip)),type="b")
plot(diff(sqrt(ip)),type="b")
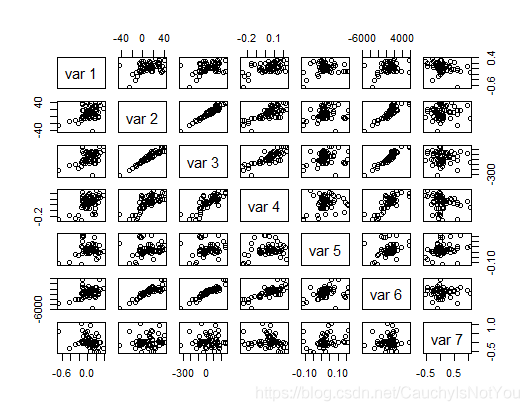
# creat a scatterplot matrix 查看变量间的关系
pairs(cbind(diff(log(sp)), diff(gnp.r), diff(gnp.pc), diff(log(ip)),
            diff(log(cpi)), diff(emp), diff(bnd)))
可以看到,var2-diff(gnp.r) 与var3-diff(gnp.pc)有很强的线性关系,变量var3-diff(gnp.pc)与变量var6-diff(emp)也有线性关系.
fit=lm(formula=diff(log(sp))~diff(gnp.r)+diff(gnp.pc)+diff(log(ip))+diff(log(cpi))+diff(emp)+diff(bnd), data=new_np )  # make linear refression
summary(fit)                  # dispay the result of fit
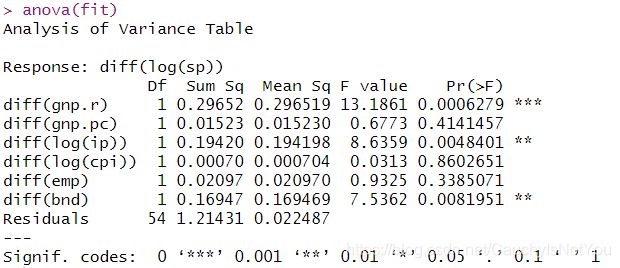
anova(fit)
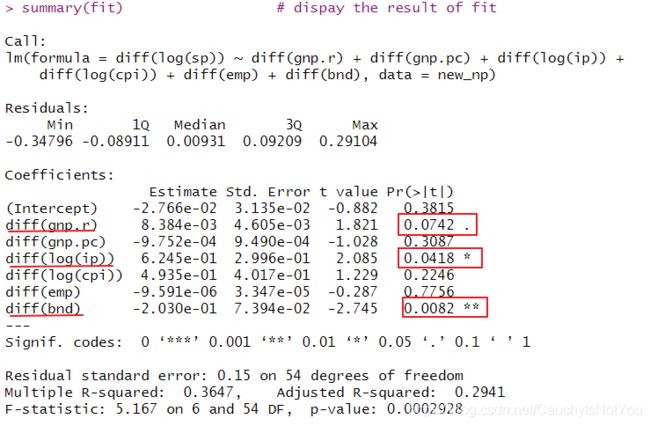
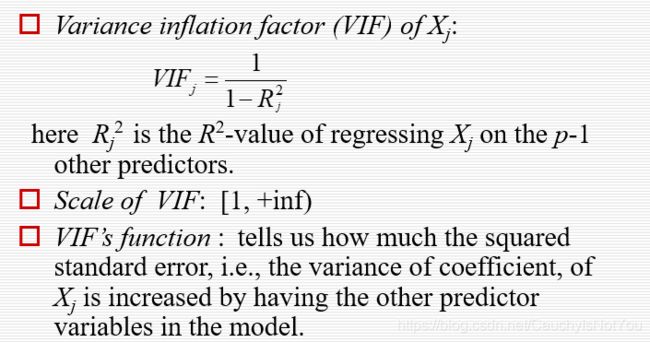
在0.1的置信水平下,只有三个参数显著. 可能存在多重共线性,看一下方差膨胀因子(VIF)吧. VIF就是检查预测变量之间的共线性的. 一般认为VIF>10,认为有共线性.
library(faraway)
vif(fit)
output:
vif(fit)
diff(gnp.r) diff(gnp.pc) diff(log(ip)) diff(log(cpi)) diff(emp)
16.030836 31.777449 3.325433 1.290405 10.948953
diff(bnd)
1.481480
结果显示,变量diff(gnp.r), 变量diff(gnp.pc), 变量diff(emp)有线性关系.
然后我们用stepAIC函数来找一个简约模型, 它是R中的变量选择过程,它首先由用户指定的模型开始,然后依次添加或删除变量。在每一步中,添加或删除的元素都能最大程度地提高AIC值。这个例子,stepAIC将从所有六个预测因子开始。
#### AIC 准则
library(MASS)
fit_AIC=stepAIC(fit)
summary(fit_AIC) #diff(gnp.r) diff(gnp.pc) diff(log(ip)) diff(bnd)


#####输出#####
Start:  AIC=-224.92
diff(log(sp)) ~ diff(gnp.r) + diff(gnp.pc) + diff(log(ip)) +
    diff(log(cpi)) + diff(emp) + diff(bnd)

                 Df Sum of Sq    RSS     AIC
- diff(emp)       1  0.001846 1.2162 -226.83
- diff(gnp.pc)    1  0.023749 1.2381 -225.74
- diff(log(cpi))  1  0.033944 1.2483 -225.24
<none>                        1.2143 -224.92
- diff(gnp.r)     1  0.074538 1.2889 -223.28
- diff(log(ip))   1  0.097736 1.3120 -222.20
- diff(bnd)       1  0.169469 1.3838 -218.95

Step:  AIC=-226.83
diff(log(sp)) ~ diff(gnp.r) + diff(gnp.pc) + diff(log(ip)) +
    diff(log(cpi)) + diff(bnd)

                 Df Sum of Sq    RSS     AIC
- diff(log(cpi))  1  0.032116 1.2483 -227.24
<none>                        1.2162 -226.83
- diff(gnp.pc)    1  0.057144 1.2733 -226.03
- diff(gnp.r)     1  0.084456 1.3006 -224.73
- diff(log(ip))   1  0.096252 1.3124 -224.18
- diff(bnd)       1  0.188593 1.4047 -220.03

Step:  AIC=-227.24
diff(log(sp)) ~ diff(gnp.r) + diff(gnp.pc) + diff(log(ip)) +
    diff(bnd)

                Df Sum of Sq    RSS     AIC
<none>                       1.2483 -227.24
- diff(gnp.pc)   1  0.046572 1.2949 -227.00
- diff(gnp.r)    1  0.069250 1.3175 -225.94
- diff(log(ip))  1  0.122309 1.3706 -223.53
- diff(bnd)      1  0.157181 1.4055 -222.00
> summary(fit_AIC) #diff(gnp.r) diff(gnp.pc) diff(log(ip)) diff(bnd)

Call:
lm(formula = diff(log(sp)) ~ diff(gnp.r) + diff(gnp.pc) + diff(log(ip)) +
    diff(bnd), data = new_np)

Residuals:
     Min       1Q   Median       3Q      Max
-0.40802 -0.08630  0.00795  0.08612  0.28259

Coefficients:
                Estimate Std. Error t value Pr(>|t|)
(Intercept)   -0.0186635  0.0287229  -0.650   0.5185
diff(gnp.r)    0.0077426  0.0043928   1.763   0.0834 .
diff(gnp.pc)  -0.0010291  0.0007119  -1.445   0.1539
diff(log(ip))  0.6729244  0.2872758   2.342   0.0227 *
diff(bnd)     -0.1774902  0.0668399  -2.655   0.0103 *
---
Signif. codes:  0 ‘***’ 0.001 ‘**’ 0.01 ‘*’ 0.05 ‘.’ 0.1 ‘ ’ 1

Residual standard error: 0.1493 on 56 degrees of freedom
Multiple R-squared:  0.3469,	Adjusted R-squared:  0.3003
F-statistic: 7.437 on 4 and 56 DF,  p-value: 7.06e-05
AIC准测下,模型保留四个参数diff(gnp.r) diff(gnp.pc) diff(log(ip)) diff(bnd).
现在,四个变量中的三个在0.1都有统计学意义,尽管diff(gnp.pc)具有相当大的p值,而且似乎值得探索其他可能的模型。
#### BIC 准则
n=length(diff(log(sp)))
fit_BIC=stepAIC(fit,k=log(n))
fit_BIC=stepAIC(fit,k=log(n),trace=F)                 # 用逐步回归法对训练数据建模
summary(fit_BIC)    #diff(log(ip)) diff(bnd)


#####输出#####
Start:  AIC=-210.14
diff(log(sp)) ~ diff(gnp.r) + diff(gnp.pc) + diff(log(ip)) +
    diff(log(cpi)) + diff(emp) + diff(bnd)

                 Df Sum of Sq    RSS     AIC
- diff(emp)       1  0.001846 1.2162 -214.16
- diff(gnp.pc)    1  0.023749 1.2381 -213.07
- diff(log(cpi))  1  0.033944 1.2483 -212.57
- diff(gnp.r)     1  0.074538 1.2889 -210.62
<none>                        1.2143 -210.14
- diff(log(ip))   1  0.097736 1.3120 -209.53
- diff(bnd)       1  0.169469 1.3838 -206.28

Step:  AIC=-214.16
diff(log(sp)) ~ diff(gnp.r) + diff(gnp.pc) + diff(log(ip)) +
    diff(log(cpi)) + diff(bnd)

                 Df Sum of Sq    RSS     AIC
- diff(log(cpi))  1  0.032116 1.2483 -216.68
- diff(gnp.pc)    1  0.057144 1.2733 -215.47
- diff(gnp.r)     1  0.084456 1.3006 -214.18
<none>                        1.2162 -214.16
- diff(log(ip))   1  0.096252 1.3124 -213.62
- diff(bnd)       1  0.188593 1.4047 -209.48

Step:  AIC=-216.68
diff(log(sp)) ~ diff(gnp.r) + diff(gnp.pc) + diff(log(ip)) +
    diff(bnd)

                Df Sum of Sq    RSS     AIC
- diff(gnp.pc)   1  0.046572 1.2949 -218.56
- diff(gnp.r)    1  0.069250 1.3175 -217.50
<none>                       1.2483 -216.68
- diff(log(ip))  1  0.122309 1.3706 -215.09
- diff(bnd)      1  0.157181 1.4055 -213.56

Step:  AIC=-218.56
diff(log(sp)) ~ diff(gnp.r) + diff(log(ip)) + diff(bnd)

                Df Sum of Sq    RSS     AIC
- diff(gnp.r)    1  0.026578 1.3214 -221.43
- diff(log(ip))  1  0.079892 1.3747 -219.02
<none>                       1.2949 -218.56
- diff(bnd)      1  0.126709 1.4216 -216.97

Step:  AIC=-221.43
diff(log(sp)) ~ diff(log(ip)) + diff(bnd)

                Df Sum of Sq    RSS     AIC
<none>                       1.3214 -221.43
- diff(bnd)      1   0.10281 1.4242 -220.97
- diff(log(ip))  1   0.39112 1.7126 -209.72
> #fit_BIC=stepAIC(fit,k=log(n),trace=F)                 # 用逐步回归法对训练数据建模
> summary(fit_BIC)    #diff(log(ip)) diff(bnd)

Call:
lm(formula = diff(log(sp)) ~ diff(log(ip)) + diff(bnd), data = new_np)

Residuals:
     Min       1Q   Median       3Q      Max
-0.44254 -0.09786  0.00377  0.10525  0.28136

Coefficients:
              Estimate Std. Error t value Pr(>|t|)
(Intercept)    0.01657    0.02100   0.789 0.433316
diff(log(ip))  0.69748    0.16834   4.143 0.000113 ***
diff(bnd)     -0.13224    0.06225  -2.124 0.037920 *
---
Signif. codes:  0 ‘***’ 0.001 ‘**’ 0.01 ‘*’ 0.05 ‘.’ 0.1 ‘ ’ 1

Residual standard error: 0.1509 on 58 degrees of freedom
Multiple R-squared:  0.3087,	Adjusted R-squared:  0.2848
F-statistic: 12.95 on 2 and 58 DF,  p-value: 2.244e-05
BIC准则下保留了两个参数diff(log(ip)) diff(bnd),在0.05下都显著.
model.matrix 设计矩阵,实际上就是矩阵形式表示的最小二乘回归的系数矩阵. 可参考设计矩阵
#### Cp 准则
library(leaps)
x=model.matrix(diff(log(sp))~diff(gnp.r)+diff(gnp.pc)+diff(log(ip))+diff(log(cpi))+diff(emp)+diff(bnd), data=new_np)[,-1]
x
le=leaps(x,diff(log(sp)), method="Cp", nbest=1 )
le
par(mfrow=c(1,2))
plot(le$size-1,le$Cp,type="b")

cbind(le$which, le$Cp)
le$which[le$Cp==min(le$Cp)]

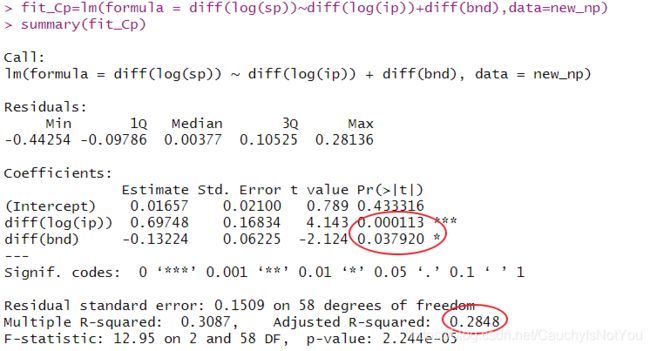
fit_Cp=lm(formula = diff(log(sp))~diff(log(ip))+diff(bnd),data=new_np)
summary(fit_Cp)
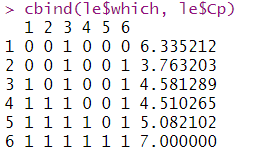
可以看出,Cp值最小时,是选择第三个变量diff(log(ip))和第六个变量diff(bnd).模拟之后的线性模型结果如下:
#### adjr2 准则
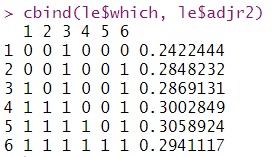
le=leaps(x,diff(log(sp)), method="adjr2", nbest=1)
plot(le$size-1,le$adjr2,type="b")
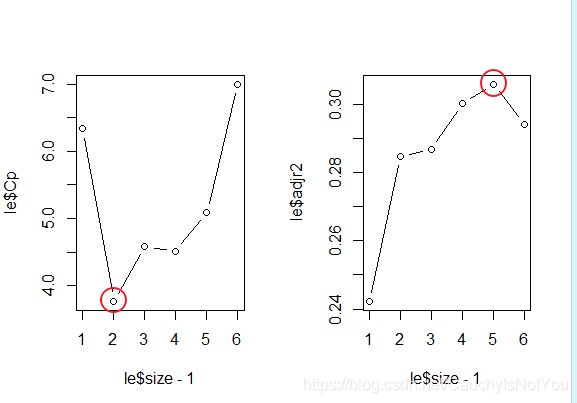
在调整R2准则下,需要保留五个变量. 由下图可知, 不要第5个变量diff(emp)时,调整R2最大.
leaps函数
leaps(x=, y=, wt=rep(1, NROW(x)), int=TRUE, method=c("Cp", "adjr2", "r2"), nbest=10, names=NULL, df=NROW(x), strictly.compatible=TRUE)
leaps() performs an exhaustive search for the best subsets of the variables in x for predicting y in linear regression, using an efficient branch-and-bound algorithm. It is a compatibility wrapper for regsubsets does the same thing better.
Since the algorithm returns a best model of each size, the results do not depend on a penalty model for model size: it doesn’t make any difference whether you want to use AIC, BIC, CIC, DIC, …
参数
x: A matrix of predictors
y: A response vector
method: Calculate Cp, adjusted R-squared or R-squared
输出
Value
A list with components
which logical matrix. Each row can be used to select the columns of x in the respective model
size Number of variables, including intercept if any, in the model
Cp or adjr2 or r2 is the value of the chosen model selection statistic for each model
label vector of names for the columns of x
regsubsets函数
真子集回归
#######Supplement:
rm(list=ls())
library(fEcofin)
data("nelsonplosser")
new_np=nelsonplosser[50:111, c(2,4,5,6,9,14,15)]
attach(new_np)
new_np

library(leaps)
?? regsubsets #模型选择函数,参数x可以是design matrix or model formula for full model, or biglm object
a=regsubsets( cbind( diff(gnp.r), diff(gnp.pc), diff(log(ip)), diff(log(cpi)), diff(emp), diff(bnd) ), diff(log(sp)) )
summary(a)
reg.summary = summary(a)
par(mfrow=c(1,3))
plot(reg.summary$adjr2, xlab="Number of Variables", ylab="Adjusted RSq ", type ="l")
which.max(reg.summary$adjr2)                                # 5
points(5, reg.summary$adjr2[5] , col="red", cex=2, pch=20)  # puts points on a plot that has already been created

plot(reg.summary$cp , xlab ="Number of Variables", ylab ="Cp", type ="l")
which.min(reg.summary$cp)                                   # 2
points(2, reg.summary$cp[2], col="red", cex=2, pch=20)

plot(reg.summary$bic ,xlab ="Number of Variables",ylab ="BIC",type ="l")
which.min(reg.summary$bic)                                 # 2
points(2, reg.summary$bic[2], col ="red", cex=2, pch=20)
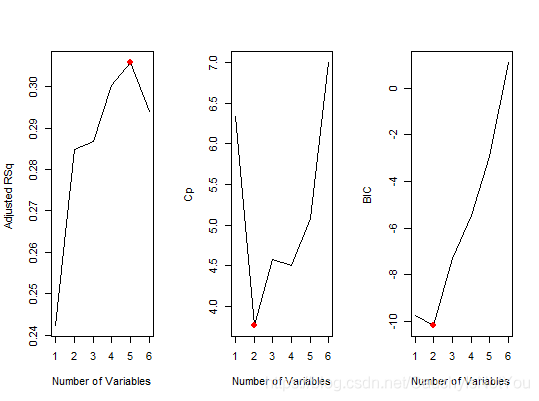
由图可知,调整R2标准下,5个变量. Cp和BIC标准下保留两个变量. 具体见下图
cbind(reg.summary$which,reg.summary$adjr2)
cbind(reg.summary$which,reg.summary$cp)
cbind(reg.summary$which,reg.summary$bic)

若regsubsets 函数,参数x是 model formula for full model
把六个变量都放到模型中,进行真子集回归. 注意AIC,BIC,Cp都是越小越好,adR2是越大越好. 图形,一行一行看
a0=regsubsets(diff(log(sp))~diff(gnp.r)+diff(gnp.pc)+diff(log(ip))+diff(log(cpi))
              +diff(emp)+diff(bnd),nbest=1, data=new_np)
par(mfrow=c(1,3))
plot(a0,scale="bic")
plot(a0,scale="Cp")
plot(a0,scale="adjr2")
#图形解释
一行一行看, 会发现含变量diff(log(ip)), diff(bnd)时, bic小为-10, Cp最小为3.8
除了不含变量diff(emp), 包含其他五个变量的模型, 调整R2最大为0.31.
这与前面的用函数leaps得到的结论是一致的.

注意: 大部分情况中, 全子集回归要优于逐步回归, 因为考虑了更多模型. 但是, 当有大量预测变量时, 全子集回归会很慢. 一般来说, 变量自动选择应该被看做是对模型选择的一种辅助方法, 而不是直接方法. 拟合效果佳而没有意义的模型对你毫无帮助, 主题背景知识的理解才能最终指引你获得理想的模型.
参考文献:
[1] Ruppert, David. Statistics and Data Analysis for Financial Engineering[M]. Springer, 2010.
[2] R语言实战: 第2版/(美)卡巴科弗(Kabacoff,R.I.)著; 王小宁等译. 一2版.一北京: 人民邮电出版社, 2016.5.

