Python画图——matplotlib(普通折线图)
matplotlib画图
(1)单折线图
from matplotlib import pyplot as plt #as就是重新命名的意思
from matplotlib.font_manager import FontProperties #导入中文字体
font = FontProperties(fname=r"/usr/share/fonts/opentype/noto/NotoSansCJK-Regular.ttc")

x = range(2, 26, 2)
y = [15,13,13.5,14,17,21,24,22,20,19,17,15]
plt.figure(figsize=(10,8),dpi=80,facecolor='w') #设置图片的尺寸和外框颜色 w白色

#绘制图片
plt.plot(x,y)

xlabels = ["{}时".format(i) for i in range(2, 26, 2)] #修改x轴的刻度
plt.xticks(x, xlabels,fontproperties=font)
plt.yticks(range(min(y),max(y)+1)) # 修改y轴刻度

#为x y 轴和图形添加标题信息
plt.title("标题", fontproperties=font)
plt.xlabel("x轴标签", fontproperties=font)
plt.ylabel("y轴标签", fontproperties=font)
plt.show()
plt.savefig('./temp.png')
plt.show()
(2) 多折线图
#!/usr/bin/env python3
# -*- coding: utf-8 -*-

from matplotlib import pyplot as plt
from matplotlib.font_manager import FontProperties  #字体库

font = FontProperties(fname=r"/usr/share/fonts/opentype/noto/NotoSansCJK-Regular.ttc")

y_1 = [1,0,1,1,2,4,3,2,4,4,5,6,5,4,3,3,1,1,1,1]
y_2 = [1,0,3,1,2,2,2,3,1,1,1,1,2,1,1,2,3,2,2,2]
x_1 = range(11,31)
x_2 = range(11,31)

# 设置图像的大小
plt.figure(figsize=(15,9),dpi=80) #图片大小 像素

# 设置图中图例内容和位置
plt.plot(x_1,y_1,label = '自己',color='r', linestyle='-.')
plt.plot(x_2,y_2,label = '同桌', color='b',linestyle='--')
plt.legend(prop=font,loc='upper left') #upper/lower left/right

# 设置x轴的刻度
_x_1 = list(x_1)
_xticks_label = ["{}岁".format(i) for i in x_1]
plt.xticks(_x_1,_xticks_label,fontproperties=font)
plt.grid(alpha = 0.2) # 添加网格 调整透明度alpha = 0.2

# 坐标轴上面的描述信息
plt.xlabel('岁数',fontproperties=font)
plt.ylabel('个数',fontproperties=font) # y轴的标题
plt.title("11-31岁的男女朋友的个数",fontproperties=font) # 顶部的标题

plt.show() #展示图像,如果是pycharm中,没有这句话可能就不能够显示图像

'''
在plot中进行添加
color = 'r'  线条颜色
linestyle = '--'  线条风格  -:实线 --:虚线 -.:点划线 默认是实现
linewidth = 5   线条粗细 单位像素
alpha = 0.5  透明度
'''
(3)散点图
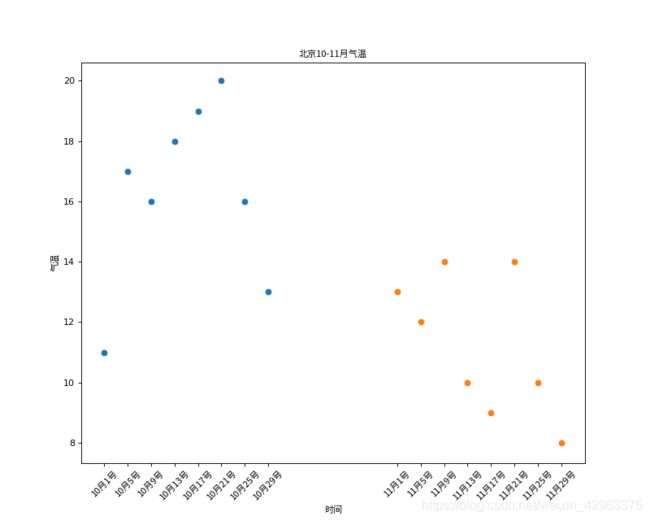
用于统计北京10-11月的气温,这里采用了分开的画法,如果只是简单的散点图,可以在里面删除部分内容

#!/usr/bin/env python3
# -*- coding: utf-8 -*-
from matplotlib import pyplot as plt
from matplotlib.font_manager import FontProperties
font=FontProperties(fname=r"/usr/share/fonts/opentype/noto/NotoSansCJK-Regular.ttc")
y_a= [11,17,16,18,19,20,16,13]

y_b= [13,12,14,10,9,14,10,8]
x_a = range(1,32,4)
x_b = range(51,82,4)
_xticks_a=["10月{}号".format(i) for i in x_a]
_xticks_b=["11月{}号".format(i-50) for i in x_b]

# 设置图片大小
plt.figure(figsize=(10,8),dpi=80)

# 画散点图
plt.scatter(x_a, y_a)
plt.scatter(x_b, y_b)

# x轴刻度
_xticks = _xticks_a + _xticks_b
_x = list(x_a) + list(x_b)
plt.xticks(_x,_xticks,fontproperties=font,rotation=45) # rotation:旋转显示x轴文字信息

plt.show()
(4) 画条形图
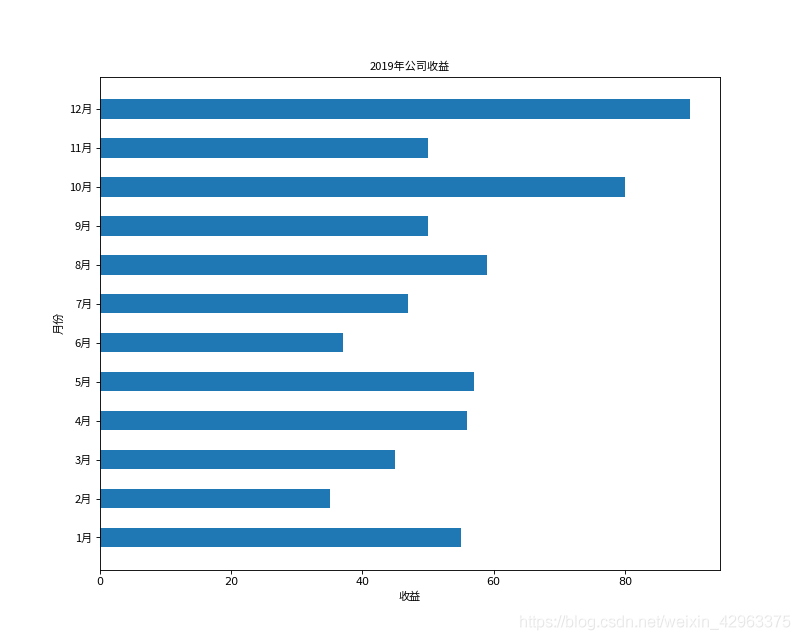
获取到1-12月,公司的营业额
x=[‘1月’, ‘2月’, ‘3月’, ‘4月’, ‘5月’, ‘6月’, ‘7月’, ‘8月’, ‘9月’, ‘10月’, ‘11月’, ‘12月’]
y=[55, 35, 45, 56, 57, 37, 47, 59, 50, 80, 50, 90, 100]
第一种:竖着画图
#!/usr/bin/env python3
# -*- coding: utf-8 -*-

from matplotlib import pyplot as plt
from matplotlib.font_manager import FontProperties
font=FontProperties(fname=r"/usr/share/fonts/opentype/noto/NotoSansCJK-Regular.ttc")

x = ['1月', '2月', '3月', '4月', '5月', '6月',
     '7月', '8月', '9月', '10月', '11月', '12月']
y = [55, 35, 45, 56, 57, 37, 47, 59, 50, 80, 50, 90]

# 设置图片大小
plt.figure(figsize=(10,8),dpi=80)

# 画条形图
plt.barh(range(len(x)),y, height=0.5)
# height: 条形图的宽度

# 修改x轴刻度
plt.yticks(range(len(x)),x,FontProperties = font)
plt.xlabel('收益',fontproperties=font)
plt.ylabel('月份',fontproperties=font)
plt.title("2019年公司收益",fontproperties=font)

plt.show()
第二种:横条形图
#!/usr/bin/env python3
# -*- coding: utf-8 -*-

from matplotlib import pyplot as plt
from matplotlib.font_manager import FontProperties
font=FontProperties(fname=r"/usr/share/fonts/opentype/noto/NotoSansCJK-Regular.ttc")

x = ['1月', '2月', '3月', '4月', '5月', '6月',
      '7月', '8月', '9月', '10月', '11月', '12月']
y = [55, 35, 45, 56, 57, 37, 47, 59, 50, 80, 50, 90]

# 设置图片大小
plt.figure(figsize=(10,8),dpi=80)

# 画条形图
plt.bar(range(len(x)),y, width=0.8, bottom=40)
# width:条形图宽度
# bottom y的最小值从什么时候开始

# 修改x轴刻度
plt.xticks(range(len(x)),x,FontProperties = font)

plt.xlabel('月份',fontproperties=font)
plt.ylabel('收益',fontproperties=font)
plt.title("2019年公司收益",fontproperties=font)

plt.show()
(5) 画直方图
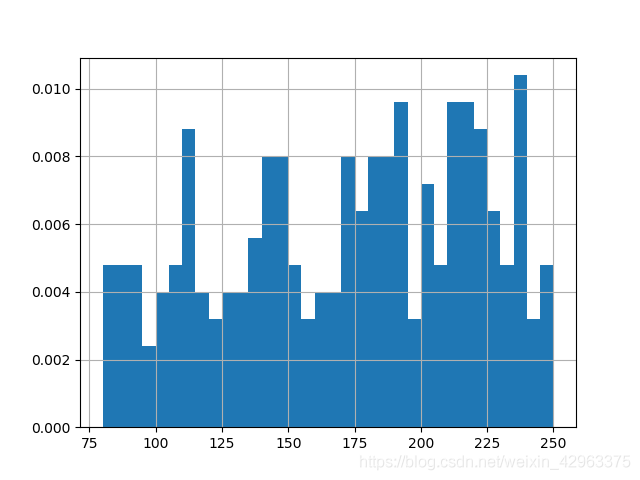
采用random库生成250个随机数,统计随机数的分布情况
x = [random.randint(80,250) for i in range(0,250)]
#!/usr/bin/env python3
# -*- coding: utf-8 -*-
import random
from matplotlib import pyplot as plt
from matplotlib.font_manager import FontProperties

font=FontProperties(fname=r"/usr/share/fonts/opentype/noto/NotoSansCJK-Regular.ttc")

# x = [random.randint(80,250) for i in range(0,250)]
x = [156, 224, 165, 90, 125, 200, 183, 114, 219, 141, 123, 200, 123, 166, 226, 129, 165, 162, 140, 211, 135, 154, 141, 213, 212, 89, 99, 236, 137, 235, 243, 221, 184, 207, 82, 89, 93, 226, 189, 129, 176, 110, 144, 221, 232, 220, 231, 91, 146, 119, 174, 177, 96, 87, 236, 172, 139, 140, 233, 195, 155, 193, 193, 237, 80, 149, 89, 183, 245, 152, 171, 205, 205, 216, 142, 230, 116, 200, 94, 130, 203, 202, 218, 162, 170, 114, 187, 211, 194, 85, 208, 188, 109, 134, 212, 174, 173, 106, 131, 112, 159, 228, 212, 88, 226, 141, 149, 178, 224, 243, 145, 235, 237, 166, 184, 173, 190, 237, 105, 213, 142, 110, 229, 121, 146, 183, 215, 153, 94, 235, 228, 186, 197, 138, 244, 215, 124, 118, 238, 177, 150, 222, 148, 155, 184, 192, 133, 239, 250, 193, 138, 181, 184, 189, 140, 176, 108, 161, 234, 179, 200, 187, 166, 219, 192, 225, 188, 101, 180, 211, 218, 173, 178, 216, 83, 197, 98, 154, 112, 191, 201, 218, 110, 172, 195, 185, 147, 203, 238, 149, 241, 211, 248, 153, 214, 113, 142, 223, 149, 135, 218, 208, 80, 247, 230, 235, 215, 146, 106, 139, 110, 220, 128, 103, 238, 161, 162, 111, 190, 248, 170, 127, 100, 112, 223, 217, 193, 193, 184, 213, 203, 223, 188, 179, 103, 189, 223, 81, 131, 226, 213, 248, 84, 194, 115, 91, 118, 105, 207, 101]


d = 5
num_bins = (max(x) - min(x))//d  # 得到整数

plt.hist(x,num_bins,density=True)
# 参数1:数据
# 参数2:组数
# normed: 直方图每一柱子的比例

plt.grid()
plt.show()


