pca 主成分分析
TL;DR: PCA cannot handle categorical variables because it makes linear assumptions about them. Nonlinear PCA addresses this issue by warping the feature space to optimize explained variance. (Key points at bottom.)
TL; DR: PCA无法处理分类变量,因为它对它们进行了线性假设。 非线性PCA通过扭曲特征空间以优化解释的方差来解决此问题。 (关键点在底部。)
Principal Component Analysis (PCA) has been one of the most powerful unsupervised learning techniques in machine learning. Given multi-dimensional data, PCA will find a reduced number of n uncorrelated (orthogonal) dimensions, attempting to retain as much variance in the original dataset as possible. It does this by constructing new features (principle components) as linear combinations of existing columns.
主成分分析(PCA)是机器学习中最强大的无监督学习技术之一。 给定多维数据,PCA将发现数量减少的n个不相关(正交)维,尝试在原始数据集中保留尽可能多的方差。 它通过将新功能(原理组件)构造为现有列的线性组合来实现。
However, PCA cannot handle nominal — categorical, like state — or ordinal — categorical and sequential, like letter grades (A+, B-, C, …) — columns. This is because a metric like variance, which PCA explicitly attempts to model, is an inherently numerical measure. If one were to use PCA on data with nominal and ordinal columns, it would end up making silly assumptions like ‘California is one-half New Jersey’ or ‘A+ minus four equals D’, since it must make those kinds of relationships to operate.
但是,PCA无法处理名义(类别,如状态)或排序(类别和顺序),如字母等级(A +,B-,C等)的列。 这是因为PCA明确尝试建模的类似方差的度量标准是固有的数字度量。 如果要在具有标称和序数列的数据上使用PCA,最终将做出愚蠢的假设,例如“加利福尼亚州是新泽西州的一半”或“ A +减去四等于D”,因为它必须使这种关系起作用。
Rephrased in relation to a mathematical perspective, PCA relies on linear relationships, that is, the assumption that the distance between “strongly disagree” and “disagree” is the same as the difference from “disagree” to “neutral”. In almost every real-world dataset, these sorts of linear relationships do not exist for all columns.
从数学角度重新描述,PCA依赖于线性关系,即“强烈不同意”和“不同意”之间的距离与“不同意”到“中立”的差异相同的假设。 在几乎每个现实世界的数据集中,并非所有列都存在此类线性关系。
Additionally, using one-hot encoding — that is, converting categorical data into vectors of ones and zeroes — results in an extremely sparse and information-parched multidimensional space that PCA cannot perform well on, since several features contain only two unique values.
此外,使用一键编码(即将分类数据转换为一和零的向量)会导致PCA无法很好地执行的极为稀疏且信息匮乏的多维空间,因为多个功能仅包含两个唯一值。
Nonlinear PCA rectifies this aspect of PCA by generalizing methods to approach dimensionality reduction not only for numerical features, but for categorical and ordinal variables. This is done through categorical quantification.
非线性PCA通过泛化方法来修正PCA的这一方面,不仅针对数字特征,而且针对分类和有序变量也都采用降维方法。 这是通过分类量化完成的。
Categorical quantification (CQ) is exactly what its name suggests: it attaches a numerical representation to each category, converting categorical columns into numerical ones, such that the performance of the PCA model (like explained variance) is maximized. CQ optimally places categories on a numerical dimension instead of making assumptions about them.
分类量化(CQ)正是其名称的含义:它将数字表示形式附加到每个类别,将分类列转换为数字列,从而使PCA模型的性能(如解释的方差)最大化。 CQ最佳地将类别放在数字维度上,而不是对其进行假设。
This information can be very enriching. For instance, we might be able to say that Washington and Idaho have very similar structures in other parts of the data because they are placed so closely, or that California and Virginia are nowhere similar because they are placed far apart. In this sense, CQ is not only enriching the PCA model with categorical data but also giving us a look into the structures of the data by state.
这些信息可以非常丰富。 例如,我们也许可以说,华盛顿和爱达荷州在数据的其他部分具有非常相似的结构,因为它们放置得太近了;或者,加利福尼亚和弗吉尼亚州的相似之处在于它们的位置很远。 从这个意义上讲,CQ不仅用分类数据丰富了PCA模型,而且使我们可以按状态查看数据的结构。
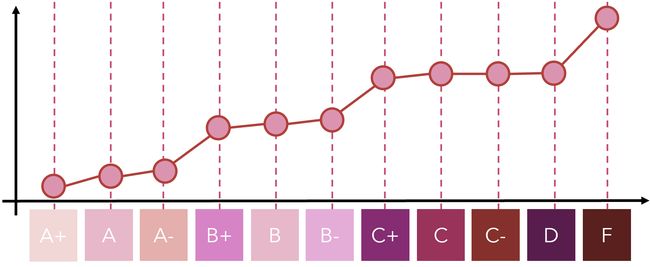
An alternative view of CQ is through a line plot. Although in the case of nominal data, the order of columns is arbitrary and there do not need to be connecting lines, it is visualized in this way to demonstrate the nominal level of analysis. If a feature’s level is specified as nominal, it can take on any numerical value.
CQ的替代视图是通过折线图。 尽管在名义数据的情况下,列的顺序是任意的,并且不需要连接线,但可以通过这种方式将其可视化以展示名义分析水平。 如果将特征级别指定为标称值,则它可以采用任何数值。
On the other hand, if a feature level is specified as ordinal, the restriction is that the order must be preserved. For instance, the relation between ‘A’ and ‘B’ in that ‘A’ is better than ‘B’ must be kept, which can be represented with A=0 and B=5 (assuming 0 is the best) or A=25 and B=26, as long as B is never less than A. This helps retain the structure of ordinal data.
另一方面,如果将要素级别指定为序数,则限制是必须保留顺序。 例如,必须保持“ A”与“ B”之间的关系,因为“ A”优于“ B”,可以用A=0和B=5 (假设0为最佳)或A=25和B=26 ,只要B永远不小于A。这有助于保留序数数据的结构。
Like CQ for nominal data, this is tremendously insightful. For instance, we notice that within pluses and minuses of letter grades (A+, A, A-), there is not much difference, but the difference between X- and Y+ (X and Y being sequential letters) always leads to a large jump, particularly the difference between D and F. To reiterate the point above — this chart is generated by finding optimal values for categories such that the PCA model performs best (explained variance is highest).
就像名义数据的CQ一样,这是非常有见地的。 例如,我们注意到在字母等级(A +,A,A-)的正负之间并没有太大差异,但是X-和Y +之间的差异( X和Y是顺序字母)总是导致重申以上几点-通过查找类别的最佳值以使PCA模型表现最佳(解释方差最高)来生成此图。
Note that because CQ determines the space between data points (e.g. that the difference between A and A- is much less than that of D and F), it warps the space in which these points lie. Instead of assuming a linear relationship (A and A- are as close as D and F), CQ distorts the distances between common intervals — hence, nonlinear PCA.
请注意,由于CQ决定了数据点之间的间隔(例如,A和A-之间的差远小于D和F的差),因此它将扭曲这些点所在的空间。 CQ不会假设线性关系(A和A-与D和F接近),而是会扭曲公共间隔之间的距离,因此会扭曲非线性 PCA。
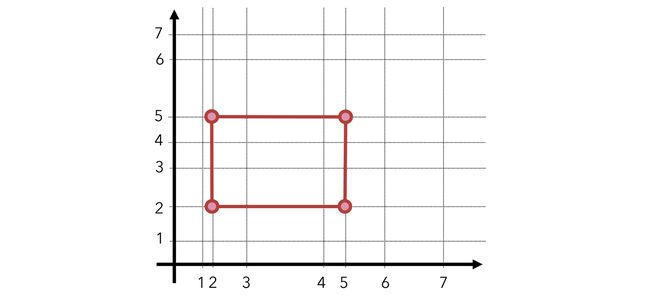
To give an idea of the nonlinearities that can arise when the distance between sequential intervals are altered, here’s a 3 by 3 square in distorted space:
为了让人们理解当顺序间隔之间的距离改变时可能出现的非线性,这里是一个3 x 3平方的扭曲空间:
By using categorical quantification, the feature space is distorted — in a good way! Intervals are selectively chosen such that the performance of PCA is maximized. Nonlinear PCA, in this sense, not only can be thought of as an encoding method for ordinal and nominal variables but also increases the global strength of the PCA model.
通过使用分类定量,可以很好地扭曲特征空间! 选择间隔以使PCA的性能最大化。 从这个意义上讲,非线性PCA不仅可以看作是序数和名义变量的编码方法,而且可以提高PCA模型的整体强度。
Although the mathematics behind Nonlinear PCA is very rich, generally speaking, NPCA uses the same methods as PCA (like eigenvalue solving, etc.), but uses CQ to derive the most information and benefit to the model.
尽管非线性PCA背后的数学非常丰富,但通常来说,NPCA使用与PCA相同的方法(例如特征值求解等),但是使用CQ来获得最多的信息并从模型中受益。
关键点 (Key Points)
- PCA cannot handle nominal (categorical) or ordinal (sequential) columns because it is an inherently numerical algorithm and makes silly linear assumptions about these types of data. PCA无法处理标称(分类)或序数(顺序)列,因为它是固有的数值算法,并且对这些类型的数据进行了愚蠢的线性假设。
- Nonlinear PCA uses categorical quantification, which finds the best numerical representation of unique column values such that the performance (explained variance) of the PCA model using the transformed columns is optimized. 非线性PCA使用分类量化,它可以找到唯一列值的最佳数值表示形式,从而可以优化使用转换列的PCA模型的性能(解释方差)。
- Categorical quantification is a very insightful data mining method, and can give lots of insight into the structures of the data through the lens of a categorical value. Unfortunately, using Nonlinear PCA means that the coefficients of principal components are less interpretable (but still understandable, just to a less statistical rigor). 分类量化是一种非常有见地的数据挖掘方法,可以通过分类价值的镜头深入了解数据的结构。 不幸的是,使用非线性PCA意味着主成分的系数难以解释(但仍然可以理解,只是对统计的严格要求较低)。
All images created by author.
作者创作的所有图像。
翻译自: https://medium.com/analytics-vidhya/beyond-ordinary-pca-nonlinear-principal-component-analysis-54a93915a702
pca 主成分分析


