【matplotlib】如何进行颜色设置选择cmap
python绘图常用的颜色图序列,可直接从下表中选择合适的颜色设置cmap
1.camp设置示例
plt.imshow(x,cmap='plasma')

# 所有的绘图函数里都包含了colormap类
# 可以使用cmap参数进行设置
# https://matplotlib.org/2.0.2/api/colors_api.html#matplotlib.colors.Colormap
# https://matplotlib.org/2.0.2/users/colormaps.html
# https://matplotlib.org/2.0.2/examples/color/colormaps_reference.html
cmaps = [('Perceptually Uniform Sequential', [
'viridis', 'plasma', 'inferno', 'magma']), # 均匀感知的颜色图:
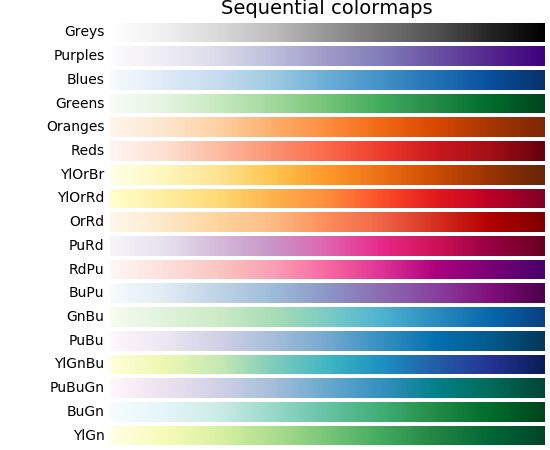
('Sequential', [
'Greys', 'Purples', 'Blues', 'Greens', 'Oranges', 'Reds',
'YlOrBr', 'YlOrRd', 'OrRd', 'PuRd', 'RdPu', 'BuPu',
'GnBu', 'PuBu', 'YlGnBu', 'PuBuGn', 'BuGn', 'YlGn']),
('Sequential (2)', [ # 颜色亮度有升有降
'binary', 'gist_yarg', 'gist_gray', 'gray', 'bone', 'pink',
'spring', 'summer', 'autumn', 'winter', 'cool', 'Wistia',
'hot', 'afmhot', 'gist_heat', 'copper']),
('Diverging', [
'PiYG', 'PRGn', 'BrBG', 'PuOr', 'RdGy', 'RdBu',
'RdYlBu', 'RdYlGn', 'Spectral', 'coolwarm', 'bwr', 'seismic']),
('Qualitative', [
'Pastel1', 'Pastel2', 'Paired', 'Accent',
'Dark2', 'Set1', 'Set2', 'Set3',
'tab10', 'tab20', 'tab20b', 'tab20c']),
('Miscellaneous', [
'flag', 'prism', 'ocean', 'gist_earth', 'terrain', 'gist_stern',
'gnuplot', 'gnuplot2', 'CMRmap', 'cubehelix', 'brg', 'hsv',
'gist_rainbow', 'rainbow', 'jet', 'nipy_spectral', 'gist_ncar'])]
# 每种颜色序列的亮度具体区别可以从这里找到:https://matplotlib.org/2.0.2/users/colormaps.html