Python计算机视觉——OpenCV
文章目录
- 第十章 OpenCV
-
- 10.1 OpenCV的Python接口
- 10.2 OpenCV基础知识
- 10.3 处理视频
- 10.4 跟踪
- 10.5 更多示例
第十章 OpenCV
本章概述如何通过Python接口使用流行的计算机视觉库OpenCV,讲解一些基本的例子并深入了解视频与跟踪。
10.1 OpenCV的Python接口
OpenCV是一个C++库,包含了计算机视觉领域的很多模块。
可以通过以下方式导入cv2模块:
import cv2
10.2 OpenCV基础知识
OpenCV自带读取、写入图像函数以及矩阵操作和数学库。
读取和写入图像
import cv2
# 读取图像
im = cv2.imread('empire.jpg')
h,w = im.shape[:2]
print(h,w)
# 保存图像
cv2.imwrite('result.png',im)
该例会载入一张图像,打印出图像大小,对图像进行转换并保存。
颜色空间
在OpenCV中,图像不是按传统的RGB颜色通道,而是按BGR顺序存储的。读取图像时默认的是BGR,但是还有一些可用的转换函数。颜色空间的转换可以用cvColor()来实现。
im = cv2.imread('empire.jpg')
# 创建灰度图像
gray = cv2.cvtColor(im,cv2.COLOR_BGR2GRAY)
此代码将原图像转换成灰度图像。
显示图像及结果
- 从文件中读取一幅图像,并创建一个整数图像表示:
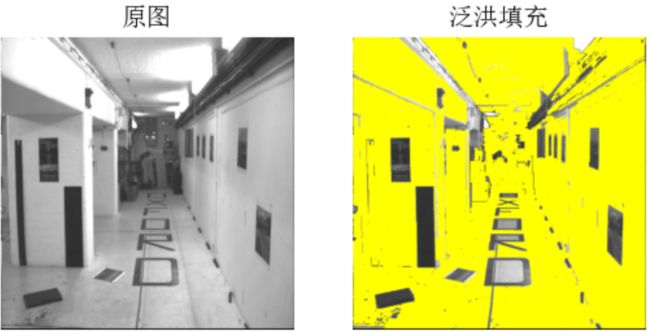
- 从一个种子像素进行泛洪填充:
# -*- coding: utf-8 -*-
import cv2
from pylab import *


# 添加中文字体支持
from matplotlib.font_manager import FontProperties
font = FontProperties(fname=r"c:\windows\fonts\SimSun.ttc", size=14)

# 读入图像
im = cv2.imread('000.pgm')
# 转换颜色空间
gray = cv2.cvtColor(im, cv2.COLOR_BGR2GRAY)

# 显示积分图像
fig = plt.figure()
subplot(121)
plt.gray()
imshow(gray)
title(u'灰度图', fontproperties=font)
axis('off')

# 计算积分图像
intim = cv2.integral(gray)
# 归一化
intim = (255.0*intim) / intim.max()

#显示积分图像
subplot(122)
plt.gray()
imshow(intim)
title(u'积分图', fontproperties=font)
axis('off')
show()
# -*- coding: utf-8 -*-
import cv2
import numpy
from pylab import *


# 添加中文字体支持
from matplotlib.font_manager import FontProperties
font = FontProperties(fname=r"c:\windows\fonts\SimSun.ttc", size=14)

# 读入图像
filename = '000.pgm'
im = cv2.imread(filename)
# 转换颜色空间
rgbIm = cv2.cvtColor(im, cv2.COLOR_BGR2RGB)

# 显示原图
fig = plt.figure()
subplot(121)
plt.gray()
imshow(rgbIm)
title(u'原图', fontproperties=font)
axis('off')

# 获取图像尺寸
h, w = im.shape[:2]
# 泛洪填充
diff = (6, 6, 6)
mask = zeros((h+2, w+2), numpy.uint8)
cv2.floodFill(im, mask, (10, 10), (255, 255, 0), diff, diff)

# 显示泛洪填充后的结果
subplot(122)
imshow(im)
title(u'泛洪填充', fontproperties=font)
axis('off')

show()
泛洪填充以种子像素为起始,只要能在阈值的差异范围内添加新的像素,泛洪填充就会持续扩展。
- SURF特征的提取,SURF 特征是 SIFT 特征的一个更快特征提取版
import cv2
# 读取图像
im = cv2.imread('empire.jpg')
# 下采样
im_lowres = cv2.pyrDown(im)
# 变换成灰度图像
gray = cv2.cvtColor(im_lowres,cv2.COLOR_RGB2GRAY)
# 检测特征点
s = cv2.SURF()
mask = uint8(ones(gray.shape))
keypoints = s.detect(gray,mask)
# 显示结果及特征点
vis = cv2.cvtColor(gray,cv2.COLOR_GRAY2BGR)
for k in keypoints[::10]:
 cv2.circle(vis,(int(k.pt[0]),int(k.pt[1])),2,(0,255,0),-1)
 cv2.circle(vis,(int(k.pt[0]),int(k.pt[1])),int(k.size),(0,255,0),2)
cv2.imshow('local descriptors',vis)
cv2.waitKey()
掩膜决定了在哪些区域应用关键点检测器,在画出检测结果时,我们将灰度图像转换成彩色图像,并用绿色通道画出检测到的关键点。我们在每到第十个关键点时循环一次,并在中心画一个圆环,每一个圆环显示出关键点的尺度(大小)。
10.3 处理视频
视频输入
OpenCV 能够很好地支持从摄像头读取视频。
import cv2
# 设置视频捕获
cap = cv2.VideoCapture(0)
while True:
 ret,im = cap.read()
 cv2.imshow('video test',im)
 key = cv2.waitKey(10)
 if key == 27:
 break
 if key == ord(' '):
 cv2.imwrite('vid_result.jpg',im)
如果按下的是 Esc 键(ASCII 码是 27)键,则退出应用;如果按下的是空格键,就保存该视频帧。
拓展上面的例子,将摄像头捕获的数据作为输入,并在 OpenCV 窗口中实时显示经
模糊的(彩色)图像:
import cv2
# 设置视频捕获
cap = cv2.VideoCapture(0)
# 获取视频帧,应用高斯平滑,显示结果
while True:
	ret,im = cap.read()
	blur = cv2.GaussianBlur(im,(0,0),5)
	cv2.imshow('camera blur',blur)
	if cv2.waitKey(10) == 27:
	break
将视频读取到NumPy数组中
使用 OpenCV 可以从一个文件读取视频帧,并将其转换成 NumPy 数组。
import cv2
# 设置视频捕获
cap = cv2.VideoCapture(0)
frames = []
# 获取帧,存储到数组中
while True:
	ret,im = cap.read()
	cv2.imshow('video',im)
	frames.append(im)
	if cv2.waitKey(10) == 27:
	break
frames = array(frames)
# 检查尺寸
print im.shape
print frames.shape
类似上面将视频数据存储在数组中对于视频处理是非常有帮助的,比如计算帧间差异以及跟踪。
10.4 跟踪
跟踪是在图像序列或视频里对其中的目标进行跟踪的过程。
光流
光流是目标、场景或摄像机在连续两帧图像间运动时造成的目标运动,是图像在平移过程中的二维矢量场。
光流法主要依赖于三个假设:
亮度恒定 图像中目标的像素强度在连续帧之间不会发生变化。
时间规律 相邻帧之间的时间足够短,以至于在考虑运行变化时可以忽略它们之间的差异。该假设用于导出下面的核心方程。
空间一致性 相邻像素具有相似的运动。
在很多情况下这些假设并不成立,但是对于相邻帧间的小运动以及短时间跳跃,它还是一个非常好的模型。
假设一个目标像素在 t 时刻亮度为 I(x,y,t),在 t+δt 时刻运动 [δx,δy] 后与 t 时刻具有相同的亮度,即 I(x,y,t)=I(x+δx, y+δy, t+δt). 对该约束用泰勒公式进行一阶展开并关于 t 求偏导可以得到光流方程:
▽ I T v = − I t ▽I^Tv=-I_t ▽ITv=−Itv=[u,v] 是运动矢量,It是时间偏导。
通过强制加入空间一致性约束,有可能获得该方程的解。
import cv2
def draw_flow(im,flow,step=16):
 """ 在间隔分开的像素采样点处绘制光流 """
	h,w = im.shape[:2]
	y,x = mgrid[step/2:h:step,step/2:w:step].reshape(2,-1)
	fx,fy = flow[y,x].T
	# 创建线的终点
	lines = vstack([x,y,x+fx,y+fy]).T.reshape(-1,2,2)
	lines = int32(lines)
	# 创建图像并绘制
	vis = cv2.cvtColor(im,cv2.COLOR_GRAY2BGR)
	for (x1,y1),(x2,y2) in lines:
		cv2.line(vis,(x1,y1),(x2,y2),(0,255,0),1)
		cv2.circle(vis,(x1,y1),1,(0,255,0), -1)
	return vis
# 设置视频捕获
cap = cv2.VideoCapture(0)
ret,im = cap.read()
prev_gray = cv2.cvtColor(im,cv2.COLOR_BGR2GRAY)
while True:
	# 获取灰度图像
	ret,im = cap.read()
	gray = cv2.cvtColor(im,cv2.COLOR_BGR2GRAY)
	# 计算流
	flow = cv2.calcOpticalFlowFarneback(prev_gray,gray,None,0.5,3,15,3,5,1.2,0)
	prev_gray = gray
	# 画出流矢量
	cv2.imshow('Optical flow',draw_flow(gray,flow))
	if cv2.waitKey(10) == 27:
	break
Lucas-Kanade算法
跟踪最基本的形式是跟随感兴趣点,比如角点。一次流行的算法是Lucas-Kanade跟踪算法,它利用了稀疏光流算法。
角点是结构张量(Harris矩阵)中有两个较大特征值的那些点,且更小的特征值要大于某个阈值。
如果基于每一个像素考虑,该光流方程组是欠定方程,即每个方程中含有很多未知变量。利用相邻像素有相同运动这一假设,对于n个相邻像素,可以将这些方程写成:
[ ∇ I T ( x 1 ) ∇ I T ( x 2 ) ⋮ ∇ I T ( x n ) ] v = [ I x ( x 1 ) I y ( x 1 ) I x ( x 2 ) I y ( x 2 ) ⋮ ⋮ I x ( x n ) I y ( x n ) ] [ u v ] = − [ I t ( x 1 ) I t ( x 2 ) ⋮ I t ( x n ) ] \left[\begin{array}{c} \nabla I^{T}\left(\mathbf{x}_{1}\right) \\ \nabla I^{T}\left(\mathbf{x}_{2}\right) \\ \vdots \\ \nabla I^{T}\left(\mathbf{x}_{n}\right) \end{array}\right] \boldsymbol{v}=\left[\begin{array}{cc} I_{x}\left(\mathbf{x}_{1}\right) & I_{y}\left(\mathbf{x}_{1}\right) \\ I_{x}\left(\mathbf{x}_{2}\right) & I_{y}\left(\mathbf{x}_{2}\right) \\ \vdots & \vdots \\ I_{x}\left(\mathbf{x}_{n}\right) & I_{y}\left(\mathbf{x}_{n}\right) \end{array}\right]\left[\begin{array}{l} \boldsymbol{u} \\ \boldsymbol{v} \end{array}\right]=-\left[\begin{array}{c} I_{t}\left(\mathbf{x}_{1}\right) \\ I_{t}\left(\mathbf{x}_{2}\right) \\ \vdots \\ I_{t}\left(\mathbf{x}_{n}\right) \end{array}\right] ⎣⎢⎢⎢⎡∇IT(x1)∇IT(x2)⋮∇IT(xn)⎦⎥⎥⎥⎤v=⎣⎢⎢⎢⎡Ix(x1)Ix(x2)⋮Ix(xn)Iy(x1)Iy(x2)⋮Iy(xn)⎦⎥⎥⎥⎤[uv]=−⎣⎢⎢⎢⎡It(x1)It(x2)⋮It(xn)⎦⎥⎥⎥⎤
该系统方程的优势是,现在方程的数目多于未知变量,并且可以用最小二乘法解出该系统方程。
可以得到以下关系:
M 1 ‾ v = − [ I t ( x 1 ) I t ( x 2 ) ⋮ I t ( x n ) ] , 或简记为 A v = b \overline{\boldsymbol{M}_{1}} \boldsymbol{v}=-\left[\begin{array}{c} I_{t}\left(\mathbf{x}_{1}\right) \\ I_{t}\left(\mathbf{x}_{2}\right) \\ \vdots \\ I_{t}\left(\mathbf{x}_{n}\right) \end{array}\right], \text { 或简记为 } \boldsymbol{A} \boldsymbol{v}=\boldsymbol{b} M1v=−⎣⎢⎢⎢⎡It(x1)It(x2)⋮It(xn)⎦⎥⎥⎥⎤, 或简记为 Av=b
该超定方程组可以用最小二乘法求解,得出运动矢量:
v = ( A T A ) − 1 A T b v=(A^TA)^{-1}A^Tb v=(ATA)−1ATb
用下面的函数建立一个Python跟踪类:
创建lktrack.py 的文件
import cv2
# 一些常数及默认参数
lk_params = dict(winSize=(15,15),maxLevel=2, criteria=(cv2.TERM_CRITERIA_EPS | cv2.TERM_CRITERIA_COUNT,10,0.03))
subpix_params = dict(zeroZone=(-1,-1),winSize=(10,10),criteria = (cv2.TERM_CRITERIA_COUNT | cv2.TERM_CRITERIA_EPS,20,0.03))
feature_params = dict(maxCorners=500,qualityLevel=0.01,minDistance=10)
class LKTracker(object):
 """ 用金字塔光流 Lucas-Kanade 跟踪类 """
def __init__(self,imnames):
	""" 使用图像名称列表初始化 """
	self.imnames = imnames
	self.features = []
	self.tracks = []
	self.current_frame = 0
利用一个变量对当前帧进行追踪,将下面代码添加到LKTracker 类中
def detect_points(self):
 """ 利用子像素精确度在当前帧中检测“利于跟踪的好的特征”( 角点 ) """
	# 载入图像并创建灰度图像
	self.image = cv2.imread(self.imnames[self.current_frame])
	self.gray = cv2.cvtColor(self.image,cv2.COLOR_BGR2GRAY)
	# 搜索好的特征点
	features = cv2.goodFeaturesToTrack(self.gray, **feature_params)
	# 提炼角点位置
	cv2.cornerSubPix(self.gray,features, **subpix_params)
	self.features = features
	self.tracks = [[p] for p in features.reshape((-1,2))]
	self.prev_gray = self.gray
找出角点运动到哪里,最后清除这些包含跟踪点的列表
def track_points(self):
	""" 跟踪检测到的特征 """
	if self.features != []:
		self.step() # 移到下一帧
		# 载入图像并创建灰度图像
		self.image = cv2.imread(self.imnames[self.current_frame])
		self.gray = cv2.cvtColor(self.image,cv2.COLOR_BGR2GRAY)
		#reshape() 操作,以适应输入格式
		tmp = float32(self.features).reshape(-1, 1, 2)
		# 计算光流
		features,status,track_error = cv2.calcOpticalFlowPyrLK(self.prev_gray,		self.gray,tmp,None,**lk_params)
		# 去除丢失的点
		self.features = [p for (st,p) in zip(status,features) if st]
		# 从丢失的点清楚跟踪轨迹
		features = array(features).reshape((-1,2))
	for i,f in enumerate(features):
		self.tracks[i].append(f)
	ndx = [i for (i,st) in enumerate(status) if not st]
	ndx.reverse()# 从后面移除
	for i in ndx:
		self.tracks.pop(i)
	self.prev_gray = self.gray
移动下一视频帧
def step(self,framenbr=None):
	""" 移到下一帧。如果没有给定参数,直接移到下一帧 """
	if framenbr is None:
		self.current_frame = (self.current_frame + 1) % len(self.imnames)
	else:
		self.current_frame = framenbr % len(self.imnames)
用OpenCV窗口和绘制函数画出最终的跟踪结果,将下面代码添加到LKTracker 类
def draw(self):
	""" 用 OpenCV 自带的画图函数画出当前图像及跟踪点,按任意键关闭窗口 """
	# 用绿色圆圈画出跟踪点
	for point in self.features:
		cv2.circle(self.image,(int(point[0][0]),int(point[0][1])),3,(0,255,0),-1)
	cv2.imshow('LKtrack',self.image)
	cv2.waitKey()
实例
- 使用跟踪器
import lktrack
imnames = ['bt.003.pgm', 'bt.002.pgm', 'bt.001.pgm', 'bt.000.pgm']
# 创建跟踪对象
lkt = lktrack.LKTracker(imnames)
# 在第一帧进行检测,跟踪剩下的帧
lkt.detect_points()
lkt.draw()
for i in range(len(imnames)-1):
	lkt.track_points()
	lkt.draw()
- 使用发生器
先将下面代码添加到LKTracker 类
def track(self):
	""" 发生器,用于遍历整个序列 """
	for i in range(len(self.imnames)):
		if self.features == []:
			self.detect_points()
		else:
			self.track_points()
	# 创建一份 RGB 副本
	f = array(self.features).reshape(-1,2)
	im = cv2.cvtColor(self.image,cv2.COLOR_BGR2RGB)
	yield im,f
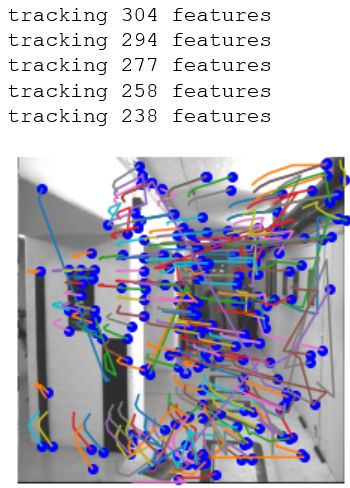
运行代码:
import cv2
import lktrack
from pylab import *
imnames = ['000.pgm', '001.pgm' , '002.pgm', '003.pgm', '004.pgm']
# track using the LKTracker generator
lkt = lktrack.LKTracker(imnames)
for im,ft in lkt.track():
    print('tracking %d features' % len(ft))

# plot the tracks
figure()
imshow(im)
for p in ft:
    plot(p[0],p[1],'bo')
for t in lkt.tracks:
    plot([p[0] for p in t],[p[1] for p in t])
axis('off')
show()
10.5 更多示例
图像修复
python inpaint.py empire.jpg
运行上面的命令会打开一个交互窗口,在窗口中可以画一些需要修复的区域,最终的修复结果会在一个单独的窗口显示出来。
利用分水岭变换进行分割
python watershed.py empire.jpg
该命令会打开一个交互窗口,可以在窗口中画一些种子区域作为输入,然后显示用分水岭变换进行分割后的结果,在变换后的灰度图像中,不同的颜色代表分割覆盖的区域。
利用霍夫变换检测直线
python houghlines.py empire.jpg
该命令可以进行直线检测,通常这些直线是无限长的,如果想在图像中找到线段的端点,可以使用边缘映射找到这些端点。


