需要使用的库:
- tushare
- pytorch
- pandas
- numpy
- matplotlib
1. 数据导入
import tushare as ts

ts.set_token('98edbe9c3e444002decb09646838a02f0307e41bd5ce51bb5b2a99c8')
ts_pro = ts.pro_api()
help(ts)
Help on package tushare:

NAME
    tushare - # -*- coding:utf-8 -*-

PACKAGE CONTENTS
    bond (package)
    coins (package)
    data (package)
    fund (package)
    futures (package)
    internet (package)
    pro (package)
    stock (package)
    subs (package)
    trader (package)
    util (package)

VERSION
    1.2.62

AUTHOR
    Jimmy Liu

FILE
    e:\anaconda3\lib\site-packages\tushare\__init__.py
ts_code = '002069.SZ'
start_date = '2006-01-01'
end_date = '2020-01-01'
df = ts_pro.daily(
ts_code=ts_code,
start_date=start_date,
end_date=end_date)
df.to_csv('002069.csv', index=0)
import pandas as pd
df = pd.read_csv('002069.csv')
df = df.sort_values(['trade_date'], ascending=True)
df.head()
|
ts_code |
trade_date |
open |
high |
low |
close |
pre_close |
change |
pct_chg |
vol |
amount |
| 3034 |
002069.SZ |
20060928 |
60.89 |
64.48 |
58.00 |
62.11 |
25.00 |
37.11 |
148.44 |
169301.73 |
1.028809e+06 |
| 3033 |
002069.SZ |
20060929 |
64.10 |
67.00 |
62.48 |
62.99 |
62.11 |
0.88 |
1.42 |
49290.44 |
3.182028e+05 |
| 3032 |
002069.SZ |
20061009 |
63.00 |
66.15 |
62.16 |
65.00 |
62.99 |
2.01 |
3.19 |
28449.04 |
1.827514e+05 |
| 3031 |
002069.SZ |
20061010 |
64.89 |
71.50 |
64.00 |
71.49 |
65.00 |
6.49 |
9.98 |
34935.76 |
2.381439e+05 |
| 3030 |
002069.SZ |
20061011 |
70.20 |
71.80 |
69.22 |
69.99 |
71.49 |
-1.50 |
-2.10 |
15807.24 |
1.109196e+05 |
2. 数据预处理
use_cols = ['open', 'high', 'low', 'close', 'pre_close', 'vol', 'amount']
df = df[use_cols]
df.head()
|
open |
high |
low |
close |
pre_close |
vol |
amount |
| 3034 |
60.89 |
64.48 |
58.00 |
62.11 |
25.00 |
169301.73 |
1.028809e+06 |
| 3033 |
64.10 |
67.00 |
62.48 |
62.99 |
62.11 |
49290.44 |
3.182028e+05 |
| 3032 |
63.00 |
66.15 |
62.16 |
65.00 |
62.99 |
28449.04 |
1.827514e+05 |
| 3031 |
64.89 |
71.50 |
64.00 |
71.49 |
65.00 |
34935.76 |
2.381439e+05 |
| 3030 |
70.20 |
71.80 |
69.22 |
69.99 |
71.49 |
15807.24 |
1.109196e+05 |
close_min = df['close'].min()
close_max = df['close'].max()
df=df.apply(lambda x:(x-min(x))/(max(x)-min(x)))
df.head()
|
open |
high |
low |
close |
pre_close |
vol |
amount |
| 3034 |
0.401512 |
0.416768 |
0.404243 |
0.401345 |
0.151699 |
0.166571 |
0.800115 |
| 3033 |
0.423566 |
0.433710 |
0.436792 |
0.407265 |
0.401345 |
0.047720 |
0.247007 |
| 3032 |
0.416008 |
0.427995 |
0.434467 |
0.420787 |
0.407265 |
0.027080 |
0.141577 |
| 3031 |
0.428993 |
0.463964 |
0.447835 |
0.464447 |
0.420787 |
0.033504 |
0.184693 |
| 3030 |
0.465476 |
0.465981 |
0.485760 |
0.454356 |
0.464447 |
0.014561 |
0.085666 |
import numpy as np
sequence = 30
X = []
Y = []
for i in range(df.shape[0]-sequence):
X.append(np.array(df.iloc[i:(i+sequence),].values, dtype=np.float))
Y.append(np.array(df.iloc[(i+sequence),3],dtype=np.float))
trainx, trainy = X[:int(0.8*df.shape[0])], Y[:int(0.8*df.shape[0])]
testx, testy = X[int(0.8*df.shape[0]):], Y[int(0.8*df.shape[0]):]
print(len(trainx))
print(len(testx))
2428
577
import torch
import torch.utils.data as Data
torch.manual_seed(1)
trainx = np.array(trainx)
trainy = np.array(trainy)
testx = np.array(testx)
testy = np.array(testy)
trainx = torch.from_numpy(trainx)
trainy = torch.from_numpy(trainy)
testx = torch.from_numpy(testx)
testy = torch.from_numpy(testy)
print('trainx size: ', trainx.size())
print('trainy size: ', trainy.size())
print('testx size: ', testx.size())
print('testy size: ', testy.size())
trainx size:  torch.Size([2428, 30, 7])
trainy size:  torch.Size([2428])
testx size:  torch.Size([577, 30, 7])
testy size:  torch.Size([577])
train_dataset = Data.TensorDataset(trainx, trainy)
test_dataset = Data.TensorDataset(testx, testy)
train_loader = Data.DataLoader(
dataset=train_dataset,
batch_size=32,
shuffle=True,
num_workers=2
)
test_loader = Data.DataLoader(
dataset=test_dataset,
batch_size=32,
shuffle=True,
num_workers=2
)
3. 定义网络模型
input_size = 7
seq_len = 30
hidden_size = 32
output_size = 1

import torch.nn as nn
import torch.nn.functional as F
from torch.autograd import Variable

class MyNet(nn.Module):

    def __init__(self, input_size=input_size, hidden_size=hidden_size, output_size=output_size):
        super(MyNet, self).__init__()
        self.input_size = input_size
        self.hidden_size = hidden_size
        self.output_size = output_size
        self.lstm = nn.LSTM(input_size=input_size, hidden_size=hidden_size, batch_first=True)
        self.fc = nn.Linear(self.hidden_size*seq_len, self.output_size)

    def forward(self, input):
        out,_ = self.lstm(input)
        b, s, h = out.size()
        out = self.fc(out.reshape(b, s*h))
        return out

net = MyNet()
print(net)
MyNet(
  (lstm): LSTM(7, 32, batch_first=True)
  (fc): Linear(in_features=960, out_features=1, bias=True)
)
4. 选择损失函数及优化器
import torch.optim as optim
from tqdm import tqdm

loss_function = nn.MSELoss()
optimizer = optim.Adam(net.parameters(), lr=0.001)

for epoch in tqdm(range(100)):
    total_loss = 0
    for _,(data, label) in enumerate(train_loader):
        data = Variable(data).float()
        pred = net(data)
        label = Variable(label).float()
        label = label.unsqueeze(1)
        loss = loss_function(pred, label)
        loss.backward()
        optimizer.step()
        optimizer.zero_grad()
        total_loss += loss.item()

    if (epoch+1) % 10 == 0:
        print('Epoch: ', epoch+1, ' loss: ', total_loss)
 10%|█         | 10/100 [00:17<02:32,  1.70s/it]Epoch:  10  loss:  0.03518655754669453
 20%|██        | 20/100 [00:34<02:14,  1.68s/it]Epoch:  20  loss:  0.023873500191257335
 30%|███       | 30/100 [00:53<02:11,  1.88s/it]Epoch:  30  loss:  0.02149457185441861
 40%|████      | 40/100 [01:14<02:07,  2.13s/it]Epoch:  40  loss:  0.017912164659719565
 50%|█████     | 50/100 [01:31<01:25,  1.72s/it]Epoch:  50  loss:  0.013031252356086043
 60%|██████    | 60/100 [01:51<01:14,  1.87s/it]Epoch:  60  loss:  0.014165752041662927
 70%|███████   | 70/100 [02:10<01:02,  2.09s/it]Epoch:  70  loss:  0.011516284157551127
 80%|████████  | 80/100 [02:27<00:35,  1.79s/it]Epoch:  80  loss:  0.01033103184090578
 90%|█████████ | 90/100 [02:47<00:17,  1.74s/it]Epoch:  90  loss:  0.010540407126427453
100%|██████████| 100/100 [03:07<00:00,  1.88s/it]Epoch:  100  loss:  0.01101792572899285
5. 测试模型
pred_list = []
label_list = []

for _, (data, label) in enumerate(test_loader):
    data = Variable(data).float()
    pred = net(data)
    pred_list.extend(pred.data.squeeze(1).tolist())
    label_list.extend(label.tolist())
pred_list[:5]
[0.003661651164293289,
 0.004493666812777519,
 0.017206232994794846,
 0.004013188183307648,
 -0.003268543630838394]
label_list[:5]
[0.005449041372351158,
 0.007938109653548601,
 0.015136226034308779,
 0.00538176925664312,
 0.0014127144298688192]
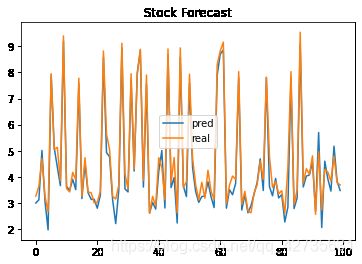
简单查看预测结果与真实值,发现相差不是特别明显
import matplotlib.pyplot as plt


plt.plot([i*(close_max-close_min)+close_min for i in pred_list[:100]] , label='pred')
plt.plot([i*(close_max-close_min)+close_min for i in label_list[:100]], label='real')
plt.title('Stock Forecast')
plt.legend()
plt.show()

