毕业设计 - 题目:基于大数据的用户画像分析系统 数据分析 开题
文章目录
- 1 前言
- 2 用户画像分析概述
-
- 2.1 用户画像构建的相关技术
- 2.2 标签体系
- 2.3 标签优先级
- 3 实站 - 百货商场用户画像描述与价值分析
-
- 3.1 数据格式
- 3.2 数据预处理
- 3.3 会员年龄构成
- 3.4 订单占比 消费画像
- 3.5 季度偏好画像
- 3.6 会员用户画像与特征
-
- 3.6.1 构建会员用户业务特征标签
- 3.6.2 会员用户词云分析
- 4 最后-毕设帮助
1 前言
Hi,大家好,这里是丹成学长,今天做一个电商销售预测分析,这只是一个demo,尝试对电影数据进行分析,并可视化系统
毕设帮助,开题指导,技术解答
746876041
2 用户画像分析概述
用户画像是指根据用户的属性、用户偏好、生活习惯、用户行为等信息而抽象出来的标签化用户模型。通俗说就是给用户打标签,而标签是通过对用户信息分析而来的高度精炼的特征标识。通过打标签可以利用一些高度概括、容易理解的特征来描述用户,可以让人更容易理解用户,并且可以方便计算机处理。
标签化就是数据的抽象能力
- 互联网下半场精细化运营将是长久的主题
- 用户是根本,也是数据分析的出发点
2.1 用户画像构建的相关技术
我们对构建用户画像的方法进行总结归纳,发现用户画像的构建一般可以分为目标分析、体系构建、画像建立三步。
画像构建中用到的技术有数据统计、机器学习和自然语言处理技术(NLP)等,下如图所示。具体的画像构建方法学长会在后面的部分详细介绍。
按照数据流处理阶段划分用户画像建模的过程,分为三个层,每一层次,都需要打上不同的标签。
- 数据层:用户消费行为的标签。打上事实标签,作为数据客观的记录
- 算法层:透过行为算出的用户建模。打上模型标签,作为用户画像的分类
- 业务层:指的是获客、粘客、留客的手段。打上预测标签,作为业务关联的结果
2.2 标签体系
目前主流的标签体系都是层次化的,如下图所示。首先标签分为几个大类,每个大类下进行逐层细分。在构建标签时,我们只需要构建最下层的标签,就能够映射到上面两级标签。
上层标签都是抽象的标签集合,一般没有实用意义,只有统计意义。例如我们可以统计有人口属性标签的用户比例,但用户有人口属性标签本身对广告投放没有任何意义。
2.3 标签优先级
构建的优先级需要综合考虑业务需求、构建难易程度等,业务需求各有不同,这里介绍的优先级排序方法主要依据构建的难易程度和各类标签的依存关系,优先级如下图所示:
我们把标签分为三类,这三类标签有较大的差异,构建时用到的技术差别也很大。第一类是人口属性,这一类标签比较稳定,一旦建立很长一段时间基本不用更新,标签体系也比较固定;第二类是兴趣属性,这类标签随时间变化很快,标签有很强的时效性,标签体系也不固定;第三类是地理属性,这一类标签的时效性跨度很大,如GPS轨迹标签需要做到实时更新,而常住地标签一般可以几个月不用更新,挖掘的方法和前面两类也大有不同,如图所示:
3 实站 - 百货商场用户画像描述与价值分析
3.1 数据格式
3.2 数据预处理
部分代码
# 作者:丹成学长 Q746876041
import matplotlib
import warnings
import re
import pandas as pd
import numpy as np
import seaborn as sns
import matplotlib.pyplot as plt

from sklearn.cluster import KMeans
from sklearn.metrics import silhouette_score
from sklearn.preprocessing import StandardScaler, MinMaxScaler

%matplotlib inline
plt.rcParams['font.sans-serif'] = 'SimHei'
plt.rcParams['axes.unicode_minus'] = False
matplotlib.rcParams.update({
     'font.size' : 16})
plt.style.use('ggplot')
warnings.filterwarnings('ignore')

df_cum = pd.read_excel('./cumcm2018c1.xlsx')
df_cum
# 先来对会员信息表进行分析
print('会员信息表一共有{}行记录,{}列字段'.format(df_cum.shape[0], df_cum.shape[1]))
print('数据缺失的情况为:\n{}'.format(df_cum.isnull().mean()))
print('会员卡号(不重复)有{}条记录'.format(len(df_cum['会员卡号'].unique())))

# 会员信息表去重
df_cum.drop_duplicates(subset = '会员卡号', inplace = True)
print('会员卡号(去重)有{}条记录'.format(len(df_cum['会员卡号'].unique())))

# 去除登记时间的缺失值,不能直接dropna,因为我们需要保留一定的数据集进行后续的LRFM建模操作
df_cum.dropna(subset = ['登记时间'], inplace = True)
print('df_cum(去重和去缺失)有{}条记录'.format(df_cum.shape[0]))

# 性别上缺失的比例较少,所以下面采用众数填充的方法
df_cum['性别'].fillna(df_cum['性别'].mode().values[0], inplace = True)
df_cum.info()

# 由于出生日期这一列的缺失值过多,且存在较多的异常值,不能贸然删除
# 故下面另建一个数据集L来保存“出生日期”和“性别”信息,方便下面对会员的性别和年龄信息进行统计
L = pd.DataFrame(df_cum.loc[df_cum['出生日期'].notnull(), ['出生日期', '性别']])
L['年龄'] = L['出生日期'].astype(str).apply(lambda x: x[:3] + '0')
L.drop('出生日期', axis = 1, inplace = True)
L['年龄'].value_counts()
...(略)....
3.3 会员年龄构成
# 使用上述预处理后的数据集L,包含两个字段,分别是“年龄”和“性别”,先画出年龄的条形图
fig, axs = plt.subplots(1, 2, figsize = (16, 7), dpi = 100)
# 绘制条形图
ax = sns.countplot(x = '年龄', data = L, ax = axs[0])
# 设置数字标签
for p in ax.patches:
    height = p.get_height()
    ax.text(x = p.get_x() + (p.get_width() / 2), y = height + 500, s = '{:.0f}'.format(height), ha = 'center')
axs[0].set_title('会员的出生年代')
# 绘制饼图
axs[1].pie(sex_sort, labels = sex_sort.index, wedgeprops = {
     'width': 0.4}, counterclock = False, autopct = '%.2f%%', pctdistance = 0.8)
axs[1].set_title('会员的男女比例')
plt.savefig('./会员出生年代及男女比例情况.png')
# 绘制各个年龄段的饼图
plt.figure(figsize = (8, 6), dpi = 100)
plt.pie(res.values, labels = ['中年', '青年', '老年'], autopct = '%.2f%%', pctdistance = 0.8,
        counterclock = False, wedgeprops = {
     'width': 0.4})
plt.title('会员的年龄分布')
plt.savefig('./会员的年龄分布.png')
3.4 订单占比 消费画像
# 由于相同的单据号可能不是同一笔消费,以“消费产生的时间”为分组依据,我们可以知道有多少个不同的消费时间,即消费的订单数
fig, axs = plt.subplots(1, 2, figsize = (12, 7), dpi = 100)
axs[0].pie([len(df1.loc[df1['会员'] == 1, '消费产生的时间'].unique()), len(df1.loc[df1['会员'] == 0, '消费产生的时间'].unique())],
          labels = ['会员', '非会员'], wedgeprops = {
     'width': 0.4}, counterclock = False, autopct = '%.2f%%', pctdistance = 0.8)
axs[0].set_title('总订单占比')
axs[1].pie([df1.loc[df1['会员'] == 1, '消费金额'].sum(), df1.loc[df1['会员'] == 0, '消费金额'].sum()],
          labels = ['会员', '非会员'], wedgeprops = {
     'width': 0.4}, counterclock = False, autopct = '%.2f%%', pctdistance = 0.8)
axs[1].set_title('总消费金额占比')
plt.savefig('./总订单和总消费占比情况.png')
消费偏好:
我觉得会稍微偏向与消费的频次,相当于消费的订单数,因为每笔消费订单其中所包含的消费商品和金额都是不太一样的,有的订单所消费的商品很少,但金额却很大,有的消费的商品很多,但金额却特别少。如果单纯以总金额来衡量的话,会员下次消费时间可能会很长,消费频次估计也会相对变小(因为这次所购买的商品已经足够用了)。所以我会偏向于认为一个用户消费频次(订单数)越多,就越能带来更多的价值,从另一方面上来讲,用户也不可能一直都是消费低端产品,消费频次越多用户的粘性也会相对比较大
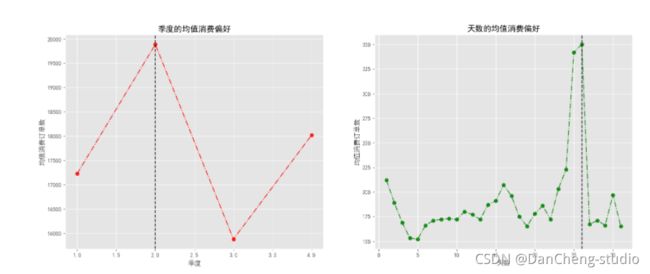
3.5 季度偏好画像
# 前提假设:2015-2018年之间,消费者偏好在时间上不会发生太大的变化(均值),消费偏好——>以不同时间的订单数来衡量
quarters_list, quarters_order = orders(df_vip, '季度', 3)
days_list, days_order = orders(df_vip, '天', 36)
time_list = [quarters_list, days_list]
order_list = [quarters_order, days_order]
maxindex_list = [quarters_order.index(max(quarters_order)), days_order.index(max(days_order))]
fig, axs = plt.subplots(1, 2, figsize = (18, 7), dpi = 100)
colors = np.random.choice(['r', 'g', 'b', 'orange', 'y'], replace = False, size = len(axs))
titles = ['季度的均值消费偏好', '天数的均值消费偏好']
labels = ['季度', '天数']
for i in range(len(axs)):
    ax = axs[i]
    ax.plot(time_list[i], order_list[i], linestyle = '-.', c = colors[i], marker = 'o', alpha = 0.85)
    ax.axvline(x = time_list[i][maxindex_list[i]], linestyle = '--', c = 'k', alpha = 0.8)
    ax.set_title(titles[i])
    ax.set_xlabel(labels[i])
    ax.set_ylabel('均值消费订单数')
    print(f'{
       titles[i]}最优的时间为: {
       time_list[i][maxindex_list[i]]}\t 对应的均值消费订单数为: {
       order_list[i][maxindex_list[i]]}')
plt.savefig('./季度和天数的均值消费偏好情况.png')
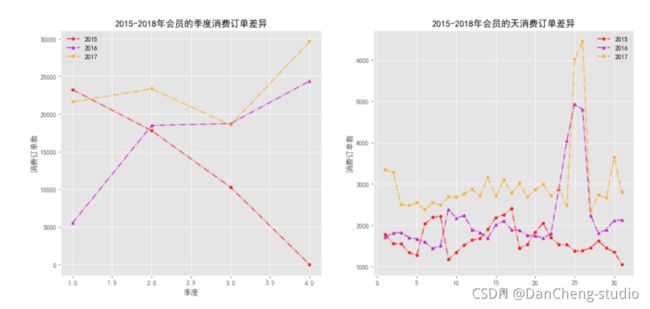
# 自定义函数来绘制不同年份之间的的季度或天数的消费订单差异
def plot_qd(df, label_y, label_m, nrow, ncol):
    """
    df: 为DataFrame的数据集
    label_y: 为年份的字段标签
    label_m: 为标签的一个列表
    n_row: 图的行数
    n_col: 图的列数
    """
    # 必须去掉最后一年的数据,只能对2015-2017之间的数据进行分析
    y_list = np.sort(df[label_y].unique().tolist())[:-1]
    colors = np.random.choice(['r', 'g', 'b', 'orange', 'y', 'k', 'c', 'm'], replace = False, size = len(y_list))
    markers = ['o', '^', 'v']
    plt.figure(figsize = (8, 6), dpi = 100)
    fig, axs = plt.subplots(nrow, ncol, figsize = (16, 7), dpi = 100)
    for k in range(len(label_m)):
        m_list = np.sort(df[label_m[k]].unique().tolist())
        for i in range(len(y_list)):
            order_m = []
            index1 = df[label_y] == y_list[i]
            for j in range(len(m_list)):
                index2 = df[label_m[k]] == m_list[j]
                order_m.append(len(df.loc[index1 & index2, '消费产生的时间'].unique()))
            axs[k].plot(m_list, order_m, linestyle ='-.', c = colors[i], alpha = 0.8, marker = markers[i], label = y_list[i], markersize = 4)
        axs[k].set_xlabel(f'{
       label_m[k]}')
        axs[k].set_ylabel('消费订单数')
        axs[k].set_title(f'2015-2018年会员的{
       label_m[k]}消费订单差异')
        axs[k].legend()
    plt.savefig(f'./2015-2018年会员的{
       "和".join(label_m)}消费订单差异.png')
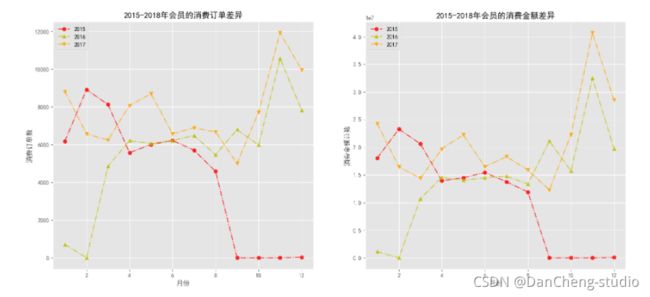
# 自定义函数来绘制不同年份之间的月份消费订单差异
def plot_ym(df, label_y, label_m):
    """
    df: 为DataFrame的数据集
    label_y: 为年份的字段标签
    label_m: 为月份的字段标签
    """
    # 必须去掉最后一年的数据,只能对2015-2017之间的数据进行分析
    y_list = np.sort(df[label_y].unique().tolist())[:-1]
    m_list = np.sort(df[label_m].unique().tolist())
    colors = np.random.choice(['r', 'g', 'b', 'orange', 'y'], replace = False, size = len(y_list))
    markers = ['o', '^', 'v']
    fig, axs = plt.subplots(1, 2, figsize = (18, 8), dpi = 100)
    for i in range(len(y_list)):
        order_m = []
        money_m = []
        index1 = df[label_y] == y_list[i]
        for j in range(len(m_list)):
            index2 = df[label_m] == m_list[j]
            order_m.append(len(df.loc[index1 & index2, '消费产生的时间'].unique()))
            money_m.append(df.loc[index1 & index2, '消费金额'].sum())
        axs[0].plot(m_list, order_m, linestyle ='-.', c = colors[i], alpha = 0.8, marker = markers[i], label = y_list[i])
        axs[1].plot(m_list, money_m, linestyle ='-.', c = colors[i], alpha = 0.8, marker = markers[i], label = y_list[i])
        axs[0].set_xlabel('月份')
        axs[0].set_ylabel('消费订单数')
        axs[0].set_title('2015-2018年会员的消费订单差异')
        axs[1].set_xlabel('月份')
        axs[1].set_ylabel('消费金额总数')
        axs[1].set_title('2015-2018年会员的消费金额差异')
        axs[0].legend()
        axs[1].legend()
    plt.savefig('./2015-2018年会员的消费订单和金额差异.png')
maxindex = order_nums.index(max(order_nums))
plt.figure(figsize = (8, 6), dpi = 100)
plt.plot(x_list, order_nums, linestyle = '-.', marker = 'o', c = 'm', alpha = 0.8)
plt.xlabel('小时')
plt.ylabel('消费订单')
plt.axvline(x = x_list[maxindex], linestyle = '--', c = 'r', alpha = 0.6)
plt.title('2015-2018年各段小时的销售订单数')
plt.savefig('./2015-2018年各段小时的销售订单数.png')
3.6 会员用户画像与特征
3.6.1 构建会员用户业务特征标签
# 取DataFrame之后转置取values得到一个列表,再绘制对应的词云,可以自定义一个绘制词云的函数,输入参数为df和会员卡号
"""
L: 入会程度(新用户、中等用户、老用户)
R: 最近购买的时间(月)
F: 消费频数(低频、中频、高频)
M: 消费总金额(高消费、中消费、低消费)
P: 积分(高、中、低)
S: 消费时间偏好(凌晨、上午、中午、下午、晚上)
X:性别
"""

# 开始对数据进行分组
"""
L(入会程度):3个月以下为新用户,4-12个月为中等用户,13个月以上为老用户
R(最近购买的时间)
F(消费频次):次数20次以上的为高频消费,6-19次为中频消费,5次以下为低频消费
M(消费金额):10万以上为高等消费,1万-10万为中等消费,1万以下为低等消费
P(消费积分):10万以上为高等积分用户,1万-10万为中等积分用户,1万以下为低等积分用户
"""
df_profile = pd.DataFrame()
df_profile['会员卡号'] = df['id']
df_profile['性别'] = df['X']
df_profile['消费偏好'] = df['S'].apply(lambda x: '您喜欢在' + str(x) + '时间进行消费')
df_profile['入会程度'] = df['L'].apply(lambda x: '老用户' if int(x) >= 13 else '中等用户' if int(x) >= 4 else '新用户')
df_profile['最近购买的时间'] = df['R'].apply(lambda x: '您最近' + str(int(x) * 30) + '天前进行过一次购物')
df_profile['消费频次'] = df['F'].apply(lambda x: '高频消费' if x >= 20 else '中频消费' if x >= 6 else '低频消费')
df_profile['消费金额'] = df['M'].apply(lambda x: '高等消费用户' if int(x) >= 1e+05 else '中等消费用户' if int(x) >= 1e+04 else '低等消费用户')
df_profile['消费积分'] = df['P'].apply(lambda x: '高等积分用户' if int(x) >= 1e+05 else '中等积分用户' if int(x) >= 1e+04 else '低等积分用户')
df_profile
3.6.2 会员用户词云分析
# 开始绘制用户词云,封装成一个函数来直接显示词云
def wc_plot(df, id_label = None):
    """
    df: 为DataFrame的数据集
    id_label: 为输入用户的会员卡号,默认为随机取一个会员进行展示
    """
    myfont = 'C:/Windows/Fonts/simkai.ttf'
    if id_label == None:
        id_label = df.loc[np.random.choice(range(df.shape[0])), '会员卡号']
    text = df[df['会员卡号'] == id_label].T.iloc[:, 0].values.tolist()
    plt.figure(dpi = 100)
    wc = WordCloud(font_path = myfont, background_color = 'white', width = 500, height = 400).generate_from_text(' '.join(text))
    plt.imshow(wc)
    plt.axis('off')
    plt.savefig(f'./会员卡号为{
       id_label}的用户画像.png')
    plt.show()
4 最后-毕设帮助
毕设帮助,开题指导,技术解答
746876041
![]()


