【Python与机器学习3-2】matplotlib数据分析常用图表的绘制
子图 plt.subplots()
在一张图里显示多个子图
plt.subplots(几行,几列,第几幅图)
保证子图中坐标范围一致
使某个figure中的所有子图共享一个坐标轴的方法:加sharey前一个坐标轴
ax1=plt.subplots(1,2,1)
ax2=plt.subplots(1,2,2,sharey=ax1)
绘制多个图
fig, ((ax1, ax2, ax3), (ax4, ax5, ax6)) = plt.subplots(2, 3,
                                                      sharex=True, sharey=True)
ax5.plot(exponential_data, '-') #sharex和sharey都是TRUE代表坐标轴都一样
直方图
直方图是一种对数据分布情况的图形表示,首先要对数据进行分组,然后统计每个分组内数据的数量。也可以把数量归一化为频率frequency,比较起来比较有意义
plt.hist(data, bins,normed=true)
参数:
- data: 数据列表
- 分组边界或分组个数
- normed=true则y轴为频率,否则为量
在子图中绘制直方图
fig, ((ax1, ax2), (ax3, ax4)) = plt.subplots(2, 2, sharex=True)
axs = [ax1, ax2, ax3, ax4]

for n in range(len(axs)):
    sample_size = 10 ** (n + 1)
    sample = np.random.normal(loc=0., scale=1., size=sample_size) #用numpy生成正态分布的随机数
    # 默认bin的个数为10,可以修改bin的个数
    axs[n].hist(sample) #在每个子图上绘制直方图
    axs[n].set_title('n={}'.format(sample_size))
使用gridspec和直方图绘制一个复杂分析图
用gridspec.GridSpec把画布划分成小格子,然后再指定子图,再在指定位置的子图上划散点图和直方图
import matplotlib.gridspec as gridspec
x = np.random.random(size=10000) #x轴为随机数
y = np.random.normal(loc=0., scale=1., size=10000) #y轴为正态分布的随机数
plt.figure()
gspec = gridspec.GridSpec(3, 3) #把画布划分为3行3列
指定子图在格子上的位置
top_hist = plt.subplot(gspec[0, 1:])
side_hist = plt.subplot(gspec[1:, 0])
lower_right = plt.subplot(gspec[1:, 1:])

lower_right.scatter(x, y) #画散点图
top_hist.hist(x, bins=100, normed=True) #画x轴的直方图
side_hist.hist(y, bins=100,  orientation='horizontal', normed=True)#画y的直方图
side_hist.invert_xaxis() #转换坐标轴
盒图 plt.boxplot
盒图中的值(从上到下)
- 离群值:可以启用也可以不启用。若不启用离群值,则须线延伸到图中的最大值和最小值。若启用离群值,它们是与四分位间距的距离超过四分位间距大小 1.5 倍的数据点。
- 最大值
- Q3 第75百分位数
盒子的上边缘和下边缘指示四分位数间距 (IQR), 即介于第一个和第三个四分位数(第 25 百分位数和第 75 百分位数)之间的值范围。 - 均值
- 中位数: 在数据波动比较大的时候,比平均数能更好的反应数据分布情况
- Q1 第25百分位数
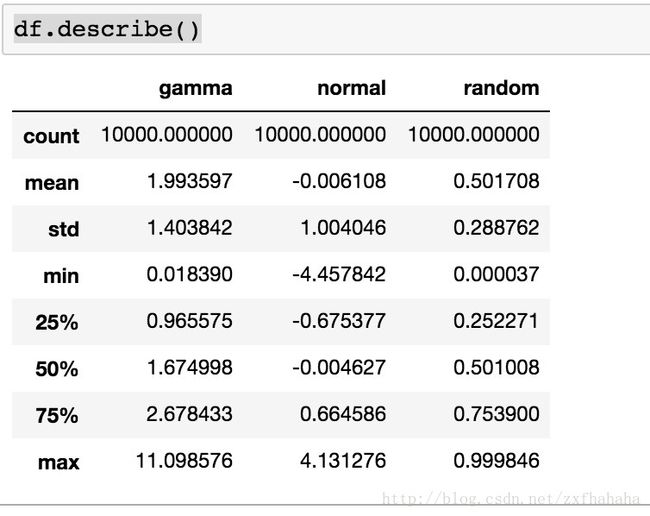
上面的这些东西可以用describe()得到数值
plt.boxplot(data, whis=‘range’) #whis等于range为不启用离群值
import pandas as pd
# 正态分布采样
normal_sample = np.random.normal(loc=0., scale=1., size=10000)
# 随机数采样
random_sample = np.random.random(size=10000)
# gamma分布采样
gamma_sample = np.random.gamma(2, size=10000)

df = pd.DataFrame({
    'normal': normal_sample,
                  'random': random_sample,
                  'gamma': gamma_sample})
用
df.describe() #得到数据的统计数值plt.figure()
plt.boxplot([df['normal'], df['random'], df['gamma']], whis='range') #画出三个数据的盒线图且不采用离群值热图
三维数据的可视化,位置和颜色
plt.figure()
y = np.random.normal(loc=0., scale=1., size=10000)
x = np.random.random(size=10000)
plt.hist2d(x, y, bins=100) #生成热图
plt.colorbar() #生成右边的那个条

