数据爬虫 + 数据清洗 + 数据可视化,完整的项目教程!
一:数据挖掘
我选用了链家网做数据爬取场所(不得不唠叨一句,这个网站真是为了爬虫而生的,对爬虫特别友好哈哈哈,反扒措施比较少)
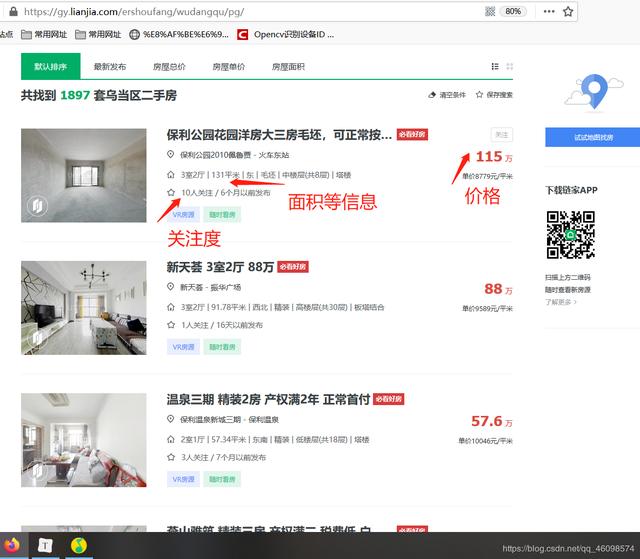
比如我们爬取贵阳市乌当区的所有房子的房价及其他信息:
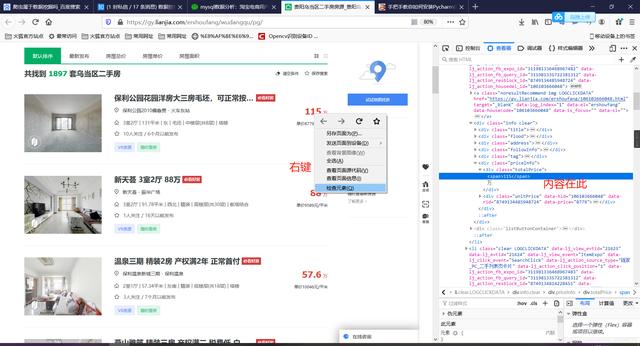
比如我们爬取第一个房子的价格:115万:
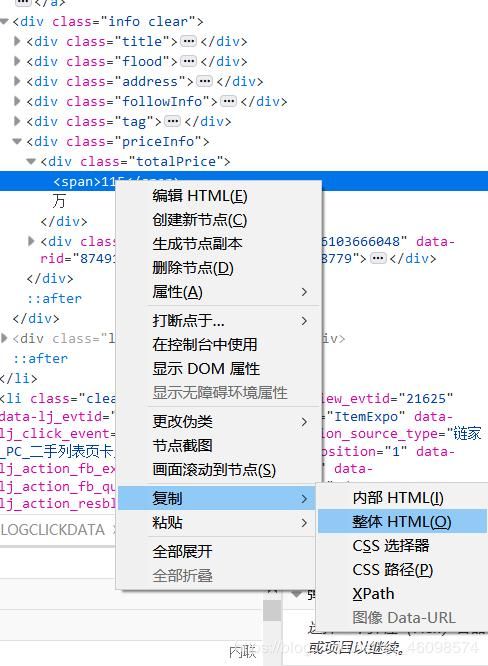
接下来我们可以使用复制CSS选择器或者XPath等等来实现获取:
下面我们使用复制XPath的方式,修改路径即可(需要一定前端知识):
分别实现详解:
1:导入必备库
import requests
from lxml import etree
import xlwt
from xlutils.copy import copy
import xlrd
import csv
import pandas as pd
import time
细说一下:
Requests 是用Python语言编写,基于 urllib,采用 Apache2 Licensed 开源协议的 HTTP 库,爬虫必备技能之一。它比 urllib 更加方便,可以节约我们大量的工作,完全满足 HTTP 测试需求。Requests 的哲学是以 PEP 20 的习语为中心开发的,所以它比 urllib 更加 Pythoner。更重要的一点是它支持 Python3 哦!
Pandas是python第三方库,提供高性能易用数据类型和分析工具 , pandas是一个强大的分析结构化数据的工具集;它的使用基础是Numpy(提供高性能的矩阵运算);用于数据挖掘和数据分析,同时也提供数据清洗功能。
2:定义爬取URL地址和设置请求头(其实还可以更完善,不过链家网比较友善,这点够用了)
        self.url = 'https://gy.lianjia.com/ershoufang/wudangqu/pg{}/'
        self.headers = {
            "User-Agent": "Mozilla/5.0 (Windows NT 10.0; WOW64) AppleWebKit/537.36 (KHTML, like Gecko) Chrome/75.0.3770.100 Safari/537.36"}
url是要获取信息的地址:我们选用贵阳市(gy)乌当区(wudangqu)为目标,然后pg{}是页码的意思:pg100就是爬第一百页,这里我们使用{}做一下占位,方便后续从第一页迭代到最后。
headers是我们的请求头,就是模拟人正常登录的意思,而不是通过python,让网页知道你是爬虫,知道了就有可能封掉你的IP等。 通常HTTP消息包括客户机向服务器的请求消息和服务器向客户机的响应消息。这两种类型的消息由一个起始行,一个或者多个头域,一个只是头域结束的空行和可 选的消息体组成。HTTP的头域包括通用头,请求头,响应头和实体头四个部分。每个头域由一个域名,冒号(:)和域值三部分组成。域名是大小写无关的,域 值前可以添加任何数量的空格符,头域可以被扩展为多行,在每行开始处,使用至少一个空格或制表符。 User-Agent头域的内容包含发出请求的用户信息。
3:使用Requests获取数据
    def get_response_spider(self, url_str):  # 发送请求
        get_response = requests.get(self.url, headers=self.headers)
        time.sleep(4)
        response = get_response.content.decode()
        html = etree.HTML(response)
        return html
4:使用Xpath筛选数据源,过程见上图,需要一定的前端知识,不过,也有一些技巧:
    def get_content_html(self, html):  # 使xpath获取数据
        self.houseInfo = html.xpath('//div[@class="houseInfo"]/text()')
        self.title = html.xpath('//div[@class="title"]/a/text()')
        self.positionInfo = html.xpath('//div[@class="positionInfo"]/a/text()')
        self.totalPrice = html.xpath('//div[@class="totalPrice"]/span/text()')
        self.unitPrice = html.xpath('//div[@class="unitPrice"]/span/text()')
        self.followInfo = html.xpath('//div[@class="followInfo"]/text()')
        self.tag = html.xpath('//div[@class="tag"]/span/text()')
5:使用生成器,通过for循环和yield生成器迭代生成数据项:
    def xpath_title(self):
        for i in range(len(self.title)):
            yield self.title[i]

    def xpath_positionInfo(self):
        for i in range(len(self.positionInfo)):
            yield self.positionInfo[i]

    def xpath_totalPrice(self):
        for i in range(len(self.totalPrice)):
            yield self.totalPrice[i]
    def xpath_unitPrice(self):
        for i in range(len(self.unitPrice)):
            yield self.unitPrice[i]
    def xpath_followInfo(self):
        for i in range(len(self.followInfo)):
            yield self.followInfo[i]
    def xpath_tag(self):
        for i in range(len(self.tag)):
            yield self.tag[i]
6:通过调用这些函数进行预获得:
self.xpath_houseInfo()
        self.xpath_title()
        self.xpath_positionInfo()
        self.xpath_totalPrice()
        self.xpath_unitPrice()
        self.xpath_followInfo()
        self.xpath_tag()
        get_houseInfo = self.xpath_houseInfo()
        get_title = self.xpath_title()
        get_positionInfo=self.xpath_positionInfo()
        get_totalPrice = self.xpath_totalPrice()
        get_unitPrice = self.xpath_unitPrice()
        get_followInfo=self.xpath_followInfo()
        get_tag=self.xpath_tag()
这里的函数就是调用上面的生成器的函数:
生成器yield 理解的关键在于:下次迭代时,代码从yield的下一跳语句开始执行。
7:数据筛选,写入文本中:
        while True:
            data_houseInfo= next(get_houseInfo)
            data_title=next(get_title)
            data_positionInfo=next(get_positionInfo)
            data_totalPrice=next(get_totalPrice)
            data_unitPrice=next(get_unitPrice)
            data_followInfo=next(get_followInfo)
            data_tag=next(get_tag)

            with open("lianjia1.csv", "a", newline="", encoding="utf-8-sig") as f:
                fieldnames = ['houseInfo', 'title', 'positionInfo', 'totalPrice/万元', 'unitPrice', 'followInfo', 'tag']
                writer = csv.DictWriter(f, fieldnames=fieldnames)  # 写入表头
                writer.writeheader()
                list_1 = ['houseInfo', 'title', 'positionInfo', 'totalPrice/万元', 'unitPrice', 'followInfo', 'tag']
                list_2 = [data_houseInfo,data_title,data_positionInfo,data_totalPrice,data_unitPrice,data_followInfo,data_tag]
                list_3 = dict(zip(list_1, list_2))
                writer.writerow(list_3)
                print("写入第"+str(i)+"行数据")
            i += 1
            if i > len(self.houseInfo):
                break
8:这里用过Next方法对生成器中内容不断提取:
fieldnames = ['houseInfo', 'title', 'positionInfo', 'totalPrice/万元', 'unitPrice', 'followInfo', 'tag']
writer = csv.DictWriter(f, fieldnames=fieldnames)  # 写入表头
writer.writeheader()
9:将其加在表头中。然后每一行写入一次数据
10:最后构造run函数:
    def run(self):
        i = 1
        while True:
            url_str = self.url.format(i)  # 构造请求url
            html = self.get_response_spider(url_str)
            self.get_content_html(html)
            self.qingxi_data_houseInfo()

            i += 1
            if i == 57:
                break
11:循环迭代一下,将上述的page页码从一到最后
12:main函数中启动一下,先new一下这个类,再启动run函数,就会开始爬取了
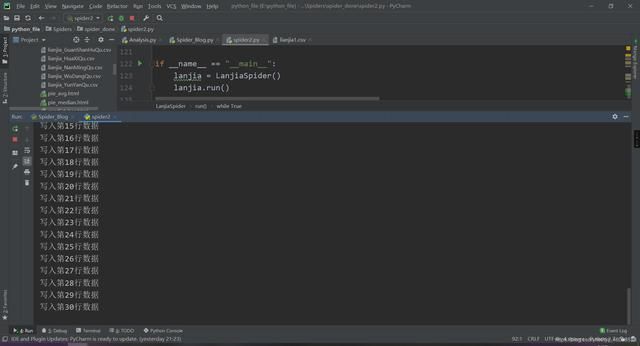
然后我们看一下结果:
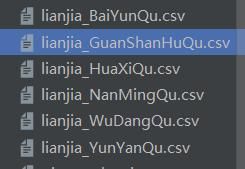
然后爬虫阶段就结束了,当然也可以写入数据库中,我们保存在文本文件中是为了更方便。我们保存在了左边的csv文件中,是不是很简单~,源码这个网上应该也有,我就暂时不放了,等朋友毕业再发。
二:数据清洗与提取
1:首先导入一下需要的库
"""
数据分析及可视化
"""
import pandas as pd
from pyecharts.charts import Line, Bar
import numpy as np
from pyecharts.globals import ThemeType
from pyecharts.charts import Pie
from pyecharts import options as opts
2:数据全局定义:
places = ['lianjia_BaiYunQu', 'lianjia_GuanShanHuQu', 'lianjia_HuaXiQu', 'lianjia_NanMingQu', 'lianjia_WuDangQu', 'lianjia_YunYanQu']
place = ['白云区', '观山湖区', '花溪区', '南明区', '乌当区', '云岩区']
avgs = []  # 房价均值
median = []  # 房价中位数
favourate_avg = []  # 房价收藏人数均值
favourate_median = []  # 房价收藏人数中位数
houseidfo = ['2室1厅', '3室1厅', '2室2厅', '3室2厅', '其他']  # 房型定义
houseidfos = ['2.1', '3.1', '2.2', '3.2']
sum_house = [0,  0, 0, 0, 0]  # 各房型数量
price = []  # 房价
fav = []  # 收藏人数
type = []
area = []  # 房间面积
注释写的很清楚了,我的places是为了方便读取这几个csv中文件各自保存的数据(‘白云区’, ‘观山湖区’, ‘花溪区’, ‘南明区’, ‘乌当区’, '云岩区’区的数据):
3:文件操作,打开文件:
def avg(name):
	df = pd.read_csv(str(name)+'.csv', encoding='utf-8')
    pattern = '\d+'
    df['totalPrice/万元'] = df['totalPrice/万元'].str.findall(pattern) # 转换成字符串,并且查找只含数字的项
    df['followInfo'] = df['followInfo'].str.findall(pattern)
    df['houseInfo'] = df['houseInfo'].str.findall(pattern)
使用padas的read_csv方式读取csv文件 name以传参形式迭代传入,也就是一个区一个区的传入主要是为了减少代码量,增加审美。就不必每一次都写几十行代码了
然后是一些匹配,转换成字符串,并且查找只含数字的项。
    for i in range(len(df)):
        if (i + 1) % 2 == 0:
            continue
        else:
            if len(df['totalPrice/万元'][i]) == 2:
                avg_work_year.append(','.join(df['totalPrice/万元'][i]).replace(',', '.'))
                medians.append(float(','.join(df['totalPrice/万元'][i]).replace(',', '.')))
                price.append(','.join(df['totalPrice/万元'][i]).replace(',', '.'))
            if len(df['followInfo'][i]) ==2:
                favourates.append(int(','.join(df['followInfo'][i][:1])))
                fav.append(int(','.join(df['followInfo'][i][:1])))
            if float(','.join(df['houseInfo'][i][:2]).replace(',', '.')) == 2.1:
                k +=1
                sum_houses[0] =k
                type.append(2.1)
            if float(','.join(df['houseInfo'][i][:2]).replace(',', '.')) == 3.1:
                k1 +=1
                sum_houses[1] =k1
                type.append(3.1)
            if float(','.join(df['houseInfo'][i][:2]).replace(',', '.')) == 2.2:
                k3 +=1
                sum_houses[2] =k3
                type.append(2.2)
            if float(','.join(df['houseInfo'][i][:2]).replace(',', '.')) == 3.2:
                k4 +=1
                sum_houses[3] =k4
                type.append(3.2)
            else:
                k4 +=1
                sum_houses[4] = k4
                type.append('other')
            area.append(float(','.join(df['houseInfo'][i][2:4]).replace(',', '.')))
    sum_house[0] =sum_houses[0]
    sum_house[1] = sum_houses[1]
    sum_house[2] = sum_houses[2]
    sum_house[3] = sum_houses[3]
    sum_house[4] = sum_houses[4]

    favourates.sort()
    favourate_median.append(int(np.median(favourates)))
    medians.sort()
    median.append(np.median(medians))
    # price = avg_work_year
    b = len(avg_work_year)
    b1= len(favourates)

    sum = 0
    sum1 = 0
    for i in avg_work_year:
        sum = sum+float(i)
    avgs.append(round(sum/b, 2))
    for i in favourates:
        sum1 = sum1+float(i)
    favourate_avg.append(round(int(sum1/b1), 2))
4:这里是数据筛选的核心部分,我们细说一下:
		if len(df['totalPrice/万元'][i]) == 2:
                avg_work_year.append(','.join(df['totalPrice/万元'][i]).replace(',', '.'))
                medians.append(float(','.join(df['totalPrice/万元'][i]).replace(',', '.')))
                price.append(','.join(df['totalPrice/万元'][i]).replace(',', '.'))
5:这里是获取总价格,并且清洗好,放入前面定义好的数组中,保存好,
if len(df['followInfo'][i]) ==2:
                favourates.append(int(','.join(df['followInfo'][i][:1])))
                fav.append(int(','.join(df['followInfo'][i][:1])))
6:这里是获取总收藏人数,并且清洗好,放入前面定义好的数组中,保存好,
if len(df['followInfo'][i]) ==2:
                favourates.append(int(','.join(df['followInfo'][i][:1])))
                fav.append(int(','.join(df['followInfo'][i][:1])))
            if float(','.join(df['houseInfo'][i][:2]).replace(',', '.')) == 2.1:
                k +=1
                sum_houses[0] =k
                type.append(2.1)
            if float(','.join(df['houseInfo'][i][:2]).replace(',', '.')) == 3.1:
                k1 +=1
                sum_houses[1] =k1
                type.append(3.1)
            if float(','.join(df['houseInfo'][i][:2]).replace(',', '.')) == 2.2:
                k3 +=1
                sum_houses[2] =k3
                type.append(2.2)
            if float(','.join(df['houseInfo'][i][:2]).replace(',', '.')) == 3.2:
                k4 +=1
                sum_houses[3] =k4
                type.append(3.2)
            else:
                k4 +=1
                sum_houses[4] = k4
                type.append('other')
            area.append(float(','.join(df['houseInfo'][i][2:4]).replace(',', '.')))
7:这里是获取房型和面积,清洗好,放入数组中
    favourates.sort()
    favourate_median.append(int(np.median(favourates)))
    medians.sort()
    median.append(np.median(medians))
    # price = avg_work_year
    b = len(avg_work_year)
    b1= len(favourates)

    sum = 0
    sum1 = 0
    for i in avg_work_year:
        sum = sum+float(i)
    avgs.append(round(sum/b, 2))
    for i in favourates:
        sum1 = sum1+float(i)
    favourate_avg.append(round(int(sum1/b1), 2))
8:这里是把上面的信息加工,生成平均数,中位数等。
另外说一下,清洗过程:
’,’.join()是为了筛选出的信息不含中括号和逗号
df[‘houseInfo’][i][2:4]是为了取出相应的数据,使用了python的切片操作
.replace(’,’, ‘.’)是把逗号改成小数点,这样就是我们想要的结果了。
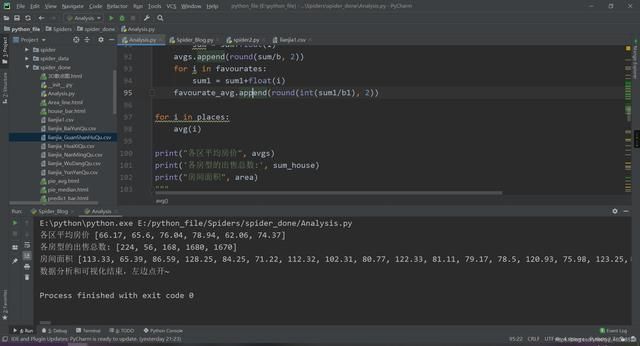
下面执行看一下结果:
数据筛选结束~
由于篇幅过长,贴不出来 需要完整的教程或者源码的加下群:1136192749
