PyTorch里如何利用TensorBoard--详解
通过这份文档的学习,我们会了解到如何往TensorBoard里面送入图片、图表、模型、scalars(损失值、权值、偏置等)、构建embeddings、PR曲线等,其中送入的图片或图表数据主要是多张图片合成的网格图片,利用torchvision.utils.make_grid函数或fig.add_subplot构建,细节内容请往下看。
本片文档来源于PyTorch官方教程,我仅其内容进行部分解读,多数解读是注释在代码行中。
声明:没有耐心看几句英文说明的可以试一下Ctrl + W,我建议大家静下心来学习,不要浮躁。
如果看明白了本文内容,想要更细致地了解Pytorch下TensorBoard的相关用法,可以看官方的Document(https://pytorch.org/docs/stable/tensorboard.html?highlight=tensorboard)
Let’s get started!
在这份文档中,将记录以下几点:
- 读取数据,并作适当的数据转换;
- 设置TensorBoard;
- 写入TensorBoard相关内容;
- 利用TensorBoard查看模型结构;
- 利用TensorBoard创建可视化的交互界面;
特别是在第5点中,我们将看到:
- 查看训练数据的几种方式;
- 在训练时如何追踪模型的性能;
- 训练结束后,如何评估模型的性能。
本文所用数据集为 CIFAR-10。
# imports
import matplotlib.pyplot as plt
import numpy as np

import torch
import torchvision
import torchvision.transforms as transforms # 注意transforms是torchvision里面的工具,主要是为图像开发

import torch.nn as nn
import torch.nn.functional as F
import torch.optim as optim

# transforms
transform = transforms.Compose(
    [transforms.ToTensor(),  # 转变成pytorch类型的tensor,针对图像进行转变,把载入的图像转变成Pytorch格式的tensor,结果为NCHW
    transforms.Normalize((0.5,), (0.5,))]) # 标准化操作

# datasets
trainset = torchvision.datasets.FashionMNIST('./data',# 下载“训练集”/“测试集”,并转变数据形式(对图片格式进行转变)
    download=True,
    train=True,
    transform=transform)
testset = torchvision.datasets.FashionMNIST('./data',
    download=True,
    train=False,
    transform=transform)

# dataloaders
trainloader = torch.utils.data.DataLoader(trainset, batch_size=4,
                                        shuffle=True, num_workers=2)


testloader = torch.utils.data.DataLoader(testset, batch_size=4,
                                        shuffle=False, num_workers=2)  # 这里面有一些讲究,尤其是多进程相关的,回过头来可以再看

# constant for classes
classes = ('T-shirt/top', 'Trouser', 'Pullover', 'Dress', 'Coat',
        'Sandal', 'Shirt', 'Sneaker', 'Bag', 'Ankle Boot')

# helper function to show an image
# (used in the `plot_classes_preds` function below)
def matplotlib_imshow(img, one_channel=False):
    if one_channel:
        img = img.mean(dim=0) # 其实就是一种数据维度的压缩,可以替换为img = img.squeeze(0)
    img = img / 2 + 0.5     # unnormalize 反归一化,反向操作
    npimg = img.numpy()
    if one_channel:
        plt.imshow(npimg, cmap="Greys")
    else:
        plt.imshow(np.transpose(npimg, (1, 2, 0))) # 转置回去,这是由于pytorch tensor和pil数据的内部维度排列有些差异
接下来定义模型架构:
class Net(nn.Module):  # 继承nn.Module模块
    def __init__(self):
        super(Net, self).__init__()
        self.conv1 = nn.Conv2d(1, 6, 5)
        self.pool = nn.MaxPool2d(2, 2)  # 这个虽然pool只是定义了一次,但会用到多次
        self.conv2 = nn.Conv2d(6, 16, 5)
        self.fc1 = nn.Linear(16 * 4 * 4, 120)
        self.fc2 = nn.Linear(120, 84)
        self.fc3 = nn.Linear(84, 10)

    def forward(self, x):
        x = self.pool(F.relu(self.conv1(x)))
        x = self.pool(F.relu(self.conv2(x)))
        x = x.view(-1, 16 * 4 * 4)
        x = F.relu(self.fc1(x))
        x = F.relu(self.fc2(x))
        x = self.fc3(x)
        return x

net = Net()
接下来定义优化器(optimizer)和损失函数(criterion):
criterion = nn.CrossEntropyLoss() #结合了softmax和negative log loss
optimizer = optim.SGD(net.parameters(), lr=0.001, momentum=0.9)
1. TensorBoard setup
接下来我们设置TensorBoard. importing tensorboard from torch.utils and defining a SummaryWriter, our key object for writing information to TensorBoard.
from torch.utils.tensorboard import SummaryWriter

# default `log_dir` is "runs" - we'll be more specific here
writer = SummaryWriter('runs/fashion_mnist_experiment_1') # 创建一个folder存储需要记录的数据
Note that this line alone creates a runs/fashion_mnist_experiment_1 folder.
2. Writing to TensorBoard
Now let’s write an image to our TensorBoard - specifically, a grid - using make_grid.
网格化记录图片
# get some random training images
dataiter = iter(trainloader)      # 通过使用函数iter(),将返回一个iterator迭代器(可以使用.__next__()的对象)
images, labels = dataiter.next()

# create grid of images
img_grid = torchvision.utils.make_grid(images) # 定义网格图片,网格化显示a batch of images.

# show images
matplotlib_imshow(img_grid, one_channel=True) # 我们的数据是单通道图片

# write to tensorboard
writer.add_image('four_fashion_mnist_images', img_grid)
!tensorboard --logdir=runs # 在命令行运行不需要加感叹号!
下图实在Terminal中运行tensorboard --logdir=runs

然后按下Ctrl再点击terminal中显示的网站即可打开浏览器进入TensorBoard界面。
你可以在TensorBoard的IMAGES下看到如下结果:

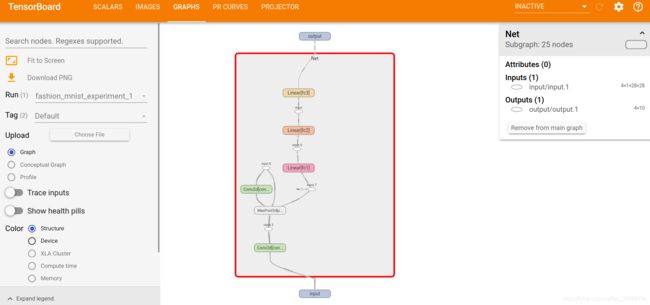
3. Inspect the model using TensorBoard
One of TensorBoard’s strengths is its ability to visualize complex model structures. Let’s visualize the model we built.
writer.add_graph(net, images) # net是我们上边构建的模型class,images是输出的数据
writer.close()
Go ahead and double click on “Net” to see it expand, seeing a detailed view of the individual operations that make up the model.

TensorBoard has a very handy feature for visualizing high dimensional data such as image data in a lower dimensional space; we’ll cover this next.
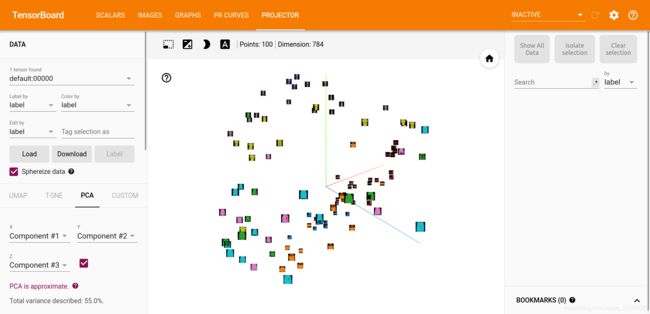
4. Adding a “Projector” to TensorBoard
We can visualize the lower dimensional representation of higher dimensional data via the add_embeddingmethod
# helper function
def select_n_random(data, labels, n=100):
    '''
    Selects n random datapoints and their corresponding labels from a dataset
    '''
    assert len(data) == len(labels)

    perm = torch.randperm(len(data)) # Returns a random permutation of integers from ``0`` to ``n - 1``.
    return data[perm][:n], labels[perm][:n]

# select random images and their target indices
images, labels = select_n_random(trainset.data, trainset.targets)

# get the class labels for each image
class_labels = [classes[lab] for lab in labels]

# log embeddings
features = images.view(-1, 28 * 28)
writer.add_embedding(features,
                    metadata=class_labels, # metadata:描述数据的数据就是元数据;这里就是类型标签
                    label_img=images.unsqueeze(1)) # 在维度1位置插入一个size为1的维度,相当于多包了一层。扩展成四个维度NCHW,之前是NHW三个维度,而label_img要求NCHW四个维度
writer.close()

从这里我们可以看到,TensorBoard将784维的高维图片数据通过PCA映射到三维去查看。这个工作是TensorBoard完成的,我们仅仅是把数据传递进去。
Now we’ve thoroughly inspected our data, let’s show how TensorBoard can make tracking model training and evaluation clearer, starting with training.
5. Tracking model training with TensorBoard
Now, we’ll log the running loss to TensorBoard, along with a view into the predictions the model is making via the plot_classes_preds function.
# helper functions
def images_to_probs(net, images):
   '''
   Generates predictions and corresponding probabilities from a trained
   network and a list of images
   '''
   output = net(images)
   # convert output probabilities to predicted class
   _, preds_tensor = torch.max(output, 1)
   preds = np.squeeze(preds_tensor.numpy())
   return preds, [F.softmax(el, dim=0)[i].item() for i, el in zip(preds, output)] # 返回预测结果及概率
   # .item()返回的是一个标量,这个标量来源于只含一个数的tensor

def plot_classes_preds(net, images, labels):
   '''
   Generates matplotlib Figure using a trained network, along with images
   and labels from a batch, that shows the network's top prediction along
   with its probability, alongside the actual label, coloring this
   information based on whether the prediction was correct or not.
   Uses the "images_to_probs" function.
   '''
   preds, probs = images_to_probs(net, images)
   # plot the images in the batch, along with predicted and true labels
   fig = plt.figure(figsize=(10, 10))
   for idx in np.arange(4):
       ax = fig.add_subplot(1, 4, idx+1, xticks=[], yticks=[])
       matplotlib_imshow(images[idx], one_channel=True)   # 注意该函数是在当前的子图环境中绘图的
       ax.set_title("{0}, {1:.1f}%\n(label: {2})".format(
           classes[preds[idx]],
           probs[idx] * 100.0,
           classes[labels[idx]]),
                   color=("green" if preds[idx]==labels[idx].item() else "red"))
   return fig
Finally, let’s train the model using the model training code constructed above, and then write results to TensorBoard every 1000 batches instead of printing to console; this is done using the add_scalar function.
In addition, as we train, we’ll generate an image showing the model’s predictions vs. the actual results on the four images included in that batch.
running_loss = 0.0
for epoch in range(1):  # loop over the dataset multiple times

    for i, data in enumerate(trainloader, 0):

        # get the inputs; data is a list of [inputs, labels]
        inputs, labels = data

        # zero the parameter gradients
        optimizer.zero_grad()

        # forward + backward + optimize
        outputs = net(inputs)
        loss = criterion(outputs, labels)
        loss.backward()
        optimizer.step() # 这一步已经包含torch.no_grad()

        running_loss += loss.item()
        if i % 1000 == 999:    # every 1000 mini-batches...
            # ...log the running loss
            writer.add_scalar('training loss_again',
                            running_loss / 1000,
                            epoch * len(trainloader) + i)

            # ...log a Matplotlib Figure showing the model's predictions on a
            # random mini-batch
            writer.add_figure('predictions vs. actuals',   # 增加一些图到writer里
                            plot_classes_preds(net, inputs, labels),
                            global_step=epoch * len(trainloader) + i)  # 全局步的记录
            #请注意:add_figure方法里面的第二个位置参数的参数名是figure,他要求传入的object是
            # matplotlib.pyplot.figure or list of figures: Figure or a list of figures
            # 该段代码跑完后,notebook里面其实是没有任何figure显示,这是为何呢?我猜是
            # writer.add_figure自动将其关闭了
            running_loss = 0.0
print('Finished Training')
You can now look at the scalars tab to see the running loss plotted over the 15,000 iterations of training:

In addition, we can look at the predictions the model made on arbitrary batches throughout learning. See the “Images” tab and scroll down under the predictions vs. actuals visualization to see this; this shows us that, for example, after just 3000 training iterations, the model was already able to distinguish between visually distinct classes such as shirts, sneakers, and coats, though it isn’t as confident as it becomes later on in training.
 请注意,上面的橘黄色进度条可以拖动,从而能看到不同step的结果。
Here, we’ll use TensorBoard to plot precision-recall curves (good explanation here) for each class.
6. Assessing trained models with TensorBoard
# 1. gets the probability predictions in a test_size x num_classes Tensor
# 2. gets the preds in a test_size Tensor
# takes ~10 seconds to run
class_probs = []
class_preds = []
gt_labels = []
with torch.no_grad():
    for data in testloader:
        images, labels = data
#         print(images.shape,labels.shape)
        output = net(images)
        class_probs_batch = [F.softmax(el, dim=0) for el in output]  # 这里返回来的是4x10的tensor
        _, class_preds_batch = torch.max(output, 1)
#         print(class_preds_batch)
        class_probs.append(class_probs_batch)
        class_preds.append(class_preds_batch)
        gt_labels.append(labels)

# 每一次stack完后,会产生一个4x1x10的返回结果;在cat之前,是一个size为(n/4,4,1,10)的sequence,经过cat后,变成了一个(n,1,10)的tensor
# 在送进tensor.cat前,必须是一个sequence,或者是一个可迭代对象iterable。本质上我们是想把诸如a、b、c这样的tensor进行cat,只不过
# 输入的时候必须把他们装到一个可迭代对象中,这样函数才能遍历,这同样也是torch.stack的机制
test_probs = torch.cat([torch.stack(batch) for batch in class_probs])
test_preds = torch.cat(class_preds) # 输出结果为(n,1)的tensor
gt_labels = torch.cat(gt_labels)
# helper function
def add_pr_curve_tensorboard(class_index, test_probs, gt_labels, global_step=0):
    '''
    Takes in a "class_index" from 0 to 9 and plots the corresponding
    precision-recall curve
    '''
#     tensorboard_preds = tensorboard_preds == class_index # 这行代码明显是错的,不符合precision-recall curve的定义
    gt_labels = gt_labels == class_index                 # 这行是正确的写法

    tensorboard_probs = test_probs[:, class_index]

    writer.add_pr_curve(classes[class_index],
                        gt_labels,
                        tensorboard_probs,
                        global_step=global_step)
    writer.close()
# np.random.randint
# plot all the pr curves
for i in range(len(classes)):
    add_pr_curve_tensorboard(i, test_probs, gt_labels, i)
You will now see a PR Curves tab that contains the precision-recall curves for each class. Go ahead and poke around; you’ll see that on some classes the model has nearly 100% “area under the curve”, whereas on others this area is lower.

And that’s an intro to TensorBoard and PyTorch’s integration with it. Of course, you could do everything TensorBoard does in your Jupyter Notebook, but with TensorBoard, you gets visuals that are interactive by default.
