使用matplotlib让你的数据更加生动(一)
1 引言
Matplotlib 是 Python 中最受欢迎的数据可视化软件包之一,支持跨平台运行,它是 Python 常用的 2D 绘图库,同时它也提供了一部分 3D 绘图接口。Matplotlib 通常与 NumPy、Pandas 一起使用,是数据分析中不可或缺的重要工具之一。
本文就日常生活中常见的业务场景进行展开讨论,更详尽的说明可以参考文档。
2 折线图
折线图(line chart)是我们日常工作、学习中经常使用的一种图表,它可以直观的反映数据的变化趋势。
- 直线:左上直线图形显示。
- 曲线:右上带有样式变化和标记的折线预览。
代码如下:
def draw_line():
    N = 8
    t = np.linspace(0, 1, N)
    fig, (axA, axB) = plt.subplots(1, 2)
    # Line
    axA.plot(t, t, marker = 'o')
    axA.set_title('line')
    # Curve
    axB.plot(t, t, linestyle='--', marker='*',c='r', label='linear')
    axB.plot(t, t**2, linestyle='-.', marker='D',c='c', label='quadratic')
    axB.plot(t, t**3, linestyle=':', marker='^',c='y', label='cubic')
    axB.set_title('Curve')
    plt.legend()
    plt.show()
函数说明:
plot([x], y, [fmt], data=None, **kwargs)
- 可选参数[fmt] 是一个字符串来定义图的基本属性如:颜色(color),点型(marker),线型(linestyle)
- 对于颜色 color=‘r’ 代表red 表示红色;color=‘c’ 代表cyan 表示蓝绿;color=‘y’ 代表yellow表示黄色
- 对于线型 linestyle=’–’ 代表dashed line style 为虚线;linestyle=’-.‘代表 dash-dot line style 为点画线; linestyle=’:’ 代表dotted line style 为点线
3 散点图
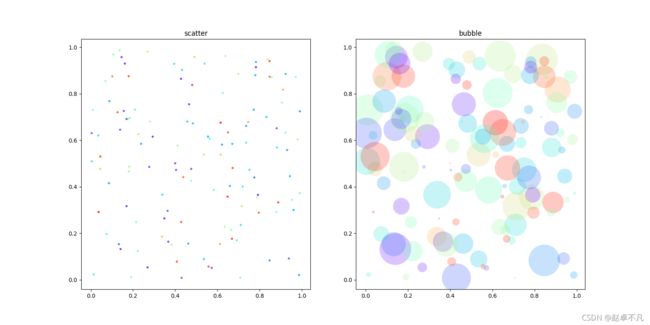
散点图用于在水平轴和垂直轴上绘制数据点,它表示了因变量随自变量变化的趋势。通俗地讲,它反映的是一个变量受另一个变量的影响程度。
可视化结果:
- 散点图:左上散点图可视化,带有颜色变化。
- 气泡图:右上带有颜色变化和刻度的气泡图。
代码如下:
def  draw_scatter():
    N = 128
    x = np.random.rand(N)
    y = np.random.rand(N)
    c = np.random.rand(N)
    s = np.random.rand(N)
    s = np.pi*(32*s)**2

    cmapDisp = cm.get_cmap('rainbow')
    fig, (axA, axB) = plt.subplots(1, 2)
    # scatter
    axA.scatter(x, y, s=8,c=cmapDisp(c),alpha=0.75)
    axA.set_title('scatter')
    # bubble
    axB.scatter(x, y, c=cmapDisp(c), s=s, alpha=0.25, edgecolors='none')
    axB.set_title('bubble')
    plt.show()
函数说明:
scatter(x, y, s=None, c=None, marker=None, cmap=None, norm=None, vmin=None, vmax=None, alpha=None, linewidths=None, verts=None, edgecolors=None, *, data=None, **kwargs)
- x,y:表示的是大小为(n,)的数组,也就是我们即将绘制散点图的数据点
- s:是一个标量实数或者是一个数组大小为(n,),表示点的大小。
- c:表示的是颜色,是一个可选项。默认是蓝色’b’,表示的是标记的颜色,或者可以是一个表示颜色的字符,或者是一个长度为n的表示颜色的序列等等
- marker:表示的是标记的样式,默认的是’o’。
- alpha:实数,0-1之间。点的透明度,透明度设置的好能够使图好看。
4 柱状图
柱状图是一种用矩形柱来表示数据分类的图表,柱状图可以垂直绘制,也可以水平绘制,它的高度与其所表示的数值成正比关系。柱状图显示了不同类别之间的比较关系,图表的水平轴 X 指定被比较的类别,垂直轴 Y 则表示具体的类别值。
- 柱状图:左上图形以组合在一起的平行柱状图显示。
- 堆叠柱状图:右上图形显示在堆叠的柱状图上。
代码如下:
def  draw_bar():
    N = 8
    Hx = np.random.randint(18, 65, size=N)
    Mx = np.random.randint(18, 65, size=N)
    Hs = np.random.randint(1, 5, size=N)
    Ms = np.random.randint(1, 5, size=N)
    indice = np.arange(N) + 1
    igrupos = ['G{}'.format(g) for g in indice]
    iidades = np.arange(0, 80, 5)
    larg = 0.25
    fig, (axA, axB) = plt.subplots(1, 2)
    # Bar
    axA.bar(indice - larg, Hx, width=larg, yerr=Hs,color='c', align='edge', label='man')
    axA.bar(indice, Mx, width=larg, yerr=Ms, color='r', align='edge', label='women')
    axA.set_title('Bar')
    axA.set_xticks(indice)
    axA.set_yticks(iidades)
    axA.set_xticklabels(igrupos)
    axA.legend()
    # Barras
    axB.bar(indice, Hx, color='c', label='man', yerr=Hs)
    axB.bar(indice, Mx, color='r', bottom=Hx, label='women', yerr=Ms)
    axB.set_title('Barras ')
    axB.set_xticks(indice)
    axB.set_xticklabels(igrupos)
    axB.set_yticks(iidades*2)
    axB.legend()
    plt.show()
函数说明:
bar(x, height, width, bottom, align)
- x :一个标量序列,代表柱状图的x坐标,默认x取值是每个柱状图所在的中点位置,或者也可以是柱状图左侧边缘位置。
- height: 一个标量或者是标量序列,代表柱状图的高度。
- width: 可选参数,标量或类数组,柱状图的默认宽度值为 0.8。
- bottom: 可选参数,标量或类数组,柱状图的y坐标默认为None。
- algin: 有两个可选项 {“center”,“edge”},默认为 ‘center’,该参数决定 x 值位于柱状图的位置。
- bottom: 该参数可以指定柱状图开始堆叠的起始值,一般从底部柱状图的最大值开始,依次类推
- yerr: 可选参数, 这里针对垂直型误差,以误差棒的形式显示
5 饼状图
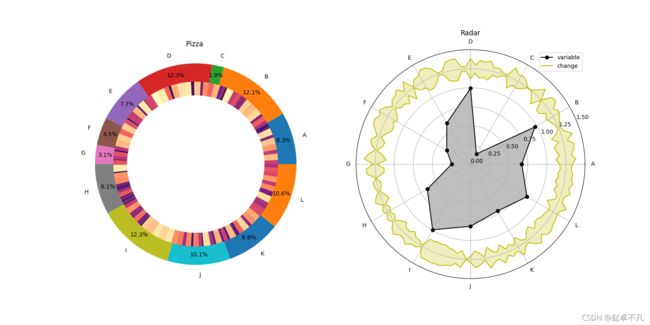
饼状图用来显示一个数据系列,具体来说,饼状图显示一个数据系列中各项目的占项目总和的百分比。
- 饼图:左上玫瑰图显示两层信息(外层标签和内层比例分布)。
- 雷达图:右上雷达图形显示,具有基于中心的值和基于径向的变化。
代码如下:
def test_pie():
    etiqueta = list('ABCDEFGHIJKL')
    M, N = 128, len(etiqueta)
    valor = np.random.random(N)*0.9 + 0.1
    var = np.random.random(M)
    # param
    cmapRadial = cm.get_cmap('magma')
    theta = 2*np.pi*np.arange(N)/N
    omega = 2*np.pi*np.arange(M)/M
    valor_ = np.append(valor, [valor[0]])
    var_ = np.append(var, [var[0]])
    theta_ = np.append(theta, [theta[0]])
    omega_ = np.append(omega, [omega[0]])
    raio = 1.25
    mult = 0.15
    # draw
    fig = plt.figure()
    axA = fig.add_subplot(121, aspect='equal')
    axB = fig.add_subplot(122, projection='polar')
    # Pizza
    axA.pie(valor, labels=etiqueta, pctdistance=0.9,autopct='%1.1f%%', radius=1.1)
    axA.pie(var, radius=0.9, colors=cmapRadial(var))
    axA.set_title('Pizza')
    centro = plt.Circle((0,0), 0.75, fc='white')
    axA.add_patch(centro)
    # Radar
    axB.plot(theta_, valor_, marker='o', color='black', label='variable')
    axB.fill_between(theta_, 0, valor_, facecolor='black', alpha=0.25)
    axB.plot(omega_, raio + var_*mult, color='y', label='change')
    axB.plot(omega_, raio - var_*mult, color='y')
    axB.fill_between(omega_, raio - var_*mult, raio + var_*mult,facecolor='y', alpha=0.25)
    axB.set_title('Radar')
    axB.set_xticks(theta)
    axB.set_xticklabels(etiqueta)
    axB.set_rticks(np.linspace(0, 1.5, 7))
    axB.legend()
    plt.show()
函数说明:
pie(x, labels=None, colors=None, autopct=None, pctdistance=0.6, labeldistance=1.1, radius=None)
- x: 数组序列,数组元素对应扇形区域的数量大小。
- labels: 列表字符串序列,为每个扇形区域备注一个标签名字。
- color : 为每个扇形区域设置颜色,默认按照颜色周期自动设置。
- autopct :控制饼图内百分比设置,可以使用format字符串或者format function
'%1.1f’指小数点前后位数(没有用空格补齐) - labeldistance :label标记的绘制位置,相对于半径的比例,默认值为1.1, 如<1则绘制在饼图内侧;
- pctdistance :类似于labeldistance,指定autopct的位置刻度,默认值为0.6;
- radius :控制饼图半径,默认值为1;
6 总结
本文详细地介绍了使用matplotlib画折线图、散点图、饼状图以及柱状图的样例,并给出了相关可视化效果。
您学废了吗?
关注公众号《AI算法之道》,获取更多AI算法资讯。
![]()
注: 关注公众号,后台回复 画图 , 可获取完整代码


