今天我来分享一些Python办公自动化的方法,欢迎收藏学习,喜欢点赞支持,欢迎畅聊。
Openpyxl
Openpyxl 可以说是 Python 中最通用的工具模块了,它使与 Excel 交互pip install openpyxl
pip install python-docx简直就像在公园里漫步一样。 有了它,你就可以读写所有当前和传统的 excel 格式,即 xlsx 和 xls。
Openpyxl 允许填充行和列、执行公式、创建 2D 和 3D 图表、标记轴和标题,以及大量可以派上用场的其他功能。最重要的是,这个包使你能够在 Excel 中迭代无数行和列,从而使你免于所有烦人的数字运算和绘图。
Python-docx
Python-docx 这个包之于 Word,就像 Openpyxl 之于 Excel。 如果你还没有研究过他们的文档,那么可能应该看看。毫不夸张地说,自从我开始使用 Python 以来,Python-docx 是我使用过的最简单、最不言自明的工具包之一。
它允许你通过插入文本、填写表格并将图像自动渲染到报告中来自动生成文档,而无需任何开销。
让我们创建我们自己的自动化管道。 继续并启动 Anaconda 并安装以下软件包:
pip install openpyxl
pip install python-docx
微软 Excel 自动化
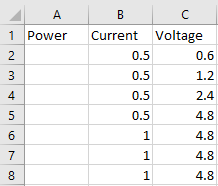
我们加载一个已经创建好的 Excel 工作簿(如下所示):
workbook = xl.load_workbook('Book1.xlsx')
sheet_1 = workbook['Sheet1']
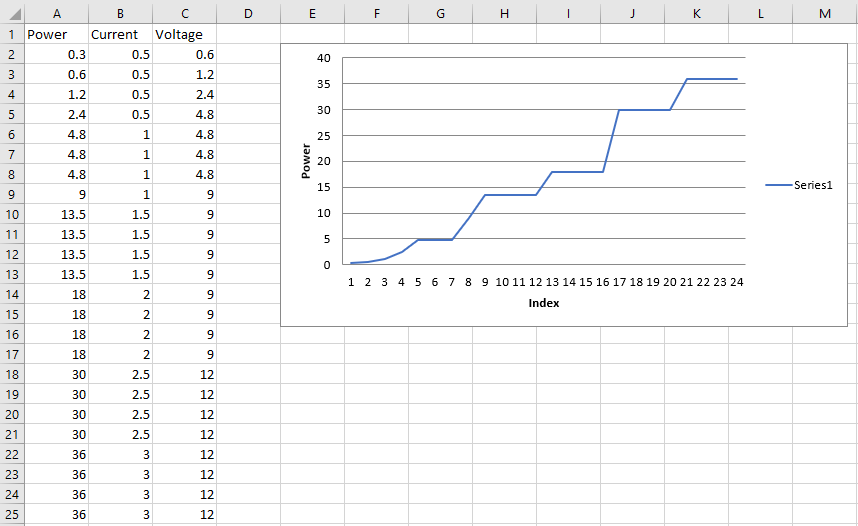
我们将遍历电子表格中的所有行,通过将电流乘以电压来计算,插入功率值:
for row in range(2, sheet_1.max_row + 1):
    current = sheet_1.cell(row, 2)
    voltage = sheet_1.cell(row, 3)
    power = float(current.value) * float(voltage.value)
    power_cell = sheet_1.cell(row, 1)
    power_cell.value = power
完成后,我们将使用计算的功率值生成一个折线图,该折线图将插入到指定的单元格中,如下所示:
values = Reference(sheet_1, min_row = 2, max_row = sheet_1.max_row, min_col = 1, max_col = 1)
chart = LineChart()
chart.y_axis.title = 'Power'
chart.x_axis.title = 'Index'
chart.add_data(values)
sheet_1.add_chart(chart, 'e2')
workbook.save('Book1.xlsx')
提取图表
现在我们已经生成了图表,我们需要将其提取为图像,以便我们可以在 Word 报告中使用它。
首先,我们将声明 Excel 文件的确切位置以及应保存输出图表图像的位置:
input_file = "C:/Users/.../Book1.xlsx"
output_image = "C:/Users/.../chart.png"
然后使用以下方法访问电子表格:
operation = win32com.client.Dispatch("Excel.Application")
operation.Visible = 0
operation.DisplayAlerts = 0
workbook_2 = operation.Workbooks.Open(input_file)
sheet_2 = operation.Sheets(1)
随后,你可以遍历电子表格中的所有图表对象并将它们保存在指定位置,如下所示:
for x, chart in enumerate(sheet_2.Shapes):
    chart.Copy()
    image = ImageGrab.grabclipboard()
    image.save(output_image, 'png')
    pass
workbook_2.Close(True)
operation.Quit()
微软 word 自动化
现在我们已经生成了我们的图表图像,我们必须创建一个模板文档,它是一个普通的 Microsoft Word 文档 (.docx),完全按照我们希望报告的外观制定,包括字体、字体大小、格式和页面结构 .
然后我们需要做的就是为我们的自动化内容创建占位符,即表格值和图像,并使用如下所示的变量名称声明它们。
任何自动化内容都可以在一对双大括号 { {variable_name}} 内声明,包括文本和图像。 对于表格,你需要创建一个包含所有列的模板行的表格,然后需要使用以下符号在上一行和下一行附加:
{%tr for item in variable_name %}
最后一行:
%tr endfor %}
在上图中,变量名是
- table_contents 用于存储表格数据的 Python 字典
- 字典键的索引(第一列)
- 字典值的功率、电流和电压(第二、第三和第四列)
然后我们将我们的模板文档导入 Python 并创建一个字典来存储我们表的值:
template = DocxTemplate('template.docx')
table_contents = []
for i in range(2, sheet_1.max_row + 1):
    table_contents.append({
        'Index': i-1,
        'Power': sheet_1.cell(i, 1).value,
        'Current': sheet_1.cell(i, 2).value,
        'Voltage': sheet_1.cell(i, 3).value
        })
接下来,我们将导入之前由 Excel 生成的图表图像,并将创建另一个字典来实例化模板文档中声明的所有占位符变量:
image = InlineImage(template,'chart.png',Cm(10))
context = {
    'title': 'Automated Report',
    'day': datetime.datetime.now().strftime('%d'),
    'month': datetime.datetime.now().strftime('%b'),
    'year': datetime.datetime.now().strftime('%Y'),
    'table_contents': table_contents,
    'image': image
    }
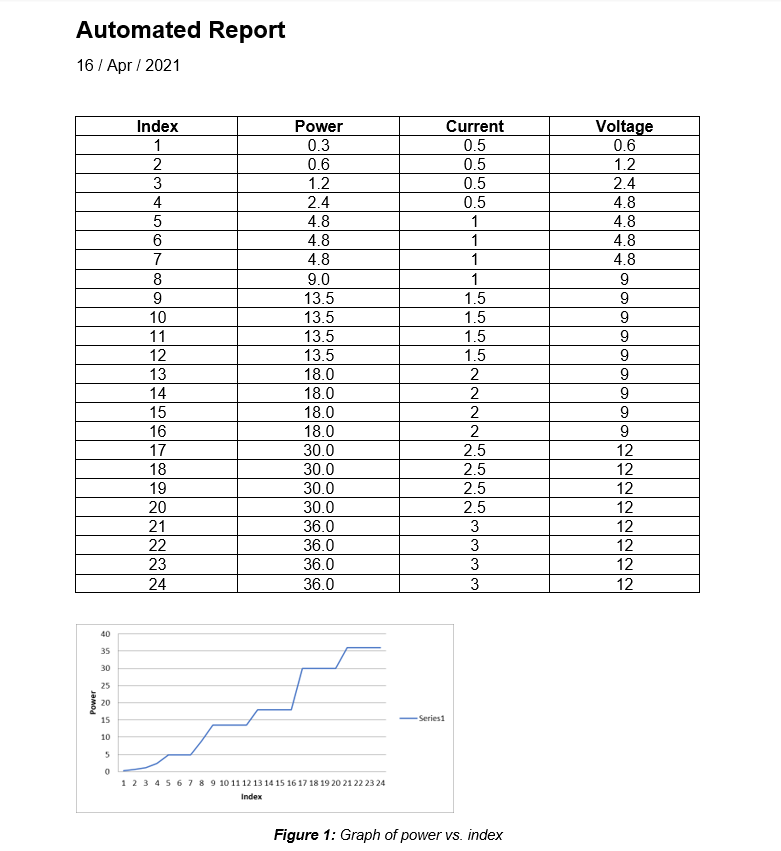
最后,我们将使用我们的值表和图表图像呈现报告:
template.render(context)
template.save('Automated_report.docx')
总结
就这样,自动生成的 Microsoft Word 报告包含数字和在 Microsoft Excel 中创建的图表。有了它,你就拥有了一个完全自动化的管道,可用于创建可能需要的尽可能多的表格、图表和文档。
源码如下
import openpyxl as xl
from openpyxl.chart import LineChart, Reference

import win32com.client
import PIL
from PIL import ImageGrab, Image
import os
import sys

from docx.shared import Cm
from docxtpl import DocxTemplate, InlineImage
from docx.shared import Cm, Inches, Mm, Emu
import random
import datetime
import matplotlib.pyplot as plt


######## Generate automated excel workbook ########

workbook = xl.load_workbook('Book1.xlsx')
sheet_1 = workbook['Sheet1']

for row in range(2, sheet_1.max_row + 1):
    current = sheet_1.cell(row, 2)
    voltage = sheet_1.cell(row, 3)
    power = float(current.value) * float(voltage.value)
    power_cell = sheet_1.cell(row, 1)
    power_cell.value = power

values = Reference(sheet_1, min_row = 2, max_row = sheet_1.max_row, min_col = 1, max_col = 1)
chart = LineChart()
chart.y_axis.title = 'Power'
chart.x_axis.title = 'Index'
chart.add_data(values)
sheet_1.add_chart(chart, 'e2')

workbook.save('Book1.xlsx')


######## Extract chart image from Excel workbook ########

input_file = "C:/Users/.../Book1.xlsx"
output_image = "C:/Users/.../chart.png"

operation = win32com.client.Dispatch("Excel.Application")
operation.Visible = 0
operation.DisplayAlerts = 0

workbook_2 = operation.Workbooks.Open(input_file)
sheet_2 = operation.Sheets(1)

for x, chart in enumerate(sheet_2.Shapes):
    chart.Copy()
    image = ImageGrab.grabclipboard()
    image.save(output_image, 'png')
    pass

workbook_2.Close(True)
operation.Quit()


######## Generating automated word document ########

template = DocxTemplate('template.docx')

#Generate list of random values
table_contents = []

for i in range(2, sheet_1.max_row + 1):

    table_contents.append({
        'Index': i-1,
        'Power': sheet_1.cell(i, 1).value,
        'Current': sheet_1.cell(i, 2).value,
        'Voltage': sheet_1.cell(i, 3).value
        })

#Import saved figure
image = InlineImage(template,'chart.png',Cm(10))

#Declare template variables
context = {
    'title': 'Automated Report',
    'day': datetime.datetime.now().strftime('%d'),
    'month': datetime.datetime.now().strftime('%b'),
    'year': datetime.datetime.now().strftime('%Y'),
    'table_contents': table_contents,
    'image': image
    }

#Render automated report
template.render(context)
template.save('Automated_report.docx')
如果你想了解有关数据可视化和 Python 的更多信息,请加入技术交流群。
技术交流
欢迎转载、收藏、有所收获点赞支持一下!
到此这篇关于Python 自动化处理Excel和Word实现自动办公的文章就介绍到这了,更多相关Python 自动化办公内容请搜索脚本之家以前的文章或继续浏览下面的相关文章希望大家以后多多支持脚本之家!


