基于OpenCV的计算机视觉入门(3)图像特效
灰度处理
import cv2
import numpy as np
#方法一 实现灰度处理
img0 =cv2.imread('haha.png',0)
img1=cv2.imread('haha.png',1)
print(img0.shape)
print(img1.shape)
cv2.imshow('0',img0)#灰度
cv2.imshow('1',img1)#彩色
cv2.waitKey(10000)
import cv2
import numpy as np
#方法二 cvtcolor
img = cv2.imread('haha.png',1)
dat = cv2.cvtColor(img,cv2.COLOR_BGR2GRAY)
#颜色空间转换 第二个参数为转换方式
cv2.imshow('gary',dat)
cv2.waitKey(10000)#方法3 RGB R=G=B GRAY
import cv2
import numpy as np
img = cv2.imread('haha.png',1)
imgInfo =img.shape
height= imgInfo[0]
width= imgInfo[1]
dat= np.zeros((height,width,3) ,np.uint8)
for i in range(0,height):
for j in range(0,width):
(b,g,r) =img [i,j]
gray = (int(b)+int(g)+int (r) )/3
dat[i,j]=np.uint8(gray)
cv2.imshow('gary',dat)
cv2.waitKey(10000)虽然不知道什么鬼,仍然觉得很厉害…
import cv2
import numpy as np
#方法4  心理学公式 gary= r*0.299+g*0.587+b*0.114

img = cv2.imread('haha.png',1)
imgInfo =img.shape
height= imgInfo[0]
width= imgInfo[1]
dat= np.zeros((height,width,3) ,np.uint8)
for i in range(0,height):
    for j in range(0,width):
        (b,g,r) =img [i,j]
        b=int(b)
        g=int(g)
        r=int(r)
        gray = r*0.299+g*0.587+b*0.114
        dat[i,j]=np.uint8(gray)
cv2.imshow('gary',dat)
cv2.waitKey(10000)
算法优化
import cv2
import numpy as np
#算法优化   定点> 浮点  +- 大于*/

img = cv2.imread('haha.png',1)
imgInfo =img.shape
height= imgInfo[0]
width= imgInfo[1]
dat= np.zeros((height,width,3) ,np.uint8)
for i in range(0,height):
    for j in range(0,width):
        (b,g,r) =img [i,j]
        b=int(b)
        g=int(g)
        r=int(r)
        gray = (r*1+g*2+b*1)/4  #意思就是  rgb值乘以4  又除以4
        #gray = r*0.299+g*0.587+b*0.114   0.299*4
        dat[i,j]=np.uint8(gray)
cv2.imshow('gary',dat)
cv2.waitKey(10000)
效果和原来差不多。相当于把浮点变成了定点。
gray = (r+(g<<1)+b)>>2 定点运算还可继续变为移位运算。
如果对于前面的转换公式有精度要求 ,可以乘以1000 、100….
颜色反转
- 灰度图片的颜色反转
import cv2
import numpy as np
#灰度图片的颜色反转
img = cv2.imread('haha.png',1)
imgInfo =img.shape
height= imgInfo[0]
width= imgInfo[1]
gray =cv2.cvtColor(img,cv2.COLOR_BGR2GRAY)
dst= np.zeros((height,width,1),np.uint8)
for i in range(0,height):
    for j in range(0,width):
        grayPixel =gray[i,j]
        dst[i,j] =255-grayPixel
cv2.imshow('gary',dst)
cv2.waitKey(10000)马赛克效果
import cv2
import numpy as np
img = cv2.imread('timg.jpeg',1)
imgInfo =img.shape
height= imgInfo[0]
width= imgInfo[1]
for m in range(100,300):
    for n in range(100,200):
        if m%10==0 and n%10==0:
            for i in range(0,10):
                for j in range(0,10):
                    (b,g,r) = img[m,n]
                    img[i+m,j+n] =(b,g,r)
cv2.imshow('masaike',img)
cv2.waitKey(10000)
毛玻璃
import cv2
import numpy as np
import random
from numpy.polynomial.tests.test_classes import random
img = cv2.imread('timg.jpeg',1)
imgInfo =img.shape
height= imgInfo[0]
width= imgInfo[1]
dst =np.zeros((height,width,3),np.uint8)
mm=8  #水平方向和竖直方向都可能是8
for m in range (0,height-mm):
    for n in range (0,width-mm):
        index=  int(np.random.random()*8)
        (b,g,r)= img [m+index,n+index]
        dst[m,n]=(b,g,r)
cv2.imshow('masaike',dst)
cv2.waitKey(10000)
图片融合
图片融合前提,大小一定要一致,roi 抠出来一块图然后融合
dst =src1*a + src2*(1-a) (0
import cv2
import numpy as np
#图片融合前提,大小一定要一致
#  dst =src1*a + src2*(1-a)
img0=cv2.imread('1.png',1)
img1=cv2.imread('2.png',1)
imgInfo=img0.shape
height=imgInfo[0]
width=imgInfo[1]
##roi  抠出来一块图然后融合
roiH=int(height)
roiW=int(width)
img0ROI=img0[0:roiH,0:roiW]
img1ROI=img1[0:roiH,0:roiW]

#dst
dst=np.zeros((roiH,roiW,3),np.uint8)
dst=cv2.addWeighted(img0ROI,0.5,img1ROI,0.5,0)
cv2.imshow('masaike',dst)
cv2.waitKey(10000)
效果如图

关于这个函数的实现可以看文章《图片融合 addWeighted》
边缘检测
边缘检测的是指是对图片做卷积运算。
实现步骤:
1. 图像灰度处理
2. 高斯滤波,可以去掉噪声干扰
3. 调用canny方法,实现边缘检测
import cv2
import numpy as np
import random

img=cv2.imread('haha.png',1)
imgInfo =img.shape
height= imgInfo[0]
width= imgInfo[1]
cv2.imshow('src',img)
gray=cv2.cvtColor(img,cv2.COLOR_BGR2GRAY)
imgG=cv2.GaussianBlur(gray,(3,3),0)#高斯滤波
#调用canny
dst=cv2.Canny(img,50,50)#第一个参数  图片参数  第二第三是图片的

cv2.imshow('masaike',dst)
cv2.waitKey(10000)
sobel算子
Sobel 算子是一个离散微分算子 (discrete differentiation operator)。 它结合了高斯平滑和微分求导,用来计算图像灰度函数的近似梯度。 梯度值的大变预示着图像中内容的显著变化。
1. 算子模板
2. 图片卷积
3. 阈值判断
下面是OpenCV官方文档中的一些介绍:
You can easily notice that in an edge, the pixel intensity changes in a notorious way. A good way to express changes is by using derivatives. A high change in gradient indicates a major change in the image.
To be more graphical, let’s assume we have a 1D-image. An edge is shown by the “jump” in intensity in the plot below:

The edge “jump” can be seen more easily if we take the first derivative (actually, here appears as a maximum)

So, from the explanation above, we can deduce that a method to detect edges in an image can be performed by locating pixel locations where the gradient is higher than its neighbors (or to generalize, higher than a threshold).
Assuming that the image to be operated is I :
We calculate two derivatives:
- Horizontal changes: This is computed by convolving I with a kernel Gxwith odd size. For example for a kernel size of 3, Gxwould be computed as:

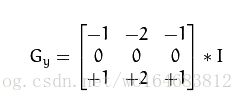
- Vertical changes: This is computed by convolving I with a kernel Gywith odd size. For example for a kernel size of 3, Gy would be computed as:

At each point of the image we calculate an approximation of the gradient in that point by combining both results above:
Although sometimes the following simpler equation is used:
![]()
Note
When the size of the kernel is 3, the Sobel kernel shown above may produce noticeable inaccuracies (after all, Sobel is only an approximation of the derivative). OpenCV addresses this inaccuracy for kernels of size 3 by using the Scharr function. This is as fast but more accurate than the standar Sobel function. It implements the following kernels:
Gx =
Gy=
You can check out more information of this function in the OpenCV reference (Scharr). Also, in the sample code below, you will notice that above the code for Sobel function there is also code for the Scharr function commented. Uncommenting it (and obviously commenting the Sobel stuff) should give you an idea of how this function works.
算子模板分为水平和竖直两种,即上面Gx和Gy
图片卷积即上面 Gx和Gy的计算公式
下面这个公式计算阈值

G 大于th是边缘,
G小于th 是非边缘
import cv2
import numpy as np
import random
import math

img=cv2.imread('haha.png',1)
imgInfo =img.shape
height= imgInfo[0]
width= imgInfo[1]
cv2.imshow('src',img)
gray=cv2.cvtColor(img,cv2.COLOR_BGR2GRAY)
dst=np.zeros((height,width,1),np.uint8)
for i  in range(0,height-2):
    for j  in range(0,width-2):
        gy=gray[i,j]*1+gray[i,j+1]*2+gray[i,j+2]*1-gray[i+2,j]*1-gray[i+2,j+1]*2-gray[i+2,j+2]*1
        gx=gray[i,j]+gray[i+1,j]*2+gray[i+2,j]-gray[i,j+2]-gray[i+1,j+2]*2-gray[i+2,j+2]
        grad=math.sqrt(gx*gx+gy*gy)
        if grad>50:
            dst[i,j]=255
        else:
            dst[i,j]=0
cv2.imshow('masaike',dst)
cv2.waitKey(10000)
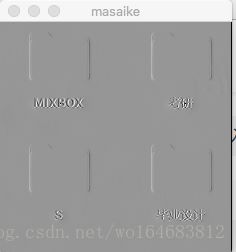
浮雕效果
import cv2
import numpy as np
img=cv2.imread('haha.png',1)
imgInfo =img.shape
height= imgInfo[0]
width= imgInfo[1]
gray=cv2.cvtColor(img,cv2.COLOR_BGR2GRAY)
dst= np.zeros((height,width,1),np.uint8)
#newP= gray0-gray1+150
#相邻像素的灰度值之差加上一个恒定值,这样可以增加浮雕的灰度等级
#括号内1代表每个像素点由一种颜色表示
for i in range(0,height):
    for j in range(0,width-1):
        grayp0=int(gray[i,j])
        grayp1=int(gray[i,j+1])
        newP=grayp0-grayp1+150
        if newP>255:
                newP==255
        if newP<0:
                newP=0
        dst[i,j]=newP
cv2.imshow('masaike',dst)
cv2.waitKey(10000)
颜色映射
import cv2
import numpy as np
img=cv2.imread('haha.png',1)
imgInfo =img.shape
height= imgInfo[0]
width= imgInfo[1]
#rgb->RGB new
#b=b*1.5
# g=g*1.3
dst =np.zeros((height,width,3),np.uint8)
for i in range(0,height):
    for j in range(0,width):
        (b,g,r) =img[i,j]
        b=b*1.5
        g=g*1.3
        if b>255:
            b=255
        if g>255:
            g=255
        dst[i,j]=(b,g,r)
cv2.imshow('masaike',dst)
cv2.waitKey(10000)
油画效果
import cv2
import numpy as np
from array import array
img=cv2.imread('haha.png',1)
imgInfo =img.shape
height= imgInfo[0]
width= imgInfo[1]
# 1、转换为灰度图  2、分成若干小方块 统计每个小方块的灰度值
# 3、 0-255划分为几个等级    0-63 64-127 128-191 192-255
# 4、统计数据  5、 dst=result
gray =cv2.cvtColor(img,cv2.COLOR_BGR2GRAY)
dst=np.zeros((height,width,3),np.uint8)
for i in range(4,height-4):
    for j in range(4,width-4):
        array1 = np.zeros(8,np.uint8)
        for m in range(-4,4):
            for n in range(-4,4):
                p1=int(gray[i+m,j+n]/32)
                array1[p1] = array1[p1]+1
            currentMax= array1[0]
            l=0
            for k in range(0,8):
                if currentMaxfor m in range(-4,4):
                for  n in range(-4,4):
                    if gray[i+m,j+n]>=(l+32) and gray[i+m,j+n]<=(l+1)*32:
                        (b,g,r) = img[i+m,j+n]
            dst[i,j]=(b,g,r)
cv2.imshow('masaike',dst)
cv2.waitKey(10000) 


