Matplotlib进阶:利用rcParams控制图形属性
目录
概要
What is rc setting?
What is rcParams?
matplotlibrc文件在哪儿
缺省设置的绘图例
利用rcParams修改设置属性
小结
概要
本文简单介绍Matplotlib中基于rcParams进行绘图属性控制的基础知识。
为了下面的代码示例,首先导入一些必要的库。
%matplotlib inline
import matplotlib as mpl
import matplotlib.pyplot as plt
import numpy as np
import pandas as pd
What is rc setting?
'rc'代表什么呢?据说这是一个有古老的历史渊源的缩写。根据维基百科'In the context of Unix-like systems, the term rc stands for the phrase "run commands". It is used for any file that contains startup information for a command.'。也就是说,在Unix及其类似的系统中,'rc'其实'run commands'的缩写。在Unix环境中,初始化配置文件通常都是以'rc'结尾的。比如说,'.xinitrc', '.vimrc' and '.bashrc', etc.也有人认为'rc'应该是代表'run config'--'they are automatically Run at startup and they Configure your stuff',还有的说法是'rc'代表'Runtime Configuration'。看上去都挺有道理。matplotlib并不是Unix一系的,或许用'rc'表示配置文件的传统是从Unix世界流传开来的。
Ref: python - What does "rc" in matplotlib's rcParams stand for? - Stack Overflow
What is rcParams?
matplotlib.rcParams是一个matplotlib.RcParams对象,是一个类似于字典的变量,用于存储matplotlib的一些rc settings.更具体一些说,它包含matplotlibrc文件中的所列的(全部?绝大多数?)属性。利用rxParams可以控制Matplotlib中的几乎所有属性,包括(但不限于):图像大小(figure size), DPI(Dots Per Inch,表示分辨率), 线宽(line width), 颜色color and 风格style, 以及axes, axis 和 grid等的属性,文本text和字体font的属性,等等等等.
matplotlibrc文件在哪儿
为了使用rcParams,我们首先需要了解它到底包含了哪些属性。这些属性名可以在matplotlibrc文件,那matplotlibrc文件在哪儿呢? 用以下命令可以找到matplotlibrc文件的所在地。
f = mpl.matplotlib_fname()
print(f)
Output: C:\Users\chenxy\Anaconda3\lib\site-packages\matplotlib\mpl-data\matplotlibrc
找到这个文件并用文本编辑器打开它,里面内容很丰富。一开头就是警告:不要编辑它!它包含以下这些分类信息。
以上每一条代表某一类属性的总称,比如说描述线条属性集合称为LINES,进一步找到LINES那一段,可以看到如下信息:
缺省设置的绘图例
matplotlibrc文件中包含了所有设置的缺省信息,所以你不知道rcParams也没有关系,一切都给你准备好了。但是对于有点追求的进阶或者高阶用户来说,自然就会想要根据自己的需求自主地修改这些设置画图得到想要的效果?rcParams就是让你来做这件事情的。
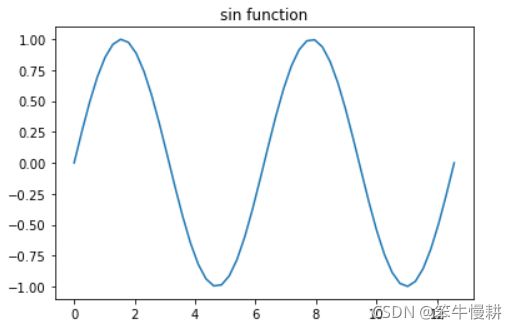
首先我们来看一个缺省设置的绘图例:
# create data
x = np.linspace(0, 4*np.pi)
y = np.sin(x)
# draw sine function
fig, ax1 = plt.subplots()
ax1.set_title('sin function')
ax1.plot(x, y, label='$sin(x)$')
在修改配置之前让我们先看看缺省设置的一些属性值:
print(mpl.rcParams['figure.figsize'])
print(mpl.rcParams['image.interpolation'])
print(mpl.rcParams['font.sans-serif'])
print(mpl.rcParams['axes.unicode_minus'])
print(mpl.rcParams['lines.linestyle'])
print(mpl.rcParams['lines.linewidth'])
Output: [6.0, 4.0] antialiased ['DejaVu Sans', 'Bitstream Vera Sans', 'Computer Modern Sans Serif', 'Lucida Grande', 'Verdana', 'Geneva', 'Lucid', 'Arial', 'Helvetica', 'Avant Garde', 'sans-serif'] True - 1.5
利用rcParams修改设置属性
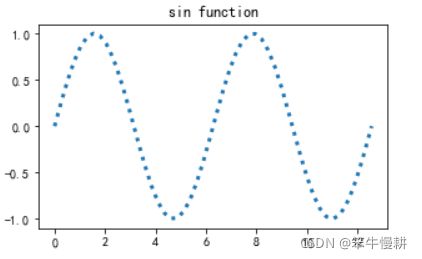
接下来我们通过修改rcParams来修改绘图属性设置。
mpl.rcParams['figure.figsize'] = (5.0, 3.0)     # set figure size
mpl.rcParams['image.interpolation'] = 'nearest' # set interpolation
mpl.rcParams['font.sans-serif'] = 'SimHei'      # set font
mpl.rcParams['axes.unicode_minus'] = False
mpl.rcParams['lines.linestyle'] = ':'
mpl.rcParams['lines.linewidth'] = 3

fig, ax2 = plt.subplots()
ax2.set_title('sin function')
ax2.plot(x, y, label='$sin(x)$')

print(mpl.rcParams['figure.figsize'])
print(mpl.rcParams['image.interpolation'])
print(mpl.rcParams['font.sans-serif'])
print(mpl.rcParams['axes.unicode_minus'])
print(mpl.rcParams['lines.linestyle'])
print(mpl.rcParams['lines.linewidth'])
[5.0, 3.0] nearest ['SimHei'] False : 3.0
能看出这个图跟上面的图有什么区别吗?
小结
以上我们简单介绍了,通过修改rcParams来定制绘图属性的方法。但是rcParams的设置的是全局性的,它对所有的绘图都同一生效。进一步,我们可能会需要针对每一张图进行绘图属性定制,这种情况下使用rcParams就不太合适了。这方面我们下次再说。。。
另外,关于Python Matplotlib初阶使用方法,参见:
Python Matplotlib初阶使用入门![]() https://blog.csdn.net/chenxy_bwave/article/details/121318653
https://blog.csdn.net/chenxy_bwave/article/details/121318653


