泰坦尼克号 机器学习
介绍(Introduction)
Everyone knows about the Titanic ship as many of the people have seen the Titanic movie and how it reached it’s tragic end on the night of 15th April 1912.A ship which was termed as the ‘unsinkable’ one struck disaster by colliding with an iceberg and after few hours it was at the bottom of the ocean.
大家都知道泰坦尼克号的这艘船,因为很多人都看过这部《泰坦尼克号》的电影,以及它如何在1912年4月15日晚上到达了悲惨的结局。这艘被称为``不沉''的船因与冰山和冰山相撞而遭受灾难。几个小时后,它在海底。
Only 1517 passengers were able to survive the shipwreck with the help of life boats but it could not accommodate all the passengers therefore it lead to a huge loss of life.
只有1517名乘客能够在救生艇的帮助下幸免于难,但由于无法容纳所有乘客,因此导致了巨大的生命损失。
问题陈述 (Problem Statement)
So Kaggle recently hosted an open online competition where the competitors had to design a model based on given training data set which predicted the survival of passengers during the shipwreck.I was very excited to attempt this problem as this was my first ML project after learning basic concepts of algorithms and data processing.
因此Kaggle最近举办了一个公开的在线竞赛,参赛者必须根据给定的训练数据集来设计模型,该模型可以预测沉船中乘客的生存情况。我很高兴尝试这个问题,因为这是我学习基础知识后的第一个ML项目算法和数据处理的概念。
方法 (Approach)
The life cycle of any Machine learning or Data Science project consists of 3 basic workflows:
任何机器学习或数据科学项目的生命周期都包含3个基本工作流程:
Data collection: The very first step is data collection process which can be obtained from many sources like company side,kaggle,ML repository,surveys,3rd party API etc. and import that data set in form of comma separated file and import the required modules.
数据收集:第一步是数据收集过程,可以从公司,kaggle,ML存储库,调查,第三方API等许多来源获取数据,并以逗号分隔文件的形式导入该数据集并导入所需的模块。
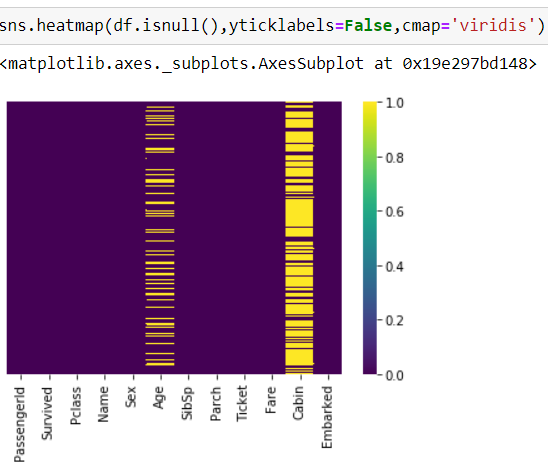
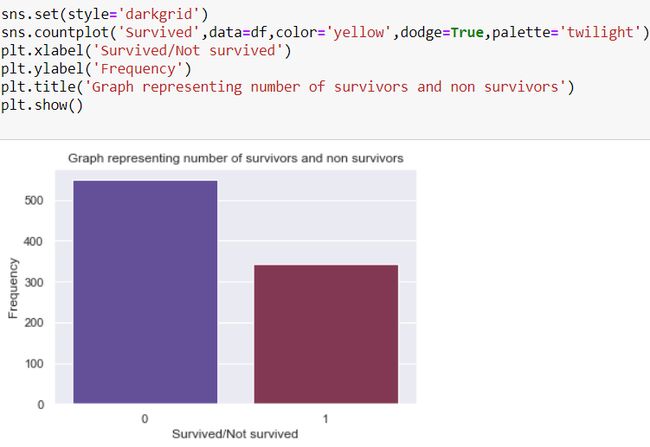
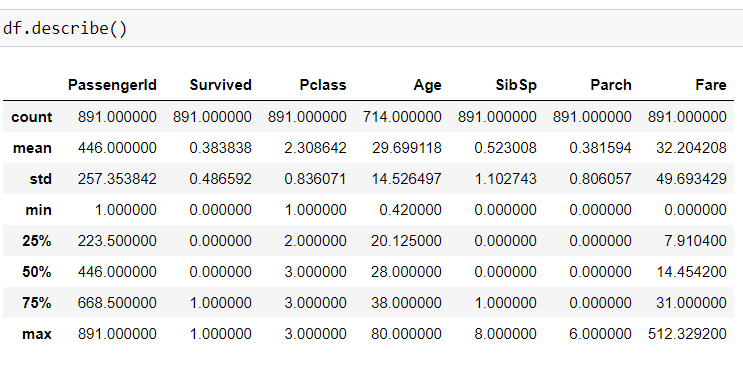
Exploratory Data Analysis: The data set we import using the read_csv function of pandas is in the form of rows and columns called as a Data Frame and each column is a Series or a feature.We then try to analyze the relationship between different features by drawing various plots and also understanding the correlation between them. We should first check if there are any null values in the data.
探索性数据分析:我们使用pandas的read_csv函数导入的数据集采用称为数据框的行和列的形式,每列都是序列或要素,然后尝试通过绘制来分析不同要素之间的关系各种情节,并了解它们之间的相关性。 我们应该首先检查数据中是否有任何空值。
3) Feature Engineering: The most important step in any ML project is feature engineering which deals with 3 points:-
3)特征工程:在任何ML项目中,最重要的步骤是特征工程,涉及3点:
a)Handling missing values in data: Many times while filling surveys people do not tend to give their personal information or for some reason the data of an individual cannot be obtained since no one knows that person.These are few reasons which explains the missing data from the data set.
a)处理数据中的缺失值:很多人在填写调查表时往往不愿提供自己的个人信息,或者由于某种原因,由于没人认识这个人而无法获得该人的数据,这是解释缺失数据的几个原因从数据集中。
Our job is to fill those null values in a specific feature by any method possible so that those null values do not affect the accuracy of our model.
我们的工作是通过任何可能的方法在特定要素中填充这些空值,以使这些空值不影响模型的准确性。
There are 2 types of data: 1) Numerical data 2) Categorical data
数据有2种类型:1)数值数据2)分类数据
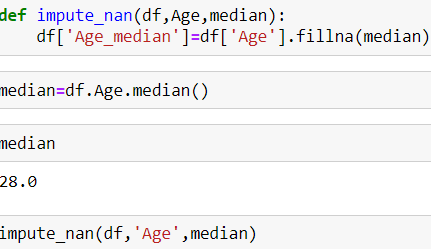
For the numerical data we use the mean median imputation method and replace the null values by the median of that column.By using median and not mean,it reduces the impact of outliers which can be present in the data.
对于数值数据,我们使用均值中位数插补方法,并将空值替换为该列的中位数。通过使用中位数而不是均值,可以减少数据中可能出现的异常值的影响。
replacing null values of ‘Age’ column with median 用中位数替换“年龄”列的空值b) Encoding the categorical data: The thing with the categorical data is that the algorithm does not understand the categories so we convert that category feature into 1 and 0 called as dummy variable.This process of converting categorical into continuous value is called One Hot Encoding.
b)编码分类数据:事物 使用分类数据的原因是该算法无法理解类别,因此我们将该类别特征转换为1和0(称为伪变量)。将分类转换为连续值的过程称为One Hot Encoding。
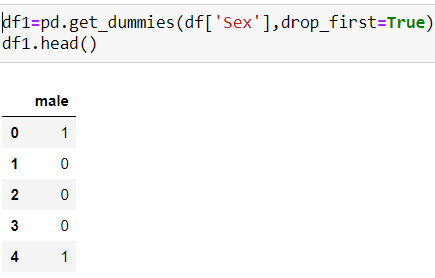
Based on the number categories in a feature,those many number of columns are created and only n-1 columns are taken into consideration as the third column can be represented with the help of 2 other columns.This is called as Dummy variable trap.
根据要素中的数字类别,将创建许多列,并且仅考虑n-1列,因为第三列可以借助其他2列来表示。这称为虚拟变量陷阱。
categorical feature sex converted into dummy variables 分类特征性别转换为伪变量通过分析数据,我们可以看到可以删除的列很少,因为它们不影响模型的准确性。清理此类数据的过程称为数据清理。(By analyzing the data we can observe that few columns can be dropped as they do not affect the accuracy of our model.The process of cleaning such data is called as data cleaning.)
There are some other methods too to handle missing values:
还有其他一些方法可以处理缺失值:
- Random Sample Imputation 随机样本插补
- Capturing NAN values with new feature使用新功能捕获NAN值
- End of distribution imputation and many more…分配归责结束以及更多…
列车测试拆分操作 (Train Test split operation)
After feature engineering is completed and we have a data set with no null values and dummy variables,we classify the data into training and testing data set.
特征工程完成后,我们有了一个没有空值和伪变量的数据集,我们将数据分类为训练和测试数据集。
20% of the data is the test data set and the 80% is considered to be the training data set which we will feed to our algorithm and after learning from that,it can make the predictions on the testing data.
其中20%的数据是测试数据集,而80%的数据是训练数据集,我们将其提供给算法,并从中学习后可以对测试数据进行预测。
We use scikit learn module to import train_test_split operation:
我们使用scikit学习模块导入train_test_split操作:
使用的算法 (Algorithm used)
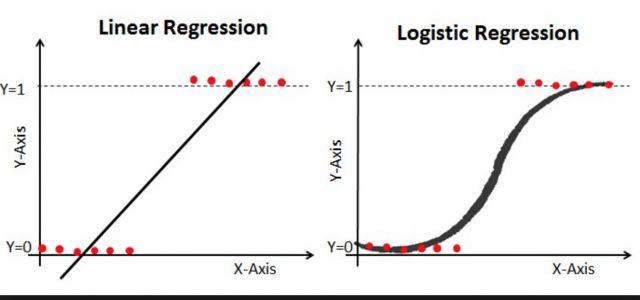
The algorithm I used here is Logistic Regression which is generally used in binary classification problem statements.It is used in problems where the data is linearly separable and our algorithm designs a line which best linearly separates the two classes.It basically predicts the probability whether that particular event will happen or not.
我在这里使用的算法是Logistic回归,通常用于二进制分类问题陈述中,用于数据可线性分离的问题中,我们的算法设计了一条最佳地线性分离这两个类别的线,基本上可以预测是否特定事件是否会发生。
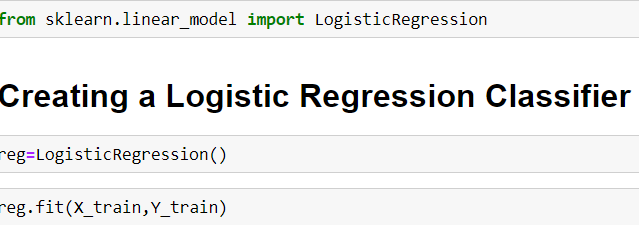
classifier to predict the survival 分类器预测生存We then create the classifier and the fit the training data into it and then use the predict function for the output.
然后,我们创建分类器并将训练数据拟合到其中,然后将预测函数用于输出。
0=did not survive,1=Survived 0 =没有幸存,1 =幸存Since the model is now ready,it is time to evaluate the performance of our classifier or model.
由于模型已经准备就绪,是时候评估分类器或模型的性能了。
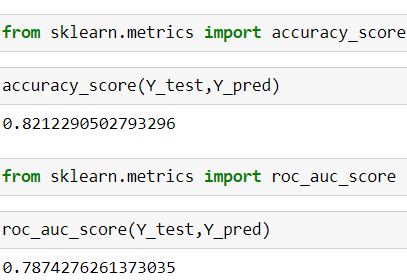
There are 4 metrics which I have used for evaluation :
我使用了4个评估指标:
- Accuracy score 准确度得分
- K Fold cross validation scoreK折交叉验证得分
- ROC and AUC scoreROC和AUC分数
The accuracy score which I got is 82% which is decent.
我得到的准确度分数是82%,相当不错。
K Fold Cross Validation: Accuracy is not the only way to judge the accuracy of any model because if the data set is imbalanced ,it might give us false results but since this is not an imbalanced set,accuracy is the best classification metric.I have used other metrics here just to analyze the different score and K fold CV is one of them.
K Fold Cross Validation:准确性不是判断任何模型准确性的唯一方法,因为如果数据集不平衡,可能会给我们带来错误的结果,但是由于这不是一个不平衡的集合,因此准确性是最佳分类指标。在这里使用其他指标只是为了分析不同的分数,K折CV就是其中之一。
In K Fold CV,we divide the original data set into k subsets and we calculate accuracy for each subset.For each subset,based on the value of k ,test data will be decided and those k iterations will be carried out and we will calculate the mean of those k accuracy and that will be our final accuracy.
在K Fold CV中,我们将原始数据集划分为k个子集,并为每个子集计算准确性。对于每个子集,基于k的值,将确定测试数据,并将进行那k个迭代,然后我们将计算这些k精度的平均值,这将是我们最终的精度。
结论 (Conclusion)
So in all and all this was a very exciting projects which gave me a very comprehensive idea about the life cycle of any ML or data science project.It has given me a wonderful insight on how basic math and statistics concepts are used here to solve real world problems.The more and more I read about Machine learning,the more it fascinates me and I am looking forward to apply other algorithms of ML like Decision Tree,Random forest,Support Vector machines.
因此,总的来说,这是一个非常令人兴奋的项目,它使我对任何ML或数据科学项目的生命周期有了非常全面的了解,这使我对如何在这里使用基本数学和统计概念来解决实际问题有了很好的见解。世界上的问题。我对机器学习的了解越来越多,它对我的吸引力也越来越多,我期待应用其他机器学习算法,例如决策树,随机森林,支持向量机。
翻译自: https://medium.com/swlh/machine-learning-project-titanic-problem-statement-c45997a75d5b
泰坦尼克号 机器学习
