SVM支持向量机(二)13
1 导包
import numpy as np
from sklearn import datasets
from sklearn.svm import SVC
from sklearn.model_selection import train_test_split
from sklearn.metrics import accuracy_score
import matplotlib.pyplot as plt
2 加载数据
X,y=datasets.load_wine(return_X_y=True)
display(X.shape)
输出:
(178, 13)
x_train,x_test,y_train,y_test=train_test_split(X,y,test_size=0.2)
display(x_train.shape,y_train.shape)
输出:
(142, 13)
(142,)3 建模
3.1 线性:linear
svc=SVC(kernel='linear')
svc.fit(x_train,y_train)
yred=svc.predict(x_test)
score=accuracy_score(yred,y_test)
display('使用linear核函数得分:',score)
输出:
'使用linear核函数得分:'
0.9444444444444444
svc.coef_
输出:
array([[ 0.68238177, 0.59090752, 1.17127315, -0.21150042, 0.0081547 ,
-0.01397723, 0.2235816 , 0.22634936, -0.41167559, 0.47889006,
-0.16003878, 0.50632237, 0.00469413],
[ 0.08796641, 0.13272108, 0.04146849, -0.07352927, 0.00631995,
0.28416506, 0.43334105, 0.00655127, 0.18678886, -0.26506095,
0.03456889, 0.29852352, 0.00403859],
[-0.6507222 , -0.33430121, -0.36136551, -0.02392738, -0.02279356,
0.37705139, 1.19788242, 0.28111838, 0.54743024, -0.61747287,
0.43714574, 0.94564814, -0.00857966]])3.2 poly多项式(方程幂次方大于1的)
svc=SVC(kernel='poly',degree=2)
svc.fit(x_train,y_train)
yred=svc.predict(x_test)
score=accuracy_score(yred,y_test)
display('使用ploy核函数得分:',score)
输出:
'使用ploy核函数得分:'
0.7222222222222222
3.3 rbf高斯分布
svc=SVC(kernel='rbf')
svc.fit(x_train,y_train)
yred=svc.predict(x_test)
score=accuracy_score(yred,y_test)
display('使用rbf核函数得分:',score)
输出:
'使用rbf核函数得分:'
0.6111111111111112
3.4 sigmoid核函数
svc=SVC(kernel='sigmoid')
svc.fit(x_train,y_train)
yred=svc.predict(x_test)
score=accuracy_score(yred,y_test)
display('使用sigmoid核函数得分:',score)
输出:

'使用sigmoid核函数得分:'
0.19444444444444445
4 非线性核函数
import matplotlib.pyplot as plt
from matplotlib.colors import ListedColormap
4.1 创造数据
X,y=datasets.make_circles(n_samples=100,factor=0.7)#获取圆圈的数据,数量100个,大小0.7
display(X.shape,y.shape)
X+=np.random.randn(100,2)*0.03
输出:
(100, 2)
(100,)
plt.figure(figsize=(5,5))
camp=ListedColormap(colors=['red','blue'])
plt.scatter(X[:,0],X[:,1],c=y,cmap=camp)4.2 线性核函数
svc=SVC(kernel='linear')
svc.fit(X,y)
svc.score(X,y)
输出:
0.51
4.3 多项式poly(升维)
svc=SVC(kernel='poly',degree=2)
svc.fit(X,y)
svc.score(X,y)
输出:
1.0
4.4 rbf高斯核函数
svc=SVC(kernel='rbf',degree=2)
svc.fit(X,y)
svc.score(X,y)
输出:
1.0
5 支持向量机回归问题
import numpy as np
from sklearn.svm import SVR
import matplotlib.pyplot as plt
5.1 创建数据
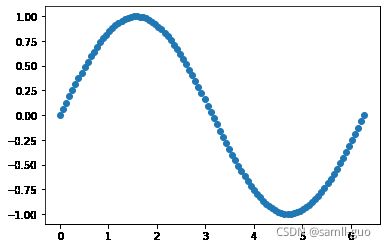
X=np.linspace(0,2*np.pi,100).reshape(-1,1)
y=np.sin(X)
plt.scatter(X,y)
5.2 建模
5.2.1 线性核函数
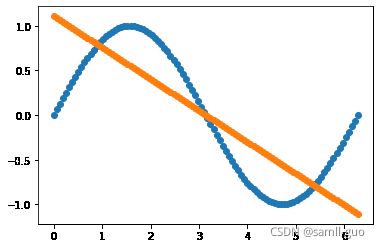
svr=SVR(kernel='linear')
svr.fit(X,y.ravel())
y_=svr.predict(X)

svr.score(X,y)
plt.scatter(X,y)
plt.scatter(X,y_)
5.2.2 poly多项式核函数
svr=SVR(kernel='poly',degree=3)
svr.fit(X,y.ravel())
y_=svr.predict(X)

svr.score(X,y)
plt.scatter(X,y)
plt.scatter(X,y_)
5.3 rbf径向基(高斯核函数)
svr=SVR(kernel='rbf',coef0=300)#cofe0为截距的参数
svr.fit(X,y.ravel())
y_=svr.predict(X)

svr.score(X,y)
plt.scatter(X,y)
plt.scatter(X,y_)
6 天猫双十一销量数据预测
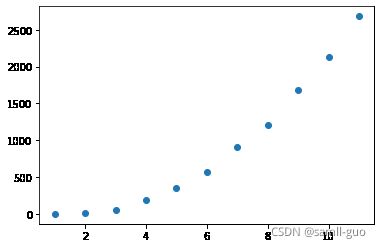
X=np.linspace(2009,2019,11)-2008
y = np.array([0.5,9.36,52,191,350,571,912,1207,1682,2135,2684])
plt.scatter(X,y)
x_test=np.linspace(2009,2019,100).reshape(-1, 1)-20086.1 linear核函数
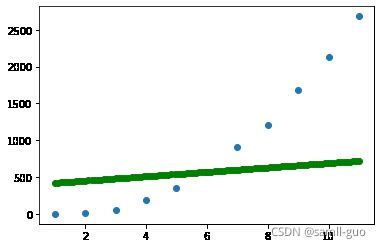
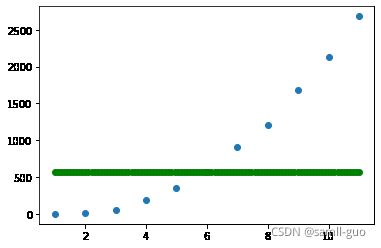
svr=SVR(kernel='linear')
svr.fit(X.reshape(-1, 1),y)
y_=svr.predict(x_test)
plt.scatter(X,y)
plt.scatter(x_test,y_,c='green')
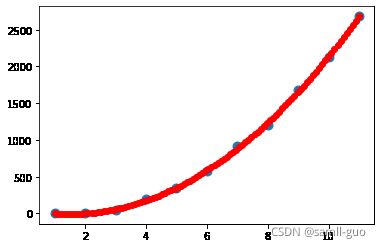
svr=SVR(kernel='poly',degree=3,coef0=200)#coef0截距=200
svr.fit(X.reshape(-1, 1),y)
y_=svr.predict(x_test)
plt.scatter(X,y,s=80)
plt.scatter(x_test,y_,c='red')
svr=SVR(kernel='rbf')
svr.fit(X.reshape(-1, 1),y)
y_=svr.predict(x_test)
plt.scatter(X,y)
plt.scatter(x_test,y_,c='green')
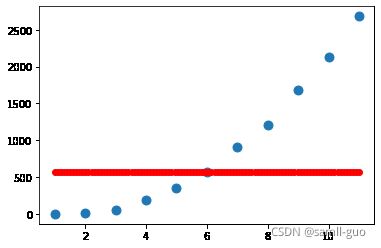
svr=SVR(kernel='sigmoid')#coef0截距=200
svr.fit(X.reshape(-1, 1),y)
y_=svr.predict(x_test)
plt.scatter(X,y,s=80)
plt.scatter(x_test,y_,c='red')

