PyTorch基础(一)
文章目录
- 数据操作
-
- 创建数据
- 数据运算
-
- 降维求和
- 非降维求和
- 点积
- 矩阵-向量积
- 矩阵-矩阵乘法
- 索引和切片
- 转换数据类型
- 微分
- 自动求导
无论哪个深度学习框架,它的张量类(PyTorch中为Tensor)都和Numpy的ndarray类似,接下来介绍的很多函数名和Numpy中的都一样,不过会比Numpy的ndarray多一些重要功能,比如张量类支持自动微分。
数据操作
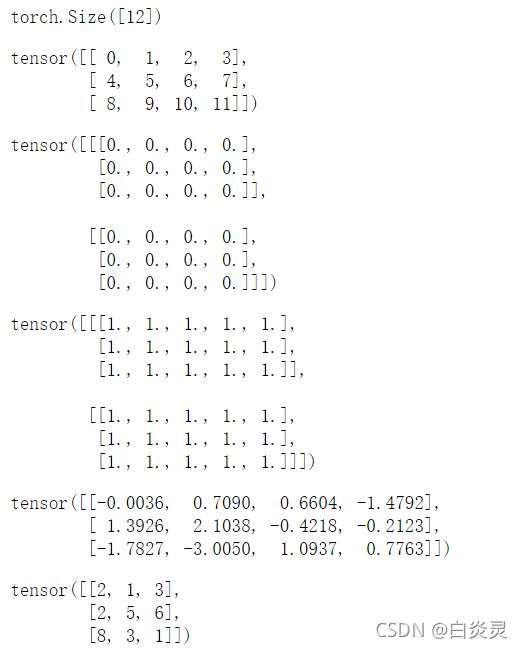
创建数据
import torch
#默认创建为浮点数
x = torch.arange(12)
#访问张量的形状(沿每个轴的长度)
x.shape
#改变形状
x.reshape(3,4)
#全0初始化矩阵
torch.zeros((2,3,4))
#全1初始化矩阵
torch.ones((2,3,5))
#指定特定分布,均值为0、标准差为1的标准高斯分布
torch.randn(3,4)
#可直接为张量中的元素赋予确定值
torch.tensor([[2,1,3],[2,5,6],[8,3,1]])
数据运算
x = torch.tensor([1,2,3,4])
y = torch.tensor([3,4,9,5])
#按元素计算
print("x*y:",x*y)
print("exp:",torch.exp(x))
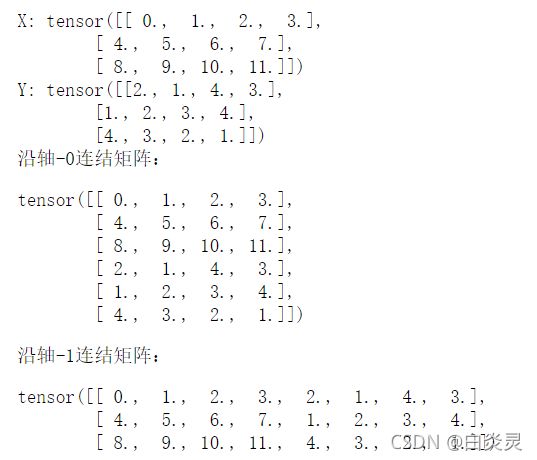
连结concatenate这个概念是比较常见的,SQL中,Dataframe中都很常见,我们也可以把多个张量连结在一起,在连结的时候需要给出沿哪个轴连结。
X = torch.arange(12, dtype=torch.float32).reshape((3,4))
Y = torch.tensor([[2.0,1,4,3],[1,2,3,4],[4,3,2,1]])
print("X:",X)
print("Y:",Y)
print("沿轴-0连结矩阵:")
torch.cat((X,Y), dim=0)
print("沿轴-1连结矩阵:")
torch.cat((X,Y), dim=1)
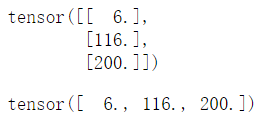
降维求和
X
X.sum(axis=0)
X.sum(axis=1)
X.sum(axis=[0,1])
X.mean()
X.numel()
非降维求和
X.sum(axis=1,keepdims=True)
X.sum(axis=1)
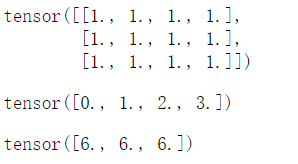
点积
x = torch.arange(4, dtype=torch.float32)
y = torch.ones(4, dtype=torch.float32)
torch.dot(x,y)
矩阵-向量积
A
x
torch.mv(A,x)
矩阵-矩阵乘法
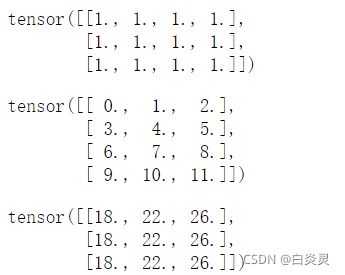
A = torch.ones(3,4)
B = torch.arange(12, dtype=torch.float32).reshape((4,3))
A
B
torch.mm(A,B)
索引和切片
#选择最后一个元素
X[-1]
#切片
X[1:3]
#可通过指定索引更改元素
X[1,2] = 100
X
X[2,:] = 50
X
转换数据类型
A = X.numpy()
B = torch.tensor(A)
print("A的类型为:",type(A))
print("B的类型为:",type(B))
微分
在深度学习中,通常选择对于模型参数可微的损失函数。
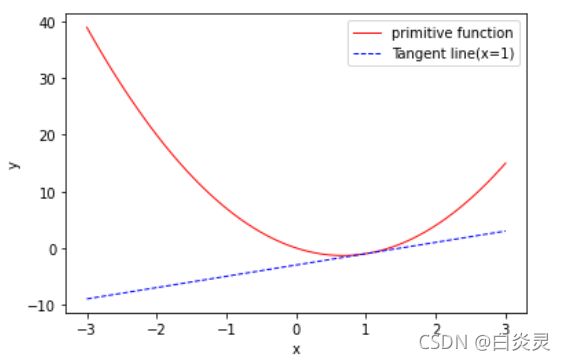
定义 u = f ( x ) = 3 x 2 − 4 x u=f(x)=3x^{2}-4x u=f(x)=3x2−4x
import matplotlib.pyplot as plt
import numpy as np

x=np.linspace(-3,3,100)
def f(x):
    return 3*x**2 - 4*x
def g(x):
    return 2*x - 3
plt.plot(x,f(x),color='red',linewidth=1.0,label="primitive function")
plt.plot(x,g(x),color='blue',linewidth=1.0,linestyle='--',label="Tangent line(x=1)")
plt.xlabel('x')
plt.ylabel('y')
plt.legend(loc="best")

# 显示图像
plt.show()
自动求导
自动求导可以使系统能够随后反向传播梯度(backpropagate)。
import torch
x = torch.arange(4.0,requires_grad=True)
print(x.grad)
#调用反向传播函数来自动计算y关于每个分量的梯度
y = 2*torch.dot(x,x)
y.backward()
print(x.grad)
#验证梯度是否正确计算
x.grad == 4*x
#默认情况下,PyTorch会累积梯度
x.grad.zero_()
y = x.sum()
y
y.backward()
x.grad
- 莫烦大神的PyTorch视频教程
- 《Dive Into Deep Learning》
- PyTorch官方文档
