sklearn-机器学习笔记
文章目录
- 教程
- 环境配置
-
- Anaconda和Jupyter
- 更换pip源
- 机器学习概述
-
- 1.1 人工智能概述
-
- 1.1.2 机器学习、深度学习能做些什么
- 1.2 什么是机器学习
-
- 1.2.3 数据集构成
- 1.3 机器学习算法分类
-
- 监督学习
- 无监督学习
- 1.4 机器学习开发流程
- 1.5 学习框架和资料介绍
- 特征工程
-
- 2.1 数据集
-
- 2.1.1 可用数据集
- 2.1.2 sklearn数据集
-
- API
- 示例
- 2.1.3 数据集的划分
-
- API
- 示例
- 2.2 特征工程介绍
-
- 2.2.1 为什么需要特征工程(Feature Engineering)
- 2.2.2 什么是特征工程
- 2.3 特征抽取
-
- 2.3.1 特征提取
- 2.3.2 字典特征提取 - 类别 -> one-hot编码
-
- API
- 示例
- 2.3.3 文本特征提取
- 方法1:CountVectorizer
-
- API
- 示例
- 示例
- 示例
- 方法2:TfidfVectorizer
-
- API
- 示例
- 2.4 特征预处理
-
- 2.4.1 什么是特征预处理
- 2.4.2 归一化
-
- API
- 示例
- 2.4.3 标准化
-
- API
- 示例
- 2.5特征降维
-
- 2.5.0 降维概念
- 2.5.1 特征选择
-
- Filter过滤式
-
- API
- 示例
- Embeded嵌入式
- 2.5.2 主成分分析(PCA)
-
- API
- 示例
- 2.5.3 案例:探究用户对物品类别的喜好细分
-
- 示例
- 机器学习概述与特征工程总结
- 分类算法
-
- 3.1 sklearn转换器和估计器
-
- 3.1.1 转换器
- 3.1.2 估计器(estimator)
- 3.2 K-近邻算法
-
- 3.2.1 什么是K-近邻算法
-
- API
- API算法中关于距离的定义
- 3.2.3 案例:鸢尾花种类预测
-
- 示例
- 3.2.4 K-近邻总结
- 3.3 模型选择与调优
-
- 3.3.1 交叉验证(cross validation)
- 3.3.2 超参数搜索-网格搜索(Grid Search)
- API
- 3.3.3 鸢尾花案例增加K值调优
-
- 示例
- 3.2.4 案例:预测facebook签到位置
-
- 示例
- 3.4 朴素贝叶斯算法
-
- 3.4.1 联合概率、条件概率与相互独立
-
- API
- 3.4.2 案例:20类新闻分类
-
- 示例
- 3.4.7 朴素贝叶斯算法总结
- 3.5 决策树
-
- 3.5.1 认识决策树
- 3.5.2 决策树分类原理详解
- 2.5.3 信息的衡量 - 信息量 - 信息熵
- 3.5.4 决策树的划分依据之一------信息增益
- 3.5.5 决策树的三种算法实现
-
- API
- 示例
- 3.5.5 决策树可视化
- 3.5.6 案例:泰坦尼克号乘客生存预测
-
- 示例
- 3.5.7 决策树总结
- 3.6 集成学习方法之随机森林
-
- 3.6.1 什么是集成学习方法
- 3.6.2 什么是随机森林
- 3.6.3 随机森林原理过程
-
- API
- 示例
-
- 决策树对泰坦尼克号乘客的生存进行预测
- 随机森林对泰坦尼克号乘客的生存进行预测
- 3.6.4 随机森林总结
- 分类算法总结
- 回归和聚类
-
- 4.1 线性回归
-
- 4.1.1 线性回归的原理
- 4.1.2 线性回归的损失和优化原理
-
- API
- 4.1.3 回归性能评估
-
- API
- 4.1.4 波士顿房价预测
-
- 示例
- 4.1.5 正规方程和梯度下降对比
- 4.2 欠拟合与过拟合
-
- 4.2.1 什么是过拟合与欠拟合
- 4.3 线性回归的改进-岭回归
-
- API
- 示例
- 4.4 分类算法-逻辑回归与二分类
-
- 4.4.1 逻辑回归的应用场景
- 4.4.2 逻辑回归的原理
-
- API
- 4.4.4 案例:癌症分类预测-良/恶性乳腺癌肿瘤预测
-
- 示例
- 4.4.5 分类的评估方法
-
- 4.4.5.1 精确率与召回率
- 4.4.5.2 F1-score
-
- API
- 示例
- 4.4.5.3 ROC曲线与AUC指标
-
- API
- 示例
- AUC总结
- 4.5 模型保存和加载
-
- API
- 示例
- 4.6 无监督学习-K-means算法
-
- 4.6.1 什么是无监督学习
- 4.6.2 无监督学习包含算法
- 4.6.3 K-means原理
- 4.6.4 K-means步骤
-
- API
- 4.6.5 案例:k-means对Instacart Market用户聚类
-
- 示例
- 4.6.6 Kmeans性能评估指标
-
- API
- 示例
- 4.6.7 K-means总结
- 回归和聚类总结
教程
黑马程序员3天快速入门python机器学习
环境配置
Anaconda和Jupyter
- Python+Anaconda+PyCharm的安装和基本使用
- 修改Anaconda中Jupyter Notebook默认工作路径的详细图文教程(Win 10)
- Jupyter 快捷键总结
更换pip源
更换清华pip源
参考链接:
- 手把手教你进行pip换源,让你的Python库下载嗖嗖的
- Python pip更换国内源(一句命令换源)
机器学习概述
1.1 人工智能概述
- 达特茅斯会议-人工智能的起点
- 机器学习是人工智能的一个实现途径
- 深度学习是机器学习的一个方法发展而来
1.1.2 机器学习、深度学习能做些什么
- 传统预测
- 图像识别
- 自然语言处理
1.2 什么是机器学习
- 数据
- 模型
- 预测
从历史数据当中获得规律?这些历史数据是怎么的格式?
1.2.3 数据集构成
- 特征值 + 目标值
有的时候可能是没有目标值的:目标特征分类
1.3 机器学习算法分类
监督学习
定义︰输入数据是由输入特征值和目标值所组成。函数的输出可以是一个连续的值(称为回归),或是输出是有限个离散值(称作分类)
-
目标值:类别 - 分类问题
k-近邻算法、贝叶斯分类、决策树与随机森林、逻辑回归 -
目标值:连续型的数据 - 回归问题
线性回归、岭回归
无监督学习
定义∶输入数据是由输入特征值所组成。
1.4 机器学习开发流程
1)获取数据
2)数据处理
3)特征工程
4)机器学习算法训练 - 模型
5)模型评估
6)应用

1.5 学习框架和资料介绍
1)算法是核心,数据与计算是基础
2)找准定位
大部分复杂模型的算法设计都是算法工程师在做,而我们
- 分析很多的数据
- 分析具体的业务
- 应用常见的算法
- 特征工程、调参数、优化
3)怎么做?
- 入门
- 实战类书籍
-
- 机器学习 -”西瓜书”- 周志华
- 统计学习方法 - 李航
- 深度学习 - “花书”
4)1.5.1 机器学习库与框架
特征工程
2.1 数据集
2.1.1 可用数据集
公司内部 百度
数据接口 花钱
数据集
学习阶段可以用的数据集:
1)sklearn
2)kaggle
3)UCI
Scikit-learn工具介绍
注意:
安装scikit-learn需要Numpy
安装sklearn过慢或出现错误Cannot determine archive format of C:\Users\22164\AppData\Local\Temp\pip-req
解决方案:
更换清华pip源
参考链接:
- 手把手教你进行pip换源,让你的Python库下载嗖嗖的
- Python pip更换国内源(一句命令换源)
2.1.2 sklearn数据集
-
sklearn.datasets
load_* 获取小规模数据集
fetch_* 获取大规模数据集 -
sklearn小数据集
sklearn.datasets.load_iris() -
sklearn大数据集
sklearn.datasets.fetch_20newsgroups(data_home=None,subset=‘train’) -
数据集的返回值
datasets.base.Bunch(继承自字典)
dict[“key”] = values
bunch.key = values
API
sklearn.datasets
加载获取流行数据集
- datasets.load_*()
获取小规模数据集,数据包含在datasets里 - datasets.fetch_*(data_home=None)
获取大规模数据集,需要从网络上下载。- data_home,表示数据集下载的目录,默认是 ~/scikit_learn_data/
- subset:‘train’或者’test’,‘all’,可选,选择要加载的数据集。
训练集的“训练”,测试集的“测试”,两者的“全部”
sklearn数据集返回值:
load和fetch返回的数据类型datasets.base.Bunch(字典格式)
- data:特征数据数组,是 [n_samples * n_features] 的二维 numpy.ndarray 数组
- target:标签数组,是 n_samples 的一维 numpy.ndarray 数组
- DESCR:数据描述
- feature_names:特征名,新闻数据,手写数字、回归数据集没有
- target_names:标签名
示例
- sklearn.datasets.load_iris()
加载并返回鸢尾花数据集 - sklearn.datasets.load_boston()
加载并返回波士顿房价数据集 - sklearn.datasets.fetch_20newsgroups(data_home=None,subset=‘train’)
加载20类新闻数据集
2.1.3 数据集的划分
训练数据:用于训练,构建模型
测试数据:在模型检验时使用,用于评估模型是否有效
训练集:70% 80% 75%
测试集:30% 20% 30%
API
sklearn.model_selection.train_test_split(arrays, *options)
- x 数据集的特征值
- y 数据集的标签值
- test_size 测试集的大小,一般为float
- random_state 随机数种子,不同的种子会造成不同的随机采样结果。相同的种子采样结果相同。
- return 测试集特征训练集特征值值,训练标签,测试标签(默认随机取)
- 训练集特征值,测试集特征值,训练集目标值,测试集目标值
x_train, x_test, y_train, y_test
- 训练集特征值,测试集特征值,训练集目标值,测试集目标值
示例
from sklearn.datasets import load_iris
from sklearn.model_selection import train_test_split


def datasets_test():
    """sklearn数据集使用"""
    # 获取数据集
    iris = load_iris()
    print("鸢尾花数据集:\n", iris)
    # sepal:花萼  petal:花瓣
    # print("查看数据集描述:\n", iris["DESCR"])
    print("查看数据集描述:\n", iris.DESCR)
    print("查看特征值名字:\n", iris.feature_names)
    print("查看特征值:\n", iris.data, iris.data.shape)

    # 数据集划分,参数分别为:特征值,目标值,测试集比例(默认0.25),随机数种子
    # x_train = 训练集特征值, x_test = 测试集特征值, y_train = 训练集目标值, y_test = 测试集目标值
    x_train, x_test, y_train, y_test = train_test_split(iris.data, iris.target, test_size=0.2, random_state=22)
    print("查看训练集特征值:\n", x_train, x_train.shape)
结果:
查看特征值名字:
 ['sepal length (cm)', 'sepal width (cm)', 'petal length (cm)', 'petal width (cm)']
查看特征值:
 [[5.1 3.5 1.4 0.2]
 [4.9 3.  1.4 0.2]
 [4.7 3.2 1.3 0.2]
 [4.6 3.1 1.5 0.2]
 [5.  3.6 1.4 0.2]
...(太长了,删掉了部分数据)
 [6.2 3.4 5.4 2.3]
 [5.9 3.  5.1 1.8]] (150, 4)
查看训练集特征值:
 [[4.8 3.1 1.6 0.2]
 [5.4 3.4 1.5 0.4]
 [5.5 2.5 4.  1.3]
 [5.5 2.6 4.4 1.2]
...(太长了,删掉了部分数据)
 [6.3 3.3 6.  2.5]
 [5.1 3.8 1.9 0.4]
 [6.4 2.8 5.6 2.2]
 [7.7 3.8 6.7 2.2]] (120, 4)
2.2 特征工程介绍
算法 特征工程
2.2.1 为什么需要特征工程(Feature Engineering)
2.2.2 什么是特征工程
特征工程是使用专业背景知识和技巧处理数据,使得特征能在机器学习算法上发挥更好的作用的过程。
意义:会直接影响机器学习的效果
sklearn:对于特征的处理提供了强大的接口 用于特征工程
pandas:一个数据读取非常方便以及基本的处理格式的工具 用于数据清洗、数据处理
- 特征抽取/特征提取
- 机器学习算法 - 统计方法 - 数学公式
- 文本类型 -》 数值
- 类型 -》 数值
- 机器学习算法 - 统计方法 - 数学公式
特征工程包含内容:
- 特征抽取
- 特征预处理
- 特征降维
2.3 特征抽取
2.3.1 特征提取
将任意数据(如文本或图像)转换为可用于机器学习的数字特征
注: 特征值化是为了计算机更好的去理解数据
- 字典特征提取(特征离散化)
- 文本特征提取
- 图像特征提取(深度学习将介绍)
2.3.2 字典特征提取 - 类别 -> one-hot编码
sklearn.feature_extraction.DictVectorizer(sparse=True,…)
vector 数学:向量 物理:矢量
矩阵 matrix 二维数组
向量 vector 一维数组
父类:转换器类 transfer
返回:sparse矩阵
API
sklearn.feature_extraction.DictVectorizer(sparse=True,…)
对字典数据进行特征值化
- DictVectorizer.fit_transform(X) X:字典或者包含字典的迭代器。返回值:返回sparse矩阵
- DictVectorizer.inverse_transform(X) X:array数组或者sparse矩阵。返回值:转换之前数据格式
- DictVectorizer.get_feature_names() 返回类别名称
示例
字典特征抽取
from sklearn.datasets import load_iris
from sklearn.model_selection import train_test_split
from sklearn.feature_extraction import DictVectorizer


def dict_extract():
    """字典特征抽取"""
    data = [{
     'city': '北京', 'temperature': 100},
            {
     'city': '上海', 'temperature': 60}, {
     'city': '深圳', 'temperature': 30}]
    # 1.实例化一个转换器类
    transfer = DictVectorizer()
    # 2.调用fit_transform
    data_new = transfer.fit_transform(data)
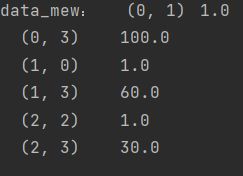
    print("data_mew:", data_new)
结果:
sparse=True时(默认),返回的是个稀疏矩阵
from sklearn.datasets import load_iris
from sklearn.model_selection import train_test_split
from sklearn.feature_extraction import DictVectorizer


def dict_extract():
    """字典特征抽取"""
    data = [{
     'city': '北京', 'temperature': 100},
            {
     'city': '上海', 'temperature': 60}, {
     'city': '深圳', 'temperature': 30}]
    # 1.实例化一个转换器类
    transfer = DictVectorizer(sparse=False)
    # 2.调用fit_transform
    data_new = transfer.fit_transform(data)
    print("data_mew:", data_new)
    # 获取特征名字
    print("特征名字:", transfer.get_feature_names())
sparse=False时,返回的是个one-hot编码的二维数组

sparse稀疏
将非零值按位置表示出来
节省内存 - 提高加载效率
字典特征抽取的应用场景:
- 1)pclass, sex 数据集当中类别特征比较多
- 将数据集的特征-》字典类型
- DictVectorizer转换
- 2)本身拿到的数据就是字典类型
2.3.3 文本特征提取
单词 作为 特征
句子、短语、单词、字母
特征:特征词
方法1:CountVectorizer
统计每个样本特征词出现的个数
API
sklearn.feature_extraction.text.CountVectorizer(stop_words=[])
对文本数据进行特征值化
返回词频矩阵
- CountVectorizer.fit_transform(X) X:文本或者包含文本字符串的可迭代对象。 返回值:返回sparse矩阵
- CountVectorizer.inverse_transform(X) X:array数组或者sparse矩阵。返回值:转换之前数据格
CountVectorizer.get_feature_names() 返回值:单词列表
示例
文本特征提取,统计每个样本特征词出现的个数
from sklearn.datasets import load_iris
from sklearn.model_selection import train_test_split
from sklearn.feature_extraction import DictVectorizer
from sklearn.feature_extraction.text import CountVectorizer


def text_extract():
    """文本特征抽取"""
    data = ["life is short,i like like python", "life is too long,i dislike python"]
    # 1.实例化一个转换器类
    transfer = CountVectorizer()
    # 2.调用fit_transform
    data_new = transfer.fit_transform(data)
    # CountVectorizer是没有sparse参数的,不过这个'scipy.sparse.csr.csr_matrix'类里有toarray()方法,可以直接调用
    # DictVectorizer也有toarray()方法
    print("data_new:", data_new.toarray(), type(data_new))
    print("特征名字:", transfer.get_feature_names())
结果:

注意:
CountVectorizer是没有sparse参数的,不过这个’scipy.sparse.csr.csr_matrix’类里有toarray()方法,可以直接调用
同样的,DictVectorizer也有toarray()方法
sklearn.feature_extraction.text.CountVectorizer(stop_words=[])
stop_words停用的词表(以列表的形式传入)
停用词表
示例
中文文本特征提取
def text_extract_chinese():
    """中文文本特征抽取"""
    data = ["我 爱 北京 天安门", "天安门 上 太阳 升"]
    # 1.实例化一个转换器类
    transfer = CountVectorizer()
    # 2.调用fit_transform
    data_new = transfer.fit_transform(data)
    # CountVectorizer是没有sparse参数的,不过这个'scipy.sparse.csr.csr_matrix'类里有toarray()方法,可以直接调用
    # DictVectorizer也有toarray()方法
    print("data_new:", data_new.toarray(), type(data_new))
    print("特征名字:", transfer.get_feature_names())
结果:

注意:
中文如果直接使用CountVectorizer是得不出正确结果的。英文默认是以空格分开的,其实就达到了一个分词的效果,所以我们要对中文进行分词处理。
示例
中文文本特征抽取,使用jieba库完成自动分词
from sklearn.datasets import load_iris
from sklearn.model_selection import train_test_split
from sklearn.feature_extraction import DictVectorizer
from sklearn.feature_extraction.text import CountVectorizer
import jieba


def text_extract_chinese_auto():
    """中文文本特征抽取,自动分词"""
    data = ["一种还是一种今天很残酷,明天更残酷,后天很美好,但绝对大部分是死在明天晚上,所以每个人不要放弃今天。",
            "我们看到的从很远星系来的光是在几百万年之前发出的,这样当我们看到宇宙时,我们是在看它的过去。",
            "如果只用一种方式了解某样事物,你就不会真正了解它。了解事物真正含义的秘密取决于如何将其与我们所了解的事物相联系。"]

    # 1.将中文文本进行分词
    data_new = []
    for sent_text in data:
        data_new.append(cut_words(sent_text))
    # print(data_new)

    # 2.实例化一个转换器类
    transfer = CountVectorizer()

    # 3.调用fit_transform
    data_result = transfer.fit_transform(data_new)
    print("data_new:", data_result.toarray())
    print("特征名字:", transfer.get_feature_names())
结果:

关键词:在某一个类别的文章中,出现的次数很多,但是在其他类别的文章当中出现很少
方法2:TfidfVectorizer
TF-IDF - 用以评估一字词对于一个文件集或一个语料库中的其中一份文件的重要程度。
主要思想是:某个词或短语在一篇文章中出现的概率高,并且在其他文章中很少出现,则认为此词或者短语具有很好的类别区分能力,适合用来分类。
- TF - 词频(term frequency,tf):某一个给定的词语在该文件中出现的频率
- IDF - 逆向文档频率:是一个词语普遍重要性的度量。某一特定词语的idf,可以由总文件数目除以包含该词语之文件的数目,再将得到的商取以10为底的对数得到
t f i d f i , j = t f i , j × i d f i , j tfidf_{i,j} = tf_{i,j}×idf_{i,j} tfidfi,j=tfi,j×idfi,j
两个词 “经济”,“非常”
1000篇文章-语料库
100篇文章 - “非常”
10篇文章 - “经济”
两篇文章
文章A(100词) : 10次“经济” TF-IDF:0.2
tf:10/100 = 0.1
idf:lg 1000/10 = 2
文章B(100词) : 10次“非常” TF-IDF:0.1
tf:10/100 = 0.1
idf: log 10 1000/100 = 1
API
sklearn.feature_extraction.text.TfidfVectorizer
使用TF-IDF对文本数据进行特征值化
jieba.cut()
返回词语组成的生成器
示例
使用TF-IDF进行中文文本特征抽取
def tfidf_text_extract_chinese_auto():
    """tfidf中文文本特征抽取,自动分词"""
    data = ["一种还是一种今天很残酷,明天更残酷,后天很美好,但绝对大部分是死在明天晚上,所以每个人不要放弃今天。",
            "我们看到的从很远星系来的光是在几百万年之前发出的,这样当我们看到宇宙时,我们是在看它的过去。",
            "如果只用一种方式了解某样事物,你就不会真正了解它。了解事物真正含义的秘密取决于如何将其与我们所了解的事物相联系。"]

    # 1.将中文文本进行分词
    data_new = []
    for sent_text in data:
        data_new.append(cut_words(sent_text))
    # print(data_new)

    # 2.实例化一个转换器类
    transfer = TfidfVectorizer()

    # 3.调用fit_transform
    data_result = transfer.fit_transform(data_new)
    print("data_new:", data_result.toarray())
    print("特征名字:", transfer.get_feature_names())
2.4 特征预处理
2.4.1 什么是特征预处理
通过一些转换函数将特征数据转换成更加适合算法模型的特征数据过程
为什么我们要进行归一化/标准化?
特征的单位或者大小相差较大,或者某特征的方差相比其他的特征要大出几个数量级,容易影响(支配)目标结果,使得一些算法无法学习到其它的特征
- 需要用到一些方法进行无量纲化,使不同规格的数据转换到同一规格
2.4.2 归一化
通过对原始数据进行变换把数据映射到(默认为[0,1])之间

缺点:鲁棒性较差
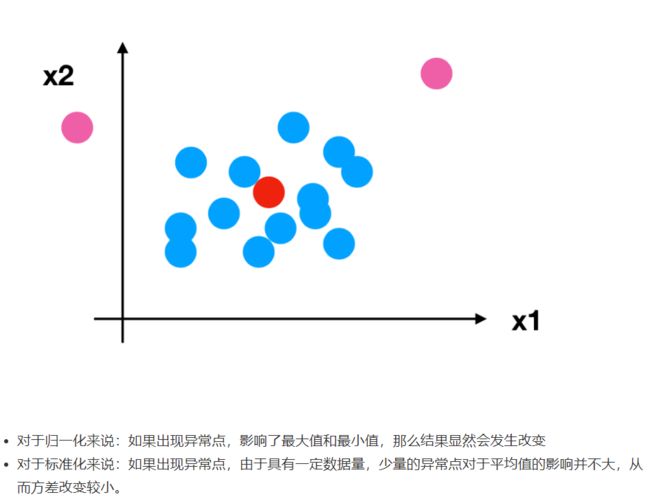
归一化异常值为最大值、最小值的时候,归一化结果描述数据不够准确。
应用场景:只适合传统精确小数据场景。
API
sklearn.preprocessing.MinMaxScaler (feature_range=(0,1)… )
- MinMaxScalar.fit_transform(X)
- X:numpy array格式的数据[n_samples,n_features]
- 返回值:转换后的形状相同的array
示例
数据归一化处理
from sklearn.datasets import load_iris
from sklearn.model_selection import train_test_split
from sklearn.feature_extraction import DictVectorizer
from sklearn.feature_extraction.text import CountVectorizer, TfidfVectorizer
from sklearn.preprocessing import MinMaxScaler
import jieba
import pandas as pd


def normalization():
    """归一化"""
    # 1.获取数据
    data = pd.read_csv("dating.txt")  # 使用pandas库导入数据文件
    # print("data:\n", data)
    data = data.iloc[:, :3]  # 获取所有行,前三列
    print("data:\n", data)
    # 2.实例化一个转换器类
    transfer = MinMaxScaler()  # 默认范围0-1
    # transfer = MinMaxScaler(feature_range=[2, 3])  # 范围2-3
    # 3.调用fit_transform
    data_new = transfer.fit_transform(data)
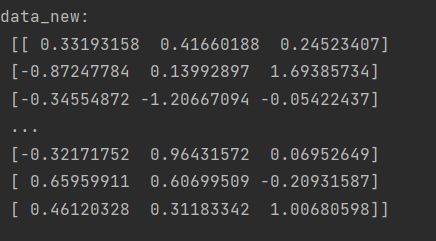
    print("data_new:\n", data_new)
2.4.3 标准化
通过对原始数据进行变换把数据变换到均值为0,标准差为1范围内

(x - mean) / std
标准差:集中程度
应用场景:
在已有样本足够多的情况下比较稳定,适合现代嘈杂大数据场景。
API
sklearn.preprocessing.StandardScaler( )
处理之后每列来说所有数据都聚集在均值0附近标准差差为1
- StandardScaler.fit_transform(X)
- X:numpy array格式的数据[n_samples,n_features]
- 返回值:转换后的形状相同的array
示例
数据标准化处理
from sklearn.datasets import load_iris
from sklearn.model_selection import train_test_split
from sklearn.feature_extraction import DictVectorizer
from sklearn.feature_extraction.text import CountVectorizer, TfidfVectorizer
from sklearn.preprocessing import MinMaxScaler, StandardScaler
import jieba
import pandas as pd

def normalization():
    """归一化"""
    # 1.获取数据
    data = pd.read_csv("../usingFiles/dating.txt")  # 使用pandas库导入数据文件
    # print("data:\n", data)
    data = data.iloc[:, :3]  # 获取所有行,前三列
    print("data:\n", data)
    # 2.实例化一个转换器类
    transfer = MinMaxScaler()  # 默认范围0-1
    # transfer = MinMaxScaler(feature_range=[2, 3])  # 范围2-3
    # 3.调用fit_transform
    data_new = transfer.fit_transform(data)
    print("data_new:\n", data_new)
2.5特征降维
2.5.0 降维概念
ndarray
维数:嵌套的层数
0维 标量
1维 向量
2维 矩阵
3维
n维
此处降维针对二维数组而言
此处的降维:降低特征的个数
降维是指在某些限定条件下,降低随机变量(特征)个数,得到一组“不相关”主变量的过程。
效果:特征与特征之间不相关
降维的两种方式:
- 特征选择
- 主成分分析(可以理解成一种特征提取的方式)
2.5.1 特征选择
定义:数据中包含冗余或无关变量(或称特征、属性、指标等),旨在从原有特征中找出主要特征。
Filter过滤式
- 方差选择法:低方差特征过滤
特征方差小:某个特征大多样本的值比较相近
特征方差大:某个特征很多样本的值都有差别
sklearn.feature_selection.VarianceThreshold(threshold = 0.0)
删除所有低方差特征
Variance.fit_transform(X)
X:numpy array格式的数据[n_samples,n_features]
返回值:训练集差异低于threshold的特征将被删除。默认值是保留所有非零方差特征,即删除所有样本中具有相同值的特征。
- 皮尔逊相关系数(Pearson Correlation Coefficient)
反映变量之间相关关系密切程度的统计指标->特征与特征之间的相关程度
取值范围:–1≤ r ≤+1
皮尔逊相关系数
0.9942
特征与特征之间相关性很高:
1)选取其中一个
2)加权求和
3)主成分分析
API
sklearn.feature_selection.VarianceThreshold(threshold = 0.0)
删除所有低方差特征
- Variance.fit_transform(X)
- X:numpy array格式的数据[n_samples,n_features]
- 返回值:训练集差异低于threshold的特征将被删除。默认值是保留所有非零方差特征,即删除所有样本中具有相同值的特征。
from scipy.stats import pearsonr
计算皮尔逊相关系数
- x : (N,) array_like
- y : (N,) array_like Returns: (Pearson’s correlation coefficient, p-value)
示例
过滤低方差特征,查看特征之间的相关性
from sklearn.datasets import load_iris
from sklearn.model_selection import train_test_split
from sklearn.feature_extraction import DictVectorizer
from sklearn.feature_extraction.text import CountVectorizer, TfidfVectorizer
from sklearn.preprocessing import MinMaxScaler, StandardScaler
from sklearn.feature_selection import VarianceThreshold
from scipy.stats import pearsonr
import jieba
import pandas as pd


def variance_election():
    """过滤低方差特征"""
    # 1.获取数据
    data = pd.read_csv("../usingFiles/factor_returns.csv")  # 使用pandas库导入数据文件
    data = data.iloc[:, 1:-2]
    print("data:\n", data)
    # 2.实例化一个转换器类
    transfer = VarianceThreshold(threshold=5)  # 删除方差低于threshold的特征
    # 3.调用fit_transform
    data_new = transfer.fit_transform(data)
    print("data_new:\n", data_new, data_new.shape)

    # 4.计算某两个变量之间的相关性
    r1 = pearsonr(data["pe_ratio"], data["pb_ratio"])  # 列名来访问DataFrame里面的数据,参考https://www.jianshu.com/p/ebb64a159104
    print("pe_ratio与pb_ratio相关系数:\n", r1)
    r2 = pearsonr(data['revenue'], data['total_expense'])
    print("revenue与total_expense相关系数:\n", r2)
Embeded嵌入式
决策树
正则化
深度学习
主成分分析
2.5.2 主成分分析(PCA)
定义:高维数据转化为低维数据的过程,在此过程中可能会舍弃原有数据、创造新的变量
作用:是数据维数压缩,尽可能降低原数据的维数(复杂度),损失少量信息。
应用:回归分析或者聚类分析当中
API
sklearn.decomposition.PCA(n_components=None)
将数据分解为较低维数空间
- n_components:
- 小数:表示保留百分之多少的信息
- 整数:减少到多少特征
- PCA.fit_transform(X) X:numpy array格式的数据[n_samples,n_features]
- 返回值:转换后指定维度的array
示例
from sklearn.datasets import load_iris
from sklearn.model_selection import train_test_split
from sklearn.feature_extraction import DictVectorizer
from sklearn.feature_extraction.text import CountVectorizer, TfidfVectorizer
from sklearn.preprocessing import MinMaxScaler, StandardScaler
from sklearn.feature_selection import VarianceThreshold
from sklearn.decomposition import PCA
from scipy.stats import pearsonr
import jieba
import pandas as pd


def pca():
    """PCA降维"""
    data = [[2, 8, 4, 5],
            [6, 3, 0, 8],
            [5, 4, 9, 1]]
    # 1.实例化一个转换器类
    # n_components  小数表示保留百分之多少的信息  整数:减少到多少特征
    transfer = PCA(n_components=2)
    # 2.调用fit_transform
    data_new = transfer.fit_transform(data)
    print("data_new:\n", data_new)
2.5.3 案例:探究用户对物品类别的喜好细分
用户 物品类别
user_id aisle
1)需要将user_id和aisle放在同一个表中 - 合并
2)找到user_id和aisle - 交叉表和透视表
3)特征冗余过多 -> PCA降维
示例
探究用户对物品类别的喜好细分降维
def homework():
    """探究用户对物品类别的喜好细分降维"""
    # 1、获取数据集
    # ·商品信息- products.csv:
    # Fields:product_id, product_name, aisle_id, department_id
    # ·订单与商品信息- order_products__prior.csv:
    # Fields:order_id, product_id, add_to_cart_order, reordered
    # ·用户的订单信息- orders.csv:
    # Fields:order_id, user_id,eval_set, order_number,order_dow, order_hour_of_day, days_since_prior_order
    # ·商品所属具体物品类别- aisles.csv:
    # Fields:aisle_id, aisle

    products = pd.read_csv("../usingFiles/instacart/products.csv")
    order_products = pd.read_csv("../usingFiles/instacart/order_products__prior.csv")
    orders = pd.read_csv("../usingFiles/instacart/orders.csv")
    aisles = pd.read_csv("../usingFiles/instacart/aisles.csv")

    # 2、合并表,将user_id和aisle放在一张表上
    # 1)合并orders和order_products on=order_id tab1:order_id, product_id, user_id
    # 左表,右表,默认内连接,按"order_id"字段进行合并
    tab1 = pd.merge(orders, order_products, on=["order_id", "order_id"])
    # 2)合并tab1和products on=product_id tab2:aisle_id
    tab2 = pd.merge(tab1, products, on=["product_id", "product_id"])
    # 3)合并tab2和aisles on=aisle_id tab3:user_id, aisle
    tab3 = pd.merge(tab2, aisles, on=["aisle_id", "aisle_id"])  # 总的大表

    # 3、交叉表处理,把user_id和aisle进行分组
    table = pd.crosstab(tab3["user_id"], tab3["aisle"])  # 将大表分组
    print("table.shape", table.shape)  # (206209, 134)

    # 4、主成分分析的方法进行降维
    # 1)实例化一个转换器类PCA
    transfer = PCA(n_components=0.95)  # 减少至0.95的特征
    # 2)fit_transform
    data = transfer.fit_transform(table)

    print("data.shape:", data.shape)  # (206209, 44),较之前134个特征,明显减少了很多
机器学习概述与特征工程总结
分类算法
目标值:类别
1、sklearn转换器和预估器
2、KNN算法
3、模型选择与调优
4、朴素贝叶斯算法
5、决策树
6、随机森林
3.1 sklearn转换器和估计器
3.1.1 转换器
特征工程的父类
特征工程的接口称之为转换器
- 1 实例化 (实例化的是一个转换器类(Transformer))
- 2 调用fit_transform(对于文档建立分类词频矩阵,不能同时调用)
转换器调用有这么几种形式:
- fit_transform
- fit
- transform
fit_transform的作用相当于transform加上fit
例如在标准化中:
(x - mean) / std
- fit_transform()
- fit()->计算每一列的平均值、标准差
- transform()->(x - mean) / std进行最终的转换
3.1.2 估计器(estimator)
sklearn机器学习算法的实现
- 1 实例化一个estimator
- 2 estimator.fit(x_train, y_train) 计算
—— 调用完毕,模型生成 - 3 模型评估:
- 1)直接比对真实值和预测值
y_predict = estimator.predict(x_test)
比对:y_test == y_predict - 2)计算准确率
accuracy = estimator.score(x_test, y_test)
- 1)直接比对真实值和预测值
sklearn机器学习算法的实现
- 用于分类的估计器:
sklearn.neighbors k-近邻算法
sklearn.naive_bayes 贝叶斯
sklearn.linear_model.LogisticRegression 逻辑回归
sklearn.tree 决策树与随机森林 - 用于回归的估计器:
sklearn.linear_model.LinearRegression 线性回归
sklearn.linear_model.Ridge 岭回归 - 用于无监督学习的估计器
sklearn.cluster.KMeans 聚类
3.2 K-近邻算法
3.2.1 什么是K-近邻算法
K Nearest Neighbor
KNN核心思想:
你的“邻居”来推断出你的类别
K-近邻算法(KNN)原理
k = 1
容易受到异常点的影响
如何确定谁是邻居?
计算距离:
- 距离公式
- 欧氏距离
- 曼哈顿距离 绝对值距离
- 明可夫斯基距离
k值取值的影响
- k 值取得过小,容易受到异常点的影响
- k 值取得过大,样本不均衡的影响
性能
- 距离计算上面,时间复杂度高
K-近邻算法需要做什么样的处理
- 无量纲化的处理
标准化 - sklearn.neighbors.KNeighborsClassifier(n_neighbors=5,algorithm=‘auto’)
n_neighbors:k值
API
sklearn.neighbors.KNeighborsClassifier(n_neighbors=5,algorithm=‘auto’)
- n_neighbors:int,可选(默认= 5),k_neighbors查询默认使用的邻居数
- algorithm:{‘auto’,‘ball_tree’,‘kd_tree’,‘brute’},可选用于计算最近邻居的算法:‘ball_tree’将会使用 BallTree,‘kd_tree’将使用 KDTree。‘auto’将尝试根据传递给fit方法的值来决定最合适的算法。 (不同实现方式影响效率)
API算法中关于距离的定义
KNeighborsClassifier()定义如下:
    @_deprecate_positional_args
    def __init__(self, n_neighbors=5, *,
                 weights='uniform', algorithm='auto', leaf_size=30,
                 p=2, metric='minkowski', metric_params=None, n_jobs=None,
                 **kwargs):
        super().__init__(
            n_neighbors=n_neighbors,
            algorithm=algorithm,
            leaf_size=leaf_size, metric=metric, p=p,
            metric_params=metric_params,
            n_jobs=n_jobs, **kwargs)
        self.weights = _check_weights(weights)
注意:
- metric='minkowski’表示使用的是明可夫斯基距离
- 欧式距离和曼哈顿距离是明可夫斯基距离的特殊形式。当p=1时,为曼哈顿距离;p=2时,为欧式距离(默认)
3.2.3 案例:鸢尾花种类预测
- 1)获取数据
- 2)数据集划分
- 3)特征工程
标准化 - 4)KNN预估器流程
- 5)模型评估
示例
用KNN算法对鸢尾花进行分类
def knn_iris():
    """
    用KNN算法对鸢尾花进行分类
    :return:
    """
    # 1.获取数据
    iris = load_iris()

    # 2.划分数据集
    x_train, x_test, y_train, y_test, = train_test_split(iris.data, iris.target, random_state=6)

    # 3.特征工程:标准化
    transfer = StandardScaler()
    x_train = transfer.fit_transform(x_train)
    # x_test进行的操作要和x_train的一致。如果再fit,标准差和方差就不一样了。默认训练集和测试集来自总体样本 有同样的均值和标准差
    x_test = transfer.transform(x_test)

    # 4.KNN算法预估器
    estimator = KNeighborsClassifier(n_neighbors=3)
    estimator.fit(x_train, y_train)

    # 5.模型评估
    # 方法1:直接比对真实值和预测值
    y_predict = estimator.predict(x_test)
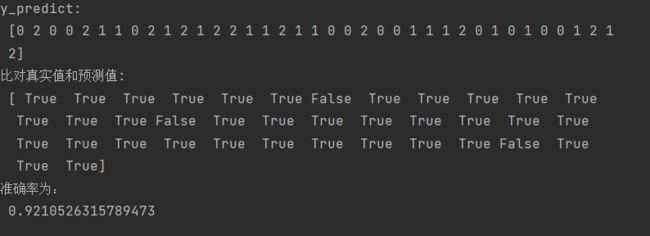
    print("y_predict:\n", y_predict)
    print("比对真实值和预测值:\n", y_test == y_predict)
    # 方法2:计算准确率
    score = estimator.score(x_test, y_test)
    print("准确率为:\n", score)
3.2.4 K-近邻总结
优点:简单,易于理解,易于实现,无需训练
缺点:
- 必须指定K值,K值选择不当则分类精度不能保证
- 懒惰算法,对测试样本分类时的计算量大,内存开销大
使用场景:小数据场景,几千~几万样本,具体场景具体业务去测试
3.3 模型选择与调优
3.3.1 交叉验证(cross validation)
将拿到的训练数据,分为训练和验证集。以下图为例:将数据分成4份,其中一份作为验证集。然后经过4次(组)的测试,每次都更换不同的验证集。即得到4组模型的结果,取平均值作为最终结果。又称4折交叉验证。
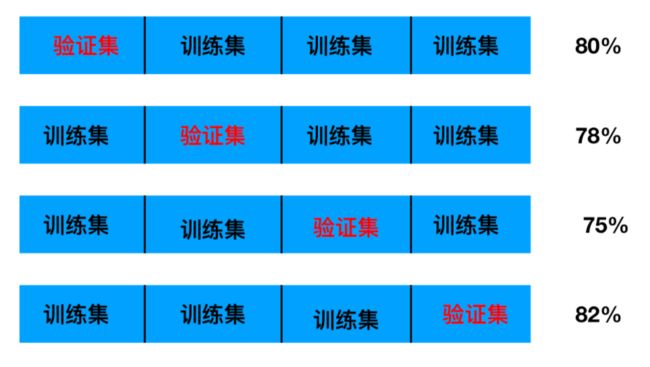
交叉验证目的:为了让被评估的模型更加准确可信
3.3.2 超参数搜索-网格搜索(Grid Search)
通常情况下,有很多参数是需要手动指定的(如k-近邻算法中的K值),这种叫超参数。但是手动过程繁杂,所以需要对模型预设几种超参数组合。每组超参数都采用交叉验证来进行评估。最后选出最优参数组合建立模型。
k的取值
[1, 3, 5, 7, 9, 11]
暴力破解
API
sklearn.model_selection.GridSearchCV(estimator, param_grid=None,cv=None)
对估计器的指定参数值进行详尽搜索
- estimator:估计器对象
- param_grid:估计器参数(dict){“n_neighbors”:[1,3,5]}
- cv:指定几折交叉验证
- fit:输入训练数据
- score:准确率
结果分析:
- bestscore:在交叉验证中验证的最好结果_
- bestestimator:最好的参数模型
- cvresults:每次交叉验证后的验证集准确率结果和训练集准确率结果
3.3.3 鸢尾花案例增加K值调优
示例
用KNN算法对鸢尾花进行分类,增加网格搜索和交叉验证
def knn_iris_gscv():
    """
    用KNN算法对鸢尾花进行分类,增加网格搜索和交叉验证
    :return:
    """
    # 1.获取数据
    iris = load_iris()

    # 2.划分数据集
    x_train, x_test, y_train, y_test, = train_test_split(iris.data, iris.target, random_state=6)

    # 3.特征工程:标准化
    transfer = StandardScaler()
    x_train = transfer.fit_transform(x_train)
    # x_test进行的操作要和x_train的一致。如果再fit,标准差和方差就不一样了。默认训练集和测试集来自总体样本 有同样的均值和标准差
    x_test = transfer.transform(x_test)

    # 4.KNN算法预估器
    estimator = KNeighborsClassifier()

    # 参数准备
    param_dict = {
     "n_neighbors": [1, 3, 5, 7, 9, 11]}
    # 加入网格搜索与交叉验证
    # 参数为预估器,预估器的参数(字典形式),交叉验证折数
    estimator = GridSearchCV(estimator=estimator, param_grid=param_dict, cv=10)

    estimator.fit(x_train, y_train)

    # 5.模型评估
    # 方法1:直接比对真实值和预测值
    y_predict = estimator.predict(x_test)
    print("y_predict:\n", y_predict)
    print("比对真实值和预测值:\n", y_test == y_predict)
    # 方法2:计算准确率
    score = estimator.score(x_test, y_test)
    print("准确率为:\n", score)

    # bestparams:最佳参数
    # bestscore: 在交叉验证中验证的最好结果_
    # bestestimator:最好的参数模型
    # cvresults: 每次交叉验证后的验证集准确率结果和训练集准确率结
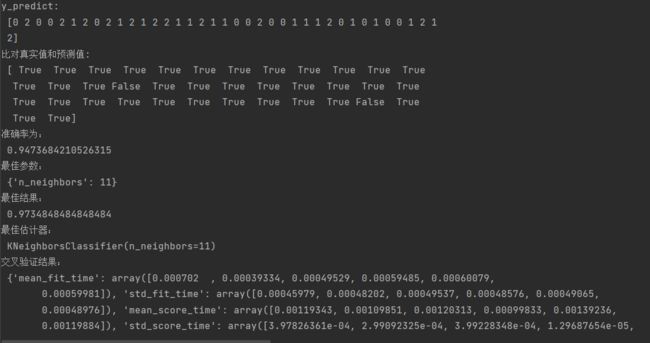
    print("最佳参数:\n", estimator.best_params_)
    print("最佳结果:\n", estimator.best_score_)
    print("最佳估计器:\n", estimator.best_estimator_)
    print("交叉验证结果:\n", estimator.cv_results_)
3.2.4 案例:预测facebook签到位置
流程分析:
- 获取数据
- 数据处理
目的:
特征值 x
目标值 y
- a.缩小数据范围
2 < x < 2.5
1.0 < y < 1.5 - b.time -> 年月日时分秒
- c.过滤签到次数少的地点
数据集划分
- 特征工程:标准化
- KNN算法预估流程
- 模型选择与调优
- 模型评估
示例
jupyter笔记
import pandas as pd
# 1.获取数据
data = pd.read_csv("FBlocation/train.csv")
data
| row_id | x | y | accuracy | time | place_id | |
|---|---|---|---|---|---|---|
| 0 | 0 | 0.7941 | 9.0809 | 54 | 470702 | 8523065625 |
| 1 | 1 | 5.9567 | 4.7968 | 13 | 186555 | 1757726713 |
| 2 | 2 | 8.3078 | 7.0407 | 74 | 322648 | 1137537235 |
| 3 | 3 | 7.3665 | 2.5165 | 65 | 704587 | 6567393236 |
| 4 | 4 | 4.0961 | 1.1307 | 31 | 472130 | 7440663949 |
| ... | ... | ... | ... | ... | ... | ... |
| 29118016 | 29118016 | 6.5133 | 1.1435 | 67 | 399740 | 8671361106 |
| 29118017 | 29118017 | 5.9186 | 4.4134 | 67 | 125480 | 9077887898 |
| 29118018 | 29118018 | 2.9993 | 6.3680 | 67 | 737758 | 2838334300 |
| 29118019 | 29118019 | 4.0637 | 8.0061 | 70 | 764975 | 1007355847 |
| 29118020 | 29118020 | 7.4523 | 2.0871 | 17 | 102842 | 7028698129 |
29118021 rows × 6 columns
# 2.基本的数据处理
# 1)缩小数据范围
data = data.query("x<2.5 & x>2 & y<1.5 & y>1.0")
data
| row_id | x | y | accuracy | time | place_id | |
|---|---|---|---|---|---|---|
| 112 | 112 | 2.2360 | 1.3655 | 66 | 623174 | 7663031065 |
| 180 | 180 | 2.2003 | 1.2541 | 65 | 610195 | 2358558474 |
| 367 | 367 | 2.4108 | 1.3213 | 74 | 579667 | 6644108708 |
| 874 | 874 | 2.0822 | 1.1973 | 320 | 143566 | 3229876087 |
| 1022 | 1022 | 2.0160 | 1.1659 | 65 | 207993 | 3244363975 |
| ... | ... | ... | ... | ... | ... | ... |
| 29115112 | 29115112 | 2.1889 | 1.2914 | 168 | 721885 | 4606837364 |
| 29115204 | 29115204 | 2.1193 | 1.4692 | 58 | 563389 | 2074133146 |
| 29115338 | 29115338 | 2.0007 | 1.4852 | 25 | 765986 | 6691588909 |
| 29115464 | 29115464 | 2.4132 | 1.4237 | 61 | 151918 | 7396159924 |
| 29117493 | 29117493 | 2.2948 | 1.0504 | 81 | 79569 | 1168869217 |
83197 rows × 6 columns
# 2)处理时间特征
# data["time"]
time_value = pd.to_datetime(data["time"],unit = "s")  # 转换为时间戳格式:用于列
time_value
112        1970-01-08 05:06:14
180        1970-01-08 01:29:55
367        1970-01-07 17:01:07
874        1970-01-02 15:52:46
1022       1970-01-03 09:46:33
                   ...
29115112   1970-01-09 08:31:25
29115204   1970-01-07 12:29:49
29115338   1970-01-09 20:46:26
29115464   1970-01-02 18:11:58
29117493   1970-01-01 22:06:09
Name: time, Length: 83197, dtype: datetime64[ns]
date = pd.DatetimeIndex(time_value) # 转换为时间戳格式:用于索引
date
DatetimeIndex(['1970-01-08 05:06:14', '1970-01-08 01:29:55',
               '1970-01-07 17:01:07', '1970-01-02 15:52:46',
               '1970-01-03 09:46:33', '1970-01-06 19:49:38',
               '1970-01-06 13:33:24', '1970-01-02 22:49:55',
               '1970-01-04 14:30:10', '1970-01-07 16:57:44',
               ...
               '1970-01-02 09:24:50', '1970-01-01 10:29:34',
               '1970-01-09 11:38:46', '1970-01-02 03:42:14',
               '1970-01-04 22:02:44', '1970-01-09 08:31:25',
               '1970-01-07 12:29:49', '1970-01-09 20:46:26',
               '1970-01-02 18:11:58', '1970-01-01 22:06:09'],
              dtype='datetime64[ns]', name='time', length=83197, freq=None)
date.weekday
Int64Index([3, 3, 2, 4, 5, 1, 1, 4, 6, 2,
            ...
            4, 3, 4, 4, 6, 4, 2, 4, 4, 3],
           dtype='int64', name='time', length=83197)
# 把date.day按索引添加回data
data["day"] = date.day
:2: SettingWithCopyWarning:
A value is trying to be set on a copy of a slice from a DataFrame.
Try using .loc[row_indexer,col_indexer] = value instead

See the caveats in the documentation: https://pandas.pydata.org/pandas-docs/stable/user_guide/indexing.html#returning-a-view-versus-a-copy
  data["day"] = date.day
# 把date.weekday按索引添加回data
data["weekday"] = date.weekday
:1: SettingWithCopyWarning:
A value is trying to be set on a copy of a slice from a DataFrame.
Try using .loc[row_indexer,col_indexer] = value instead

See the caveats in the documentation: https://pandas.pydata.org/pandas-docs/stable/user_guide/indexing.html#returning-a-view-versus-a-copy
  data["weekday"] = date.weekday
# 把date.hour按索引添加回data
data["hour"] = date.hour
:1: SettingWithCopyWarning:
A value is trying to be set on a copy of a slice from a DataFrame.
Try using .loc[row_indexer,col_indexer] = value instead

See the caveats in the documentation: https://pandas.pydata.org/pandas-docs/stable/user_guide/indexing.html#returning-a-view-versus-a-copy
  data["hour"] = date.hour
data
| row_id | x | y | accuracy | time | place_id | day | weekday | hour | |
|---|---|---|---|---|---|---|---|---|---|
| 112 | 112 | 2.2360 | 1.3655 | 66 | 623174 | 7663031065 | 8 | 3 | 5 |
| 180 | 180 | 2.2003 | 1.2541 | 65 | 610195 | 2358558474 | 8 | 3 | 1 |
| 367 | 367 | 2.4108 | 1.3213 | 74 | 579667 | 6644108708 | 7 | 2 | 17 |
| 874 | 874 | 2.0822 | 1.1973 | 320 | 143566 | 3229876087 | 2 | 4 | 15 |
| 1022 | 1022 | 2.0160 | 1.1659 | 65 | 207993 | 3244363975 | 3 | 5 | 9 |
| ... | ... | ... | ... | ... | ... | ... | ... | ... | ... |
| 29115112 | 29115112 | 2.1889 | 1.2914 | 168 | 721885 | 4606837364 | 9 | 4 | 8 |
| 29115204 | 29115204 | 2.1193 | 1.4692 | 58 | 563389 | 2074133146 | 7 | 2 | 12 |
| 29115338 | 29115338 | 2.0007 | 1.4852 | 25 | 765986 | 6691588909 | 9 | 4 | 20 |
| 29115464 | 29115464 | 2.4132 | 1.4237 | 61 | 151918 | 7396159924 | 2 | 4 | 18 |
| 29117493 | 29117493 | 2.2948 | 1.0504 | 81 | 79569 | 1168869217 | 1 | 3 | 22 |
83197 rows × 9 columns
# 3)过滤签到次数比较少的地点
place_count = data.groupby("place_id").count()["row_id"]
data.groupby("place_id").count()
| row_id | x | y | accuracy | time | day | weekday | hour | |
|---|---|---|---|---|---|---|---|---|
| place_id | ||||||||
| 1012165853 | 1 | 1 | 1 | 1 | 1 | 1 | 1 | 1 |
| 1013991737 | 3 | 3 | 3 | 3 | 3 | 3 | 3 | 3 |
| 1014605271 | 28 | 28 | 28 | 28 | 28 | 28 | 28 | 28 |
| 1015645743 | 4 | 4 | 4 | 4 | 4 | 4 | 4 | 4 |
| 1017236154 | 31 | 31 | 31 | 31 | 31 | 31 | 31 | 31 |
| ... | ... | ... | ... | ... | ... | ... | ... | ... |
| 9988815170 | 1 | 1 | 1 | 1 | 1 | 1 | 1 | 1 |
| 9992113332 | 1 | 1 | 1 | 1 | 1 | 1 | 1 | 1 |
| 9993074125 | 2 | 2 | 2 | 2 | 2 | 2 | 2 | 2 |
| 9994257798 | 25 | 25 | 25 | 25 | 25 | 25 | 25 | 25 |
| 9996671132 | 18 | 18 | 18 | 18 | 18 | 18 | 18 | 18 |
2514 rows × 8 columns
place_count # 获取签到次数的表
place_id
1012165853     1
1013991737     3
1014605271    28
1015645743     4
1017236154    31
              ..
9988815170     1
9992113332     1
9993074125     2
9994257798    25
9996671132    18
Name: row_id, Length: 2514, dtype: int64
place_count[place_count > 3] # 获取签到次数>3的表
place_id
1014605271     28
1015645743      4
1017236154     31
1024951487      5
1028119817      4
             ...
9936666116    140
9954155328      8
9980625005     16
9994257798     25
9996671132     18
Name: row_id, Length: 950, dtype: int64
data["place_id"].isin(place_count[place_count > 3].index.values)
112          True
180         False
367          True
874          True
1022         True
            ...
29115112     True
29115204     True
29115338     True
29115464     True
29117493     True
Name: place_id, Length: 83197, dtype: bool
data_final = data[data["place_id"].isin(place_count[place_count > 3].index.values)] # 作布尔索引
data_final
| row_id | x | y | accuracy | time | place_id | day | weekday | hour | |
|---|---|---|---|---|---|---|---|---|---|
| 112 | 112 | 2.2360 | 1.3655 | 66 | 623174 | 7663031065 | 8 | 3 | 5 |
| 367 | 367 | 2.4108 | 1.3213 | 74 | 579667 | 6644108708 | 7 | 2 | 17 |
| 874 | 874 | 2.0822 | 1.1973 | 320 | 143566 | 3229876087 | 2 | 4 | 15 |
| 1022 | 1022 | 2.0160 | 1.1659 | 65 | 207993 | 3244363975 | 3 | 5 | 9 |
| 1045 | 1045 | 2.3859 | 1.1660 | 498 | 503378 | 6438240873 | 6 | 1 | 19 |
| ... | ... | ... | ... | ... | ... | ... | ... | ... | ... |
| 29115112 | 29115112 | 2.1889 | 1.2914 | 168 | 721885 | 4606837364 | 9 | 4 | 8 |
| 29115204 | 29115204 | 2.1193 | 1.4692 | 58 | 563389 | 2074133146 | 7 | 2 | 12 |
| 29115338 | 29115338 | 2.0007 | 1.4852 | 25 | 765986 | 6691588909 | 9 | 4 | 20 |
| 29115464 | 29115464 | 2.4132 | 1.4237 | 61 | 151918 | 7396159924 | 2 | 4 | 18 |
| 29117493 | 29117493 | 2.2948 | 1.0504 | 81 | 79569 | 1168869217 | 1 | 3 | 22 |
80910 rows × 9 columns
# 筛选特征值和目标值
x = data_final[["x","y","accuracy","day","weekday","hour"]]
y = data_final["place_id"]
x
| x | y | accuracy | day | weekday | hour | |
|---|---|---|---|---|---|---|
| 112 | 2.2360 | 1.3655 | 66 | 8 | 3 | 5 |
| 367 | 2.4108 | 1.3213 | 74 | 7 | 2 | 17 |
| 874 | 2.0822 | 1.1973 | 320 | 2 | 4 | 15 |
| 1022 | 2.0160 | 1.1659 | 65 | 3 | 5 | 9 |
| 1045 | 2.3859 | 1.1660 | 498 | 6 | 1 | 19 |
| ... | ... | ... | ... | ... | ... | ... |
| 29115112 | 2.1889 | 1.2914 | 168 | 9 | 4 | 8 |
| 29115204 | 2.1193 | 1.4692 | 58 | 7 | 2 | 12 |
| 29115338 | 2.0007 | 1.4852 | 25 | 9 | 4 | 20 |
| 29115464 | 2.4132 | 1.4237 | 61 | 2 | 4 | 18 |
| 29117493 | 2.2948 | 1.0504 | 81 | 1 | 3 | 22 |
80910 rows × 6 columns
y
112         7663031065
367         6644108708
874         3229876087
1022        3244363975
1045        6438240873
               ...
29115112    4606837364
29115204    2074133146
29115338    6691588909
29115464    7396159924
29117493    1168869217
Name: place_id, Length: 80910, dtype: int64
# 数据集划分
from sklearn.model_selection import train_test_split
x_train, x_test, y_train, y_test = train_test_split(x, y, random_state=6)
from sklearn.preprocessing import StandardScaler
from sklearn.neighbors import KNeighborsClassifier
from sklearn.model_selection import GridSearchCV
# 3.特征工程:标准化
transfer = StandardScaler()
x_train = transfer.fit_transform(x_train)
# x_test进行的操作要和x_train的一致。如果再fit,标准差和方差就不一样了。默认训练集和测试集来自总体样本 有同样的均值和标准差
x_test = transfer.transform(x_test)

# 4.KNN算法预估器
estimator = KNeighborsClassifier()

# 参数准备
param_dict = {
     "n_neighbors": [3, 5, 7, 9]}
# 加入网格搜索与交叉验证
# 参数为预估器,预估器的参数(字典形式),交叉验证折数
estimator = GridSearchCV(estimator=estimator, param_grid=param_dict, cv=3)

estimator.fit(x_train, y_train)

# 5.模型评估
# 方法1:直接比对真实值和预测值
y_predict = estimator.predict(x_test)
print("y_predict:\n", y_predict)
print("比对真实值和预测值:\n", y_test == y_predict)
# 方法2:计算准确率
score = estimator.score(x_test, y_test)
print("准确率为:\n", score)

# bestparams:最佳参数
# bestscore: 在交叉验证中验证的最好结果_
# bestestimator:最好的参数模型
# cvresults: 每次交叉验证后的验证集准确率结果和训练集准确率结
print("最佳参数:\n", estimator.best_params_)
print("最佳结果:\n", estimator.best_score_)
print("最佳估计器:\n", estimator.best_estimator_)
print("交叉验证结果:\n", estimator.cv_results_)
C:\ProgramData\Anaconda3\lib\site-packages\sklearn\model_selection\_split.py:666: UserWarning: The least populated class in y has only 1 members, which is less than n_splits=3.
  warnings.warn(("The least populated class in y has only %d"


y_predict:
 [5256855055 8670584806 1380291167 ... 3190058760 3109132734 9496768941]
比对真实值和预测值:
 17293847     True
9092751      True
9288029      True
24915555     True
13698093    False
            ...
20748313     True
25273732    False
21158385    False
27015360     True
14563665     True
Name: place_id, Length: 20228, dtype: bool
准确率为:
 0.3649396875617955
最佳参数:
 {'n_neighbors': 5}
最佳结果:
 0.3351570095668855
最佳估计器:
 KNeighborsClassifier()
交叉验证结果:
 {'mean_fit_time': array([0.07156642, 0.06400251, 0.06917524, 0.06816228]), 'std_fit_time': array([0.00335161, 0.00058444, 0.00169325, 0.00499188]), 'mean_score_time': array([1.01972421, 1.03726014, 1.14579193, 1.20444155]), 'std_score_time': array([0.03234346, 0.01486961, 0.07818488, 0.03106085]), 'param_n_neighbors': masked_array(data=[3, 5, 7, 9],
             mask=[False, False, False, False],
       fill_value='?',
            dtype=object), 'params': [{'n_neighbors': 3}, {'n_neighbors': 5}, {'n_neighbors': 7}, {'n_neighbors': 9}], 'split0_test_score': array([0.32558829, 0.33750247, 0.33438798, 0.33077912]), 'split1_test_score': array([0.32204479, 0.33366293, 0.33277303, 0.32926287]), 'split2_test_score': array([0.32342908, 0.33430563, 0.33455283, 0.32852128]), 'mean_test_score': array([0.32368739, 0.33515701, 0.33390461, 0.32952109]), 'std_test_score': array([0.00145811, 0.00167912, 0.00080298, 0.00093967]), 'rank_test_score': array([4, 1, 2, 3])}
3.4 朴素贝叶斯算法
3.4.1 联合概率、条件概率与相互独立
- 联合概率:包含多个条件,且所有条件同时成立的概率
P(程序员, 匀称) P(程序员, 超重|喜欢)
P(A, B) - 条件概率:就是事件A在另外一个事件B已经发生条件下的发生概率
P(程序员|喜欢) P(程序员, 超重|喜欢)
P(A|B) - 相互独立:
P(A, B) = P(A)P(B) <=> 事件A与事件B相互独立
朴素?
假设: 特征与特征之间是相互独立
朴素贝叶斯算法:
朴素 + 贝叶斯
应用场景:
- 文本分类
- 单词作为特征
API
sklearn.naive_bayes.MultinomialNB(alpha = 1.0)
朴素贝叶斯分类
- alpha:拉普拉斯平滑系数
3.4.2 案例:20类新闻分类
1)获取数据
2)划分数据集
3)特征工程
文本特征抽取
4)朴素贝叶斯预估器流程
5)模型评估
示例
def bayes():
    """
    用朴素贝叶斯算法对新闻进行分类
    :return:
    """
    # 1)获取数据
    news = fetch_20newsgroups(subset="all")

    # 2)划分数据集
    x_train, x_test, y_train, y_test = train_test_split(news.data, news.target,random_state=6)

    # 3)特征工程:文本特征抽取-tfidf
    transfer = TfidfVectorizer()
    x_train = transfer.fit_transform(x_train)
    x_test = transfer.transform(x_test)

    # 4)朴素贝叶斯算法预估器流程
    estimator = MultinomialNB()
    estimator.fit(x_train, y_train)

    # 5)模型评估
    # 方法1:直接比对真实值和预测值
    y_predict = estimator.predict(x_test)
    print("y_predict:\n", y_predict)
    print("比对真实值和预测值:\n", y_test == y_predict)
    # 方法2:计算准确率
    score = estimator.score(x_test, y_test)
    print("准确率为:\n", score)
3.4.7 朴素贝叶斯算法总结
优点:
朴素贝叶斯模型发源于古典数学理论,有稳定的分类效率
对缺失数据不太敏感,算法也比较简单,常用于文本分类
分类准确度高,速度快
缺点:
由于使用了样本属性独立性的假设,所以如果特征属性有关联时其效果不好
例如:“我爱北京天安门”中“北京”和“天安门”并不是完全独立的
3.5 决策树
3.5.1 认识决策树
决策树思想的来源非常朴素,程序设计中的条件分支结构就是if-then结构,最早的决策树就是利用这类结构分割数据的一种分类学习方法
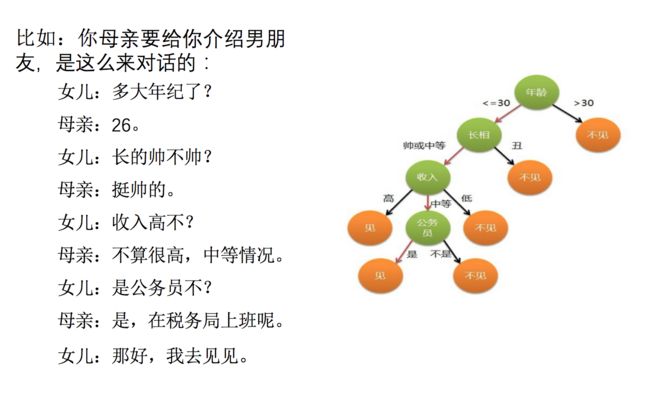
如何高效的进行决策?
特征的先后顺序
3.5.2 决策树分类原理详解
信息论基础
- 信息
香农的的定义:消除随机不定性的东西
小明 年龄 “我今年18岁” - 信息
小华 ”小明明年19岁” - 不是信息
2.5.3 信息的衡量 - 信息量 - 信息熵
H ( X ) = ∑ x ∈ X P ( x ) l o g P ( x ) H(X) = \sum\nolimits_{x \in X} P(x)logP(x) H(X)=∑x∈XP(x)logP(x)
H:信息熵
信息的单位:bit
信息和消除不确定性是相联系的
3.5.4 决策树的划分依据之一------信息增益
特征A对训练数据集D的信息增益g(D,A),定义为集合D的信息熵H(D)与特征A给定条件下D的信息条件熵H(D|A)之差:
g ( D , A ) = H ( D ) − H ( D ∣ A ) g(D,A) = H(D) - H(D|A) g(D,A)=H(D)−H(D∣A)
3.5.5 决策树的三种算法实现
决策树的原理不止信息增益这一种,还有其他方法:
- ID3
信息增益 最大的准则 - C4.5
信息增益比 最大的准则 - CART
分类树: 基尼系数 最小的准则 在sklearn中可以选择划分的默认原则
优势:划分更加细致
API
class sklearn.tree.DecisionTreeClassifier(criterion=’gini’, max_depth=None,random_state=None)
决策树分类器
- criterion:默认是’gini’系数,也可以选择信息增益的熵’entropy’
- max_depth:树的深度大小
- random_state:随机数种子
sklearn.tree.export_graphviz()
保存树的结构到dot文件
- tree.export_graphviz(estimator,out_file='tree.dot’,feature_names=[‘’,’’])
示例
用决策树对鸢尾花进行分类
- 获取数据
- 划分数据集
- 决策树预估器
- 模型评估
def decision_tree():
    """
    用决策树对鸢尾花进行分类
    :return:
    """
    # 1)获取数据集
    iris = load_iris()
    # 2)划分数据集
    x_train, x_test, y_train, y_test = train_test_split(iris.data, iris.target, random_state=6)
    # 3)决策树预估器
    estimator = DecisionTreeClassifier(criterion="entropy")  # entropy:使用信息熵
    estimator.fit(x_train, y_train)
    # 4)模型评估
    # 方法1:直接比对真实值和预测值
    y_predict = estimator.predict(x_test)
    print("y_predict:\n", y_predict)
    print("比对真实值和预测值:\n", y_test == y_predict)
    # 方法2:计算准确率
    score = estimator.score(x_test, y_test)
    print("准确率为:\n", score)
结果:

注意:
对鸢尾花分类来说决策树算法比KNN算法准确率稍差一点
没有任何一种算法可以解决所有问题
3.5.5 决策树可视化
- sklearn.tree.export_graphviz() 该函数能够导出DOT格式
tree.export_graphviz(estimator,out_file='tree.dot’,feature_names=[‘’,’’])
    # 可视化决策树
    # 不传特征名feature_names的话会很难看懂
    export_graphviz(estimator, out_file="../outputFiles/iris_tree.dot", feature_names=iris.feature_names)
- 方式1:
- 工具:(能够将dot文件转换为pdf、png)
安装graphviz
ubuntu:sudo apt-get install graphviz Mac:brew install graphviz - 运行命令
然后我们运行这个命令
dot -Tpng tree.dot -o tree.png
- 方式2:
- 打开网站决策树可视化,将dot文件内容复制进去
- 点击Generate Graph
- 方式3:
- 到网站graphviz下载地址下载并安装graphviz。参考链接windows下Graphviz安装及简单实用
用graphviz可视化决策树 - 添加环境变量graphviz/bin进path
- 命令行里使用命令dot -Tpng tree.dot -o tree.png或dot -Tpdf tree.dot -o output.pdf可以转DOT文件为pdf或png
3.5.6 案例:泰坦尼克号乘客生存预测
流程分析:
特征值 目标值
1)获取数据
2)数据处理
- 缺失值处理
- 特征值 -> 字典类型
3)准备好特征值 目标值
4)划分数据集
5)特征工程:字典特征抽取
6)决策树预估器流程
7)模型评估
示例
用决策树对泰坦尼克号乘客生存预测
注意: 后面还可以加上网格搜索和交叉验证进行depth参数的调优
import pandas as pd
# 1.获取数据
path = "titanic.csv"
titanic = pd.read_csv(path)
titanic
| row.names | pclass | survived | name | age | embarked | home.dest | room | ticket | boat | sex | |
|---|---|---|---|---|---|---|---|---|---|---|---|
| 0 | 1 | 1st | 1 | Allen, Miss Elisabeth Walton | 29.0000 | Southampton | St Louis, MO | B-5 | 24160 L221 | 2 | female |
| 1 | 2 | 1st | 0 | Allison, Miss Helen Loraine | 2.0000 | Southampton | Montreal, PQ / Chesterville, ON | C26 | NaN | NaN | female |
| 2 | 3 | 1st | 0 | Allison, Mr Hudson Joshua Creighton | 30.0000 | Southampton | Montreal, PQ / Chesterville, ON | C26 | NaN | (135) | male |
| 3 | 4 | 1st | 0 | Allison, Mrs Hudson J.C. (Bessie Waldo Daniels) | 25.0000 | Southampton | Montreal, PQ / Chesterville, ON | C26 | NaN | NaN | female |
| 4 | 5 | 1st | 1 | Allison, Master Hudson Trevor | 0.9167 | Southampton | Montreal, PQ / Chesterville, ON | C22 | NaN | 11 | male |
| ... | ... | ... | ... | ... | ... | ... | ... | ... | ... | ... | ... |
| 1308 | 1309 | 3rd | 0 | Zakarian, Mr Artun | NaN | NaN | NaN | NaN | NaN | NaN | male |
| 1309 | 1310 | 3rd | 0 | Zakarian, Mr Maprieder | NaN | NaN | NaN | NaN | NaN | NaN | male |
| 1310 | 1311 | 3rd | 0 | Zenn, Mr Philip | NaN | NaN | NaN | NaN | NaN | NaN | male |
| 1311 | 1312 | 3rd | 0 | Zievens, Rene | NaN | NaN | NaN | NaN | NaN | NaN | female |
| 1312 | 1313 | 3rd | 0 | Zimmerman, Leo | NaN | NaN | NaN | NaN | NaN | NaN | male |
1313 rows × 11 columns
x = titanic[["pclass","age","sex"]]
y = titanic["survived"]
x
| pclass | age | sex | |
|---|---|---|---|
| 0 | 1st | 29.0000 | female |
| 1 | 1st | 2.0000 | female |
| 2 | 1st | 30.0000 | male |
| 3 | 1st | 25.0000 | female |
| 4 | 1st | 0.9167 | male |
| ... | ... | ... | ... |
| 1308 | 3rd | NaN | male |
| 1309 | 3rd | NaN | male |
| 1310 | 3rd | NaN | male |
| 1311 | 3rd | NaN | female |
| 1312 | 3rd | NaN | male |
1313 rows × 3 columns
y
0       1
1       0
2       0
3       0
4       1
       ..
1308    0
1309    0
1310    0
1311    0
1312    0
Name: survived, Length: 1313, dtype: int64
# 2.数据处理
# 1)缺失值处理(使用dropna()或fillna())
x["age"].fillna(x["age"].mean(), inplace=True)  # 缺失值填补(均值),就地
C:\ProgramData\Anaconda3\lib\site-packages\pandas\core\series.py:4463: SettingWithCopyWarning:
A value is trying to be set on a copy of a slice from a DataFrame

See the caveats in the documentation: https://pandas.pydata.org/pandas-docs/stable/user_guide/indexing.html#returning-a-view-versus-a-copy
  return super().fillna(
x
| pclass | age | sex | |
|---|---|---|---|
| 0 | 1st | 29.000000 | female |
| 1 | 1st | 2.000000 | female |
| 2 | 1st | 30.000000 | male |
| 3 | 1st | 25.000000 | female |
| 4 | 1st | 0.916700 | male |
| ... | ... | ... | ... |
| 1308 | 3rd | 31.194181 | male |
| 1309 | 3rd | 31.194181 | male |
| 1310 | 3rd | 31.194181 | male |
| 1311 | 3rd | 31.194181 | female |
| 1312 | 3rd | 31.194181 | male |
1313 rows × 3 columns
# 2)转换成字典
x = x.to_dict(orient="records")  # 使用records格式
from sklearn.model_selection import train_test_split
# 3.数据集划分
x_train, x_test, y_train, y_test = train_test_split(x, y,random_state=6)
# 4.字典特征抽取
from sklearn.feature_extraction import DictVectorizer
from sklearn.tree import DecisionTreeClassifier,export_graphviz
transfer = DictVectorizer()
x_train = transfer.fit_transform(x_train)
x_test = transfer.transform(x_test)
# 3)决策树预估器
estimator = DecisionTreeClassifier(criterion="entropy", max_depth = 8)  # entropy:使用信息熵,最大深度max_depth = 8(不调整树深度的话就太长了)
estimator.fit(x_train, y_train)
# 4)模型评估
# 方法1:直接比对真实值和预测值
y_predict = estimator.predict(x_test)
print("y_predict:\n", y_predict)
print("比对真实值和预测值:\n", y_test == y_predict)
# 方法2:计算准确率
score = estimator.score(x_test, y_test)
print("准确率为:\n", score)


# 可视化决策树
# 不传特征名feature_names的话会很难看懂
# 字典特征抽取之后,特征会变为独热编码。但是transfer有个get_feature_names方法可以使用。
export_graphviz(estimator, out_file="titanic_tree.dot", feature_names=transfer.get_feature_names())
y_predict:
 [0 0 0 0 0 0 0 0 1 0 1 0 0 0 1 1 0 1 0 0 1 0 0 0 1 0 0 1 1 0 0 0 0 0 0 0 0
 0 0 0 0 0 1 0 0 0 0 0 0 0 1 0 0 0 0 0 0 1 0 1 1 1 0 1 1 0 0 0 0 0 1 0 0 0
 0 0 0 0 0 0 0 0 0 1 0 0 1 1 0 1 0 0 0 0 0 0 0 0 0 1 0 0 1 0 0 0 0 1 0 0 1
 0 1 0 0 0 1 1 0 0 0 1 0 0 0 0 0 0 0 0 0 0 1 1 1 0 0 1 1 0 0 0 0 0 0 0 1 0
 0 0 0 0 0 0 0 0 1 0 0 0 0 0 0 0 0 0 0 0 1 0 0 0 0 1 0 0 0 0 0 0 0 0 1 0 0
 0 0 1 1 0 0 0 0 1 0 0 0 0 1 0 0 1 0 0 0 0 1 0 0 1 1 0 0 0 0 0 0 1 0 0 1 0
 0 0 1 0 0 1 1 0 0 0 0 0 1 0 1 0 0 0 0 1 1 0 0 0 0 0 0 1 0 0 0 0 0 0 0 0 0
 1 1 0 1 0 0 0 1 1 0 0 0 0 1 1 0 0 0 1 0 0 0 0 0 0 0 0 0 0 0 0 1 0 0 1 0 0
 0 0 1 0 0 0 0 1 0 1 0 0 0 0 0 0 1 0 0 1 0 1 0 1 1 0 1 1 0 0 0 0 0]
比对真实值和预测值:
 975      True
459      True
1251    False
14       True
805      True
        ...
1289    False
706      True
1138     True
307      True
1183     True
Name: survived, Length: 329, dtype: bool
准确率为:
 0.8419452887537994
3.5.7 决策树总结
-
优点:
可视化 - 可解释能力强 -
缺点:
容易产生过拟合 -
改进:
减枝cart算法(决策树API当中已经实现,随机森林参数调优有相关介绍)
随机森林
3.6 集成学习方法之随机森林
3.6.1 什么是集成学习方法
集成学习通过建立几个模型组合的来解决单一预测问题。它的工作原理是生成多个分类器/模型,各自独立地学习和作出预测。这些预测最后结合成组合预测,因此优于任何一个单分类的做出预测。
3.6.2 什么是随机森林
随机
森林:包含多个决策树的分类器
其输出的类别是由个别树输出的类别的众数而定
3.6.3 随机森林原理过程
学习算法根据下列算法而建造每棵树:
用N来表示训练用例(样本)的个数,M表示特征数目。
- 一次随机选出一个样本,重复N次, (有可能出现重复的样本)
- 随机去选出m个特征, m <
采取bootstrap抽样
训练集:
N个样本
特征值 目标值
M个特征
随机
-
训练集随机 - N个样本中随机有放回的抽样N个
bootstrap 随机有放回抽样
[1, 2, 3, 4, 5]
新的树的训练集
[2, 2, 3, 1, 5] -
特征随机 - 从M个特征中随机抽取m个特征
M >> m
有降维的效果 -
为什么要随机抽样训练集?
如果不进行随机抽样,每棵树的训练集都一样,那么最终训练出的树分类结果也是完全一样的 -
为什么要有放回地抽样?
如果不是有放回的抽样,那么每棵树的训练样本都是不同的,都是没有交集的,这样每棵树都是“有偏的”,都是绝对“片面的”(当然这样说可能不对),也就是说每棵树训练出来都是有很大的差异的;而随机森林最后分类取决于多棵树(弱分类器)的投票表决。
API
class sklearn.ensemble.RandomForestClassifier(n_estimators=10, criterion=’gini’, max_depth=None, bootstrap=True, random_state=None, min_samples_split=2)
随机森林分类器
- n_estimators:integer,optional(default = 10)森林里的树木数量120,200,300,500,800,1200
- criteria:string,可选(default =“gini”)分割特征的测量方法
- max_depth:integer或None,可选(默认=无)树的最大深度 5,8,15,25,30
- max_features="auto”,每个决策树的最大特征数量
- If “auto”, then max_features=sqrt(n_features).
- If “sqrt”, then max_features=sqrt(n_features) (same as “auto”).
- If “log2”, then max_features=log2(n_features).
- If None, then max_features=n_features.
- bootstrap:boolean,optional(default = True)是否在构建树时使用放回抽样
- min_samples_split:节点划分最少样本数
- min_samples_leaf:叶子节点的最小样本数
- 超参数:n_estimator, max_depth, min_samples_split,min_samples_leaf
示例
随机森林对泰坦尼克号乘客的生存进行预测(与决策树对比)
决策树对泰坦尼克号乘客的生存进行预测
import pandas as pd
# 1.获取数据
path = "titanic.csv"
titanic = pd.read_csv(path)
titanic
| row.names | pclass | survived | name | age | embarked | home.dest | room | ticket | boat | sex | |
|---|---|---|---|---|---|---|---|---|---|---|---|
| 0 | 1 | 1st | 1 | Allen, Miss Elisabeth Walton | 29.0000 | Southampton | St Louis, MO | B-5 | 24160 L221 | 2 | female |
| 1 | 2 | 1st | 0 | Allison, Miss Helen Loraine | 2.0000 | Southampton | Montreal, PQ / Chesterville, ON | C26 | NaN | NaN | female |
| 2 | 3 | 1st | 0 | Allison, Mr Hudson Joshua Creighton | 30.0000 | Southampton | Montreal, PQ / Chesterville, ON | C26 | NaN | (135) | male |
| 3 | 4 | 1st | 0 | Allison, Mrs Hudson J.C. (Bessie Waldo Daniels) | 25.0000 | Southampton | Montreal, PQ / Chesterville, ON | C26 | NaN | NaN | female |
| 4 | 5 | 1st | 1 | Allison, Master Hudson Trevor | 0.9167 | Southampton | Montreal, PQ / Chesterville, ON | C22 | NaN | 11 | male |
| ... | ... | ... | ... | ... | ... | ... | ... | ... | ... | ... | ... |
| 1308 | 1309 | 3rd | 0 | Zakarian, Mr Artun | NaN | NaN | NaN | NaN | NaN | NaN | male |
| 1309 | 1310 | 3rd | 0 | Zakarian, Mr Maprieder | NaN | NaN | NaN | NaN | NaN | NaN | male |
| 1310 | 1311 | 3rd | 0 | Zenn, Mr Philip | NaN | NaN | NaN | NaN | NaN | NaN | male |
| 1311 | 1312 | 3rd | 0 | Zievens, Rene | NaN | NaN | NaN | NaN | NaN | NaN | female |
| 1312 | 1313 | 3rd | 0 | Zimmerman, Leo | NaN | NaN | NaN | NaN | NaN | NaN | male |
1313 rows × 11 columns
x = titanic[["pclass","age","sex"]]
y = titanic["survived"]
x
| pclass | age | sex | |
|---|---|---|---|
| 0 | 1st | 29.0000 | female |
| 1 | 1st | 2.0000 | female |
| 2 | 1st | 30.0000 | male |
| 3 | 1st | 25.0000 | female |
| 4 | 1st | 0.9167 | male |
| ... | ... | ... | ... |
| 1308 | 3rd | NaN | male |
| 1309 | 3rd | NaN | male |
| 1310 | 3rd | NaN | male |
| 1311 | 3rd | NaN | female |
| 1312 | 3rd | NaN | male |
1313 rows × 3 columns
y
0       1
1       0
2       0
3       0
4       1
       ..
1308    0
1309    0
1310    0
1311    0
1312    0
Name: survived, Length: 1313, dtype: int64
# 2.数据处理
# 1)缺失值处理(使用dropna()或fillna())
x["age"].fillna(x["age"].mean(), inplace=True)  # 缺失值填补(均值),就地
C:\ProgramData\Anaconda3\lib\site-packages\pandas\core\series.py:4463: SettingWithCopyWarning:
A value is trying to be set on a copy of a slice from a DataFrame

See the caveats in the documentation: https://pandas.pydata.org/pandas-docs/stable/user_guide/indexing.html#returning-a-view-versus-a-copy
  return super().fillna(
x
| pclass | age | sex | |
|---|---|---|---|
| 0 | 1st | 29.000000 | female |
| 1 | 1st | 2.000000 | female |
| 2 | 1st | 30.000000 | male |
| 3 | 1st | 25.000000 | female |
| 4 | 1st | 0.916700 | male |
| ... | ... | ... | ... |
| 1308 | 3rd | 31.194181 | male |
| 1309 | 3rd | 31.194181 | male |
| 1310 | 3rd | 31.194181 | male |
| 1311 | 3rd | 31.194181 | female |
| 1312 | 3rd | 31.194181 | male |
1313 rows × 3 columns
# 2)转换成字典
x = x.to_dict(orient="records")  # 使用records格式
from sklearn.model_selection import train_test_split
# 3.数据集划分
x_train, x_test, y_train, y_test = train_test_split(x, y,random_state=6)
# 4.字典特征抽取
from sklearn.feature_extraction import DictVectorizer
from sklearn.tree import DecisionTreeClassifier,export_graphviz
transfer = DictVectorizer()
x_train = transfer.fit_transform(x_train)
x_test = transfer.transform(x_test)
# 3)决策树预估器
estimator = DecisionTreeClassifier(criterion="entropy", max_depth = 8)  # entropy:使用信息熵,最大深度max_depth = 8(不调整树深度的话就太长了)
estimator.fit(x_train, y_train)
# 4)模型评估
# 方法1:直接比对真实值和预测值
y_predict = estimator.predict(x_test)
print("y_predict:\n", y_predict)
print("比对真实值和预测值:\n", y_test == y_predict)
# 方法2:计算准确率
score = estimator.score(x_test, y_test)
print("准确率为:\n", score)


# 可视化决策树
# 不传特征名feature_names的话会很难看懂
# 字典特征抽取之后,特征会变为独热编码。但是transfer有个get_feature_names方法可以使用。
export_graphviz(estimator, out_file="titanic_tree.dot", feature_names=transfer.get_feature_names())
y_predict:
 [0 0 0 0 0 0 0 0 1 0 1 0 0 0 1 1 0 1 0 0 1 0 0 0 1 0 0 1 1 0 0 0 0 0 0 0 0
 0 0 0 0 0 1 0 0 0 0 0 0 0 1 0 0 0 0 0 0 1 0 1 1 1 0 1 1 0 0 0 0 0 1 0 0 0
 0 0 0 0 0 0 0 0 0 1 0 0 1 1 0 1 0 0 0 0 0 0 0 0 0 1 0 0 1 0 0 0 0 1 0 0 1
 0 1 0 0 0 1 1 0 0 0 1 0 0 0 0 0 0 0 0 0 0 1 1 1 0 0 1 1 0 0 0 0 0 0 0 1 0
 0 0 0 0 0 0 0 0 1 0 0 0 0 0 0 0 0 0 0 0 1 0 0 0 0 1 0 0 0 0 0 0 0 0 1 0 0
 0 0 1 1 0 0 0 0 1 0 0 0 0 1 0 0 1 0 0 0 0 1 0 0 1 1 0 0 0 0 0 0 1 0 0 1 0
 0 0 1 0 0 1 1 0 0 0 0 0 1 0 1 0 0 0 0 1 1 0 0 0 0 0 0 1 0 0 0 0 0 0 0 0 0
 1 1 0 1 0 0 0 1 1 0 0 0 0 1 1 0 0 0 1 0 0 0 0 0 0 0 0 0 0 0 0 1 0 0 1 0 0
 0 0 1 0 0 0 0 1 0 1 0 0 0 0 0 0 1 0 0 1 0 1 0 1 1 0 1 1 0 0 0 0 0]
比对真实值和预测值:
 975      True
459      True
1251    False
14       True
805      True
        ...
1289    False
706      True
1138     True
307      True
1183     True
Name: survived, Length: 329, dtype: bool
准确率为:
 0.8419452887537994
随机森林对泰坦尼克号乘客的生存进行预测
from sklearn.ensemble import RandomForestClassifier
from sklearn.model_selection import GridSearchCV
estimator = RandomForestClassifier()
# 参数准备
param_dict = {
     "n_estimators":[120,200,300,500,800,1200],
              "max_depth":[5, 8, 15, 25, 30]}
# 加入网格搜索与交叉验证
# 参数为预估器,预估器的参数(字典形式),交叉验证折数
estimator = GridSearchCV(estimator=estimator, param_grid=param_dict, cv=3)
estimator.fit(x_train, y_train)

# 5.模型评估
# 方法1:直接比对真实值和预测值
y_predict = estimator.predict(x_test)
print("y_predict:\n", y_predict)
print("比对真实值和预测值:\n", y_test == y_predict)
# 方法2:计算准确率
score = estimator.score(x_test, y_test)
print("准确率为:\n", score)

# bestparams:最佳参数
# bestscore: 在交叉验证中验证的最好结果_
# bestestimator:最好的参数模型
# cvresults: 每次交叉验证后的验证集准确率结果和训练集准确率结
print("最佳参数:\n", estimator.best_params_)
print("最佳结果:\n", estimator.best_score_)
print("最佳估计器:\n", estimator.best_estimator_)
print("交叉验证结果:\n", estimator.cv_results_)
y_predict:
 [0 0 0 0 0 0 0 0 1 0 0 0 0 0 0 1 0 1 0 0 1 0 0 0 1 0 0 0 1 0 0 0 0 0 0 0 0
 0 0 0 0 0 1 0 0 0 0 0 0 0 1 0 0 0 0 0 0 1 0 1 1 1 0 1 1 0 0 0 0 0 1 0 0 0
 0 0 0 0 0 0 0 0 0 1 0 0 1 1 0 1 0 0 0 0 0 0 0 0 0 1 0 0 1 0 0 0 0 1 0 0 1
 0 1 0 0 0 1 1 0 0 0 1 0 0 0 0 0 0 0 0 0 0 1 1 1 0 0 1 1 0 0 0 0 0 0 0 1 0
 0 0 0 0 0 0 0 0 1 0 0 0 0 0 0 0 0 0 0 0 1 0 0 0 0 1 0 0 0 0 0 0 0 0 1 0 0
 0 0 1 1 0 0 0 0 1 1 0 0 0 1 0 0 1 0 0 0 0 1 0 0 1 1 0 0 0 0 0 0 1 0 0 1 0
 0 0 1 0 0 1 1 0 0 0 0 0 1 0 1 0 0 0 0 1 1 0 0 0 0 0 0 1 0 0 0 0 0 0 0 0 0
 1 1 0 1 0 0 0 1 1 0 0 0 0 1 1 0 0 0 1 0 0 0 0 0 0 0 0 0 0 0 0 1 0 0 1 0 0
 0 0 1 1 0 0 0 1 0 1 0 0 0 0 0 0 1 0 0 1 0 1 0 1 1 0 1 1 0 0 0 0 0]
比对真实值和预测值:
 975      True
459      True
1251    False
14       True
805      True
        ...
1289    False
706      True
1138     True
307      True
1183     True
Name: survived, Length: 329, dtype: bool
准确率为:
 0.8449848024316109
最佳参数:
 {'max_depth': 5, 'n_estimators': 120}
最佳结果:
 0.8272357723577235
最佳估计器:
 RandomForestClassifier(max_depth=5, n_estimators=120)
交叉验证结果:
 {'mean_fit_time': array([0.18186831, 0.29320486, 0.44023999, 0.79021676, 1.25128754,
       2.1592652 , 0.21206069, 0.35529709, 0.5498182 , 0.89730795,
       1.39199805, 2.09323414, 0.21731591, 0.38194402, 0.63251607,
       0.98638781, 1.48879186, 2.18176738, 0.20278017, 0.35338767,
       0.5142618 , 0.85738675, 1.44778188, 2.20520655, 0.20247094,
       0.34143456, 0.51811051, 0.89028573, 1.39967577, 2.30746929]), 'std_fit_time': array([0.01458096, 0.00940454, 0.00621527, 0.06155907, 0.05462934,
       0.21073782, 0.0073635 , 0.00844496, 0.02905444, 0.04290431,
       0.00196765, 0.02690286, 0.00254287, 0.029965  , 0.02889213,
       0.04170954, 0.06865524, 0.0712285 , 0.00370122, 0.00711446,
       0.01143657, 0.00829918, 0.08863975, 0.04979794, 0.0048997 ,
       0.00263295, 0.00980575, 0.02671488, 0.03325707, 0.28623954]), 'mean_score_time': array([0.01493835, 0.02128649, 0.03522841, 0.06150651, 0.08927639,
       0.18375158, 0.01461236, 0.02525481, 0.0406092 , 0.06216884,
       0.09825635, 0.14681244, 0.01598191, 0.02458946, 0.04510347,
       0.06146153, 0.09638373, 0.14889042, 0.0169541 , 0.02528691,
       0.03958217, 0.06115754, 0.09573348, 0.14860551, 0.01593494,
       0.0232691 , 0.03887431, 0.05984068, 0.09641663, 0.16554809]), 'std_score_time': array([0.00081365, 0.00092487, 0.00168473, 0.00613308, 0.00254961,
       0.05351136, 0.00047814, 0.00125562, 0.00039674, 0.00125266,
       0.00179419, 0.00241223, 0.00164428, 0.00169913, 0.00484611,
       0.00123792, 0.00097978, 0.0132129 , 0.00295479, 0.00095421,
       0.0036865 , 0.0023665 , 0.001395  , 0.00454034, 0.00082758,
       0.00045111, 0.00081317, 0.00080015, 0.00287013, 0.03473623]), 'param_max_depth': masked_array(data=[5, 5, 5, 5, 5, 5, 8, 8, 8, 8, 8, 8, 15, 15, 15, 15, 15,
                   15, 25, 25, 25, 25, 25, 25, 30, 30, 30, 30, 30, 30],
             mask=[False, False, False, False, False, False, False, False,
                   False, False, False, False, False, False, False, False,
                   False, False, False, False, False, False, False, False,
                   False, False, False, False, False, False],
       fill_value='?',
            dtype=object), 'param_n_estimators': masked_array(data=[120, 200, 300, 500, 800, 1200, 120, 200, 300, 500, 800,
                   1200, 120, 200, 300, 500, 800, 1200, 120, 200, 300,
                   500, 800, 1200, 120, 200, 300, 500, 800, 1200],
             mask=[False, False, False, False, False, False, False, False,
                   False, False, False, False, False, False, False, False,
                   False, False, False, False, False, False, False, False,
                   False, False, False, False, False, False],
       fill_value='?',
            dtype=object), 'params': [{'max_depth': 5, 'n_estimators': 120}, {'max_depth': 5, 'n_estimators': 200}, {'max_depth': 5, 'n_estimators': 300}, {'max_depth': 5, 'n_estimators': 500}, {'max_depth': 5, 'n_estimators': 800}, {'max_depth': 5, 'n_estimators': 1200}, {'max_depth': 8, 'n_estimators': 120}, {'max_depth': 8, 'n_estimators': 200}, {'max_depth': 8, 'n_estimators': 300}, {'max_depth': 8, 'n_estimators': 500}, {'max_depth': 8, 'n_estimators': 800}, {'max_depth': 8, 'n_estimators': 1200}, {'max_depth': 15, 'n_estimators': 120}, {'max_depth': 15, 'n_estimators': 200}, {'max_depth': 15, 'n_estimators': 300}, {'max_depth': 15, 'n_estimators': 500}, {'max_depth': 15, 'n_estimators': 800}, {'max_depth': 15, 'n_estimators': 1200}, {'max_depth': 25, 'n_estimators': 120}, {'max_depth': 25, 'n_estimators': 200}, {'max_depth': 25, 'n_estimators': 300}, {'max_depth': 25, 'n_estimators': 500}, {'max_depth': 25, 'n_estimators': 800}, {'max_depth': 25, 'n_estimators': 1200}, {'max_depth': 30, 'n_estimators': 120}, {'max_depth': 30, 'n_estimators': 200}, {'max_depth': 30, 'n_estimators': 300}, {'max_depth': 30, 'n_estimators': 500}, {'max_depth': 30, 'n_estimators': 800}, {'max_depth': 30, 'n_estimators': 1200}], 'split0_test_score': array([0.81097561, 0.80182927, 0.80487805, 0.80487805, 0.80182927,
       0.80182927, 0.78963415, 0.78963415, 0.78963415, 0.78963415,
       0.78963415, 0.78963415, 0.79268293, 0.78658537, 0.78963415,
       0.79268293, 0.78963415, 0.79268293, 0.78658537, 0.78963415,
       0.78963415, 0.79268293, 0.78963415, 0.79268293, 0.79268293,
       0.79268293, 0.78963415, 0.79268293, 0.78963415, 0.78963415]), 'split1_test_score': array([0.81707317, 0.81097561, 0.81707317, 0.81707317, 0.81707317,
       0.81707317, 0.81097561, 0.81097561, 0.81097561, 0.81097561,
       0.81097561, 0.81097561, 0.80487805, 0.79878049, 0.79878049,
       0.79878049, 0.80182927, 0.80182927, 0.80182927, 0.80487805,
       0.79878049, 0.80182927, 0.80487805, 0.80182927, 0.80487805,
       0.80487805, 0.80182927, 0.79878049, 0.79878049, 0.80182927]), 'split2_test_score': array([0.85365854, 0.85365854, 0.85365854, 0.85365854, 0.85365854,
       0.85365854, 0.84146341, 0.84146341, 0.8445122 , 0.84146341,
       0.84146341, 0.84146341, 0.83841463, 0.84146341, 0.84146341,
       0.84146341, 0.84146341, 0.83841463, 0.83536585, 0.83841463,
       0.83841463, 0.83536585, 0.83841463, 0.84146341, 0.84146341,
       0.83536585, 0.83841463, 0.83841463, 0.83536585, 0.83536585]), 'mean_test_score': array([0.82723577, 0.82215447, 0.82520325, 0.82520325, 0.82418699,
       0.82418699, 0.81402439, 0.81402439, 0.81504065, 0.81402439,
       0.81402439, 0.81402439, 0.81199187, 0.80894309, 0.80995935,
       0.81097561, 0.81097561, 0.81097561, 0.80792683, 0.81097561,
       0.80894309, 0.80995935, 0.81097561, 0.81199187, 0.81300813,
       0.81097561, 0.80995935, 0.80995935, 0.80792683, 0.80894309]), 'std_test_score': array([0.01884882, 0.02258751, 0.02072772, 0.02072772, 0.02174892,
       0.02174892, 0.02126875, 0.02126875, 0.02258751, 0.02126875,
       0.02126875, 0.02126875, 0.01933567, 0.02352812, 0.02258751,
       0.02170138, 0.02212555, 0.01975836, 0.02037595, 0.02037595,
       0.02117141, 0.01834905, 0.02037595, 0.02117141, 0.02072772,
       0.01795073, 0.02072772, 0.02027433, 0.01975836, 0.01933567]), 'rank_test_score': array([ 1,  6,  2,  2,  4,  4,  8,  8,  7,  8,  8,  8, 14, 26, 23, 16, 16,
       16, 29, 16, 26, 22, 16, 14, 13, 16, 23, 23, 29, 26])}
3.6.4 随机森林总结
- 在当前所有算法中,具有极好的准确率
- 能够有效地运行在大数据集上,处理具有高维特征的输入样本,而且不需要降维
- 能够评估各个特征在分类问题上的重要性
分类算法总结
能够有效地运行在大数据集上,
处理具有高维特征的输入样本,而且不需要降维
回归和聚类
线性回归
欠拟合与过拟合
岭回归
分类算法:逻辑回归
模型保存与加载
无监督学习 K-means算法
4.1 线性回归
回归问题:
目标值:连续型的数据
4.1.1 线性回归的原理
定义:线性回归(Linear regression)是利用回归方程(函数)对一个或多个自变量(特征值)和因变量(目标值)之间关系进行建模的一种分析方式。
特点:只有一个自变量的情况称为单变量回归,大于一个自变量情况的叫做多元回归
线性回归当中主要有两种模型,⼀种是线性关系,另⼀种是⾮线性关系
-
线性关系
h ( x ) = w 1 x 1 + w 2 x 2 + w 3 x 3 + … … + w n x n + b = w T x + b w , x 可 以 理 解 为 矩 阵 : w = ( b w 1 w 2 ) , x = ( 1 x 1 x 2 ) \begin{aligned} h(x) &= w_1x_1 + w_2x_2 + w_3x_3 + …… + w_nx_n + b\\ &= w^Tx + b\\ \end{aligned}\\w,x可以理解为矩阵: \left. w=\begin{pmatrix} b\\ w_1\\ w_2\\ \end{pmatrix} ,x = \begin{pmatrix} 1\\ x_1\\ x_2\\ \end{pmatrix} \right. h(x)=w1x1+w2x2+w3x3+……+wnxn+b=wTx+bw,x可以理解为矩阵:w=⎝⎛bw1w2⎠⎞,x=⎝⎛1x1x2⎠⎞ -
非线性关系
h ( x ) = w 1 x 1 + w 2 x 2 2 + w 3 x 3 3 + w 4 x 4 3 + … … + b h(x) = w_1x_1 + w_2x_2^2 + w_3x_3^3 + w_4x_4^3 + …… + b h(x)=w1x1+w2x22+w3x33+w4x43+……+b
4.1.2 线性回归的损失和优化原理
目标:求模型参数
模型参数能够使得预测准确
损失函数cost:
最小二乘法
j ( θ ) = ( h w ( x 1 ) − y 1 ) 2 + ( h w ( x 2 ) − y 2 ) 2 + . . . + ( h w ( x m ) − y m ) 2 = ∑ i = 1 m ( h w ( x i ) − y i ) 2 \begin{aligned} j(\theta) &= (h_w(x_1) - y_1)^2 +(h_w(x_2) - y_2)^2+...+(h_w(x_m) - y_m)^2\\ &= \sum\nolimits_{i = 1}^m (h_w(x_i) - y_i)^2 \end{aligned} j(θ)=(hw(x1)−y1)2+(hw(x2)−y2)2+...+(hw(xm)−ym)2=∑i=1m(hw(xi)−yi)2
y i y_i yi为第i个训练样本的真实值
h ( x i ) h(x_i) h(xi)为第i个训练样本特征值组合预测函数
优化损失
优化方法:
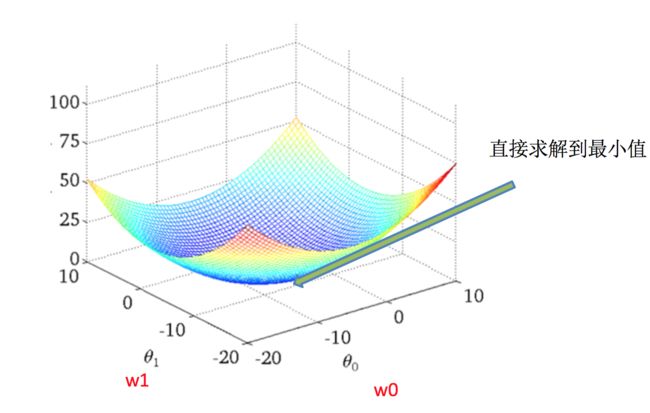
- 正规方程
直接求解W
w = ( X T X ) − 1 X T y w = (X^TX)^{-1}X^Ty w=(XTX)−1XTy
X为特征值矩阵,y为目标值矩阵。直接求到最好的结果.
缺点:当特征过多过复杂时,求解速度太慢并且得不到结果
- 梯度下降(Gradient Descent)
试错、改进
w 1 : = w 1 − α ∂ c o s t ( w 0 + w 1 x 1 ) ∂ w 1 w 0 : = w 0 − α ∂ c o s t ( w 0 + w 1 x 1 ) ∂ w 1 \begin{aligned} w_1 &:= w_1 - \alpha\frac{\partial cost(w_0+w_1x_1)}{\partial w_1}\\ w_0 &:= w_0 - \alpha\frac{\partial cost(w_0+w_1x_1)}{\partial w_1} \end{aligned} w1w0:=w1−α∂w1∂cost(w0+w1x1):=w0−α∂w1∂cost(w0+w1x1)
α为学习速率,需要手动指定(超参数),α旁边的整体表示方向
沿着这个函数下降的方向找,最后就能找到山谷的最低点,然后更新W值
使用:面对训练数据规模十分庞大的任务 ,能够找到较好的结果
API
sklearn.linear_model.LinearRegression(fit_intercept=True)
通过正规方程优化
- fit_intercept:是否计算偏置
- LinearRegression.coef_:回归系数
- LinearRegression.intercept_:偏置
sklearn.linear_model.SGDRegressor(loss=“squared_loss”, fit_intercept=True, learning_rate =‘invscaling’, eta0=0.01)
SGDRegressor类实现了随机梯度下降学习,它支持不同的loss函数和正则化惩罚项来拟合线性回归模型。
- loss:损失类型
- loss=”squared_loss”: 普通最小二乘法
- fit_intercept:是否计算偏置
- learning_rate : string, optional
学习率填充- ‘constant’: eta = eta0
- ‘optimal’: eta = 1.0 / (alpha * (t + t0)) [default]
- ‘invscaling’: eta = eta0 / pow(t, power_t)
- power_t=0.25:存在父类当中
- 对于一个常数值的学习率来说,可以使用learning_rate=’constant’ ,并使用eta0来指定学习率。
- SGDRegressor.coef_:回归系数
- SGDRegressor.intercept_:偏置
4.1.3 回归性能评估
均方误差(Mean Squared Error)MSE)评价机制:
M S E = 1 m ∑ i = 1 m ( y i − y ˉ ) 2 M S E=\frac{1}{m} \sum_{i=1}^{m}\left(y^{i}-\bar{y}\right)^{2} MSE=m1i=1∑m(yi−yˉ)2
线性回归评估
注: y i y^i yi为预测值, y ˉ \bar{y} yˉ为真实值
API
sklearn.metrics.mean_squared_error(y_true, y_pred)
均方误差回归损失
- y_true:真实值
- y_pred:预测值
- return:浮点数结果
4.1.4 波士顿房价预测
流程:
1)获取数据集
2)划分数据集
3)特征工程:
无量纲化 - 标准化
4)预估器流程
fit() --> 模型
coef_ intercept_
5)模型评估
回归的性能评估:
均方误差
6)正规方程和梯度下降对比
示例
正规方程的优化方法对波士顿房价进行预测
梯度下降的优化方法对波士顿房价进行预测
def linear_regular():
    """
    正规方程的优化方法对波士顿房价进行预测
    :return:
    """
    # 1.获取数据
    boston = load_boston()
    print("特征数量:\n", boston.data.shape)
    # 2.划分数据集
    x_train, x_test, y_train, y_test = train_test_split(boston.data, boston.target, random_state=6)
    # 3.标准化
    transfer = StandardScaler()
    x_train = transfer.fit_transform(x_train)
    x_test = transfer.transform(x_test)
    # 4.预估器
    estimator = LinearRegression()
    estimator.fit(x_train, y_train)
    # 5.得出模型
    print("正规方程-权重系数为:\n", estimator.coef_)
    print("正规方程-偏置为:\n", estimator.intercept_)
    # 6. 模型评估
    y_predict = estimator.predict(x_test)
    print("正规方程-预测房价:\n", y_predict)
    error = mean_squared_error(y_test, y_predict)
    print("正规方程-均方误差为:\n", error)


def linear_gradient():
    """
    梯度下降的优化方法对波士顿房价进行预测
    :return:
    """
    # 1.获取数据
    boston = load_boston()
    # 2.划分数据集
    x_train, x_test, y_train, y_test = train_test_split(boston.data, boston.target, random_state=6)
    # 3.标准化
    transfer = StandardScaler()
    x_train = transfer.fit_transform(x_train)
    x_test = transfer.transform(x_test)
    # 4.预估器
    estimator = SGDRegressor(learning_rate="constant", eta0=0.001, max_iter=10000)
    estimator.fit(x_train, y_train)
    # 5.得出模型
    print("梯度下降-权重系数为:\n", estimator.coef_)
    print("梯度下降-偏置为:\n", estimator.intercept_)
    # 6. 模型评估
    y_predict = estimator.predict(x_test)
    print("梯度下降-预测房价:\n", y_predict)
    error = mean_squared_error(y_test, y_predict)
    print("梯度下降-均方误差为:\n", error)
结果:
特征数量:
 (506, 13)
正规方程-权重系数为:
 [-0.71098981  1.34430486 -0.24830819  0.59699062 -1.6751905   2.25585013
  0.00668935 -3.42497656  2.91989604 -2.49577802 -2.08941361  0.80873007
 -4.03393869]
正规方程-偏置为:
 22.7759894459103
正规方程-预测房价:
 [25.08095229 25.2760028  30.05782528 23.61162154 19.95787494 19.82870792
 16.55466133 40.57544371 20.71763347 19.53472156 23.51533551 12.82070801
 28.47000898 34.27057696 32.68313296 18.12909988 13.04198598 28.84546622
 17.87406709 16.4344614  16.44281137 28.89768079 25.27457042 19.63269968
 20.29239523 19.61892888 20.78292291 31.61584086 19.88165331 25.79372242
 25.65145888 23.54842843 31.93278889 36.45363498 15.70269887 23.29664887
 14.82193148 21.26249378 20.09954649  3.00275447 11.63645868 11.1328048
 12.51219511 13.18111257 21.89136768 24.95186224 33.52822371 23.60916351
 19.55993372 18.83559297 21.28893987 16.6103212  24.2196781  20.81863536
 34.86715584 24.21424119 12.78592728 32.58054964 17.62806453 19.27352661
 24.12918602 23.95171919 11.79721797 29.75145161 14.38013728 16.23632262
 34.91207707 14.87267762 26.35841138 34.44766235  8.20739722 21.93655268
 16.45037898 22.71700314 30.25655462 22.84172119 14.02350195 42.47177251
 12.46037953 21.73778245 20.49768758 12.74428461  0.96659081 36.23647593
 18.37342587 35.14373343 13.23557004 19.02766522 13.08991684 37.97722358
 13.4563805   3.95161987 16.39486925 30.06041986 20.48117772 18.3674145
 29.25608649 18.54324251 27.2144097  16.70749969 20.9799726  24.49689941
  8.09113062 16.96832466 22.68774158 10.11464351 27.44050931 24.29125999
 19.87235642 18.60393181 29.26180242 21.76238571 31.78695725 27.50201046
 21.80250778 25.01697792 18.15059801 19.50944161 39.73125223 20.68110297
 24.72320892  8.01831374 25.99642189 20.32450042  5.8758195  16.8656137
 38.68048962]
正规方程-均方误差为:
 25.65683332692817
梯度下降-权重系数为:
 [-0.67979902  1.27978892 -0.35073963  0.64827421 -1.63156442  2.2991484
 -0.01017412 -3.40523871  2.56994898 -2.10984977 -2.08481928  0.80245203
 -4.03189935]
梯度下降-偏置为:
 [22.78163725]
梯度下降-预测房价:
 [25.13130392 25.27944171 29.95124333 23.65505166 19.85259497 19.85916817
 16.54265557 40.94841021 20.67666981 19.73572455 23.50901958 12.79362477
 28.5742886  34.11413465 32.89240004 18.10568812 13.1475064  28.95523437
 17.8118736  16.48137874 16.49846468 28.90690126 25.20150033 19.469248
 20.24911501 19.60284028 20.75241558 31.3257718  19.93981499 25.80240988
 25.52846737 23.51174711 32.05593277 36.58917066 15.99619879 23.49204364
 14.86124803 21.04633424 19.64668236  3.06188811 11.61687551 11.13320548
 12.60027167 13.12508912 21.8463183  24.9183801  33.43948929 23.47989381
 19.69478524 18.77105318 21.25707888 16.56380765 24.23611176 20.78040925
 34.99389548 24.23862641 12.90161828 32.31275372 17.60921422 19.31814701
 23.99112376 23.92251289 11.79942926 29.75667715 15.04209818 16.13653429
 34.67353716 14.96643504 26.40867208 34.6318897   8.23830057 22.03096183
 16.327354   23.05378556 30.27725312 22.7487008  14.24906096 42.21079516
 12.58898594 21.5805386  20.6593918  12.64241598  0.81963686 36.16563743
 18.13377433 35.10865951 13.11816968 18.94973316 13.12395348 37.9679588
 13.37316595  3.85020172 16.31673846 29.93393022 20.57218577 18.32033439
 29.01193774 18.50731507 27.02645828 16.68602674 21.02892728 24.41576746
  7.93102772 16.94989225 22.53956248 10.01366092 27.37012681 24.26922143
 20.13397156 18.74622632 29.27645092 21.69374131 31.65052714 27.58274273
 21.88984163 25.04890066 18.29082492 19.48715067 40.06573094 20.59526026
 24.72070801  7.94933974 25.91268398 20.21323339  5.74818631 16.88547129
 38.53958881]
梯度下降-均方误差为:
 25.51197182808926
4.1.5 正规方程和梯度下降对比
| 梯度下降 | 正规方程 |
|---|---|
| 需要选择学习率 | 不需要 |
| 需要迭代求解 | 一次运算得出 |
| 特征数量较大可以使用 | 需要计算方程,时间复杂度高O(n3) |
- 小规模数据:
- LinearRegression(不能解决拟合问题)
- 岭回归
- 大规模数据:SGDRegressor
4.2 欠拟合与过拟合
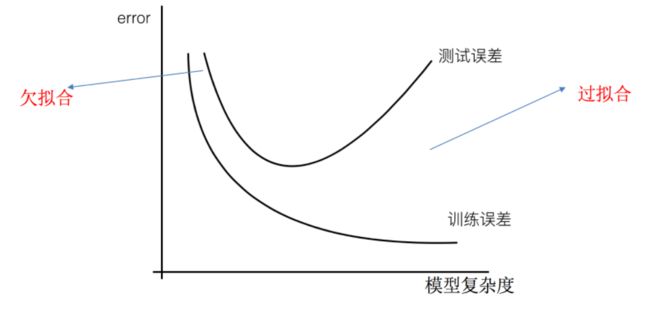
过拟合:一个假设在训练数据上能够获得比其他假设更好的拟合, 但是在测试数据集上却不能很好地拟合数据,此时认为这个假设出现了过拟合的现象。(模型过于复杂)
欠拟合:一个假设在训练数据上不能获得更好的拟合,并且在测试数据集上也不能很好地拟合数据,此时认为这个假设出现了欠拟合的现象。(模型过于简单)
4.2.1 什么是过拟合与欠拟合
- 欠拟合
学习到数据的特征过少
解决:
增加数据的特征数量 - 过拟合
原始特征过多,存在一些嘈杂特征, 模型过于复杂是因为模型尝试去兼顾各个测试数据点
解决:- 正则化
- j ( w ) = 1 2 m ∑ i = 1 m ( h w ( x i ) − y i ) 2 − α ∑ j = 1 n w j 2 j(w) = \frac{1}{2m}\sum_{i=1}^m (h_w(x_i)-y_i)^2 - \alpha\sum_{j=1}^n w_j^2 j(w)=2m1i=1∑m(hw(xi)−yi)2−αj=1∑nwj2
- α \alpha α 正则化力度,也称惩罚项系数
- L1正则化
损失函数 + α \alpha α惩罚项(惩罚项为 ∣ w j ∣ |w_j| ∣wj∣)
作⽤:可以使得其中⼀些W的值直接为0,删除这个特征的影响
LASSO回归 - L2正则化
损失函数 + α \alpha α惩罚项(惩罚项为 w j 2 w_j^2 wj2)
作⽤:可以使得其中⼀些W的都很⼩,都接近于0,削弱某个特征的影响
优点:越⼩的参数说明模型越简单,越简单的模型则越不容易产⽣过拟合现象
Ridge回归(岭回归)
- L1正则化
4.3 线性回归的改进-岭回归
API
sklearn.linear_model.Ridge(alpha=1.0, fit_intercept=True,solver=“auto”, normalize=False)
具有l2正则化的线性回归
- alpha:正则化力度,也叫 α \alpha α
α \alpha α取值:0~1 1~10 - fit_intercept:是否添加偏置。一般建议添加,可使模型更准确。
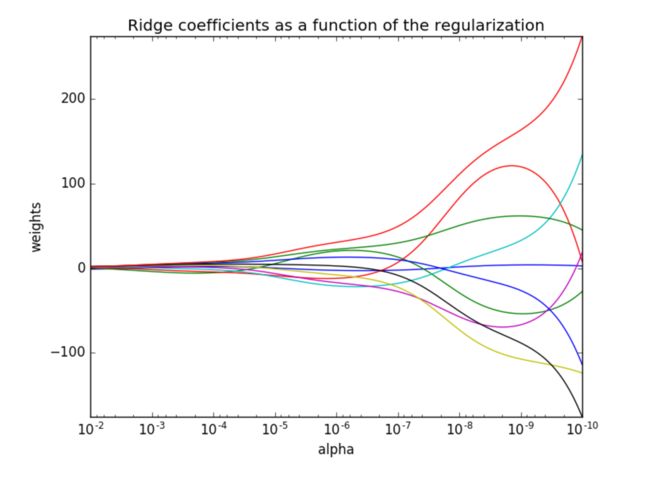
- solver:会根据数据自动选择优化方法
- sag:如果数据集、特征都比较大,选择该随机梯度下降优化
- normalize:数据是否进行标准化
- normalize=False:可以在fit之前调用preprocessing.StandardScaler标准化数据
- Ridge.coef_:回归权重
- Ridge.intercept_:回归偏置
注意: Ridge方法相当于SGDRegressor(penalty=‘l2’, loss=“squared_loss”),只不过SGDRegressor实现了一个普通的随机梯度下降学习,推荐使用Ridge(实现了SAG)
sklearn.linear_model.RidgeCV(_BaseRidgeCV, RegressorMixin)
具有L2正则化的线性回归,可以进行交叉验证
- coef_:回归系数
- 正则化力度越大,权重系数会越小
- 正则化力度越小,权重系数会越大
示例
岭回归对波士顿房价进行预测
def linear_ridge():
    """
    岭回归对波士顿房价进行预测
    :return:
    """
    # 1.获取数据
    boston = load_boston()
    # 2.划分数据集
    x_train, x_test, y_train, y_test = train_test_split(boston.data, boston.target, random_state=6)
    # 3.标准化
    transfer = StandardScaler()
    x_train = transfer.fit_transform(x_train)
    x_test = transfer.transform(x_test)
    # 4.预估器
    estimator = Ridge(alpha=0.5, max_iter=10000)
    estimator.fit(x_train, y_train)
    # 5.得出模型
    print("岭回归-权重系数为:\n", estimator.coef_)
    print("岭回归-偏置为:\n", estimator.intercept_)
    # 6. 模型评估
    y_predict = estimator.predict(x_test)
    print("岭回归-预测房价:\n", y_predict)
    error = mean_squared_error(y_test, y_predict)
    print("岭回归-均方误差为:\n", error)
岭回归-权重系数为:
 [-7.04231681e-01  1.33041720e+00 -2.59987972e-01  6.00315707e-01
 -1.65893054e+00  2.26509845e+00  2.43605166e-03 -3.40240744e+00
  2.86869841e+00 -2.44785248e+00 -2.08415657e+00  8.08735471e-01
 -4.02394788e+00]
岭回归-偏置为:
 22.7759894459103
岭回归-预测房价:
 [25.07949328 25.29021557 30.02974096 23.61899404 19.9710079  19.84476461
 16.54284771 40.59469612 20.73756011 19.55255436 23.53957418 12.81871577
 28.52350039 34.23206518 32.70566557 18.15344804 13.0634065  28.84676584
 17.86411957 16.43717347 16.44700541 28.88979458 25.23703799 19.63114124
 20.27884506 19.61430067 20.79254046 31.56033083 19.90235682 25.77786332
 25.62792442 23.5361984  31.92565148 36.45267845 15.76021006 23.31205429
 14.82953215 21.25068406 20.04555336  3.03038599 11.64138205 11.15681294
 12.5432071  13.17853187 21.87124416 24.95184359 33.5010013  23.59793165
 19.57464371 18.81974798 21.29314667 16.5876354  24.20751071 20.81588862
 34.870923   24.25053509 12.80814125 32.52907422 17.62742971 19.29576771
 24.12432645 23.94135818 11.80765325 29.73547854 14.46264706 16.21826787
 34.86517441 14.8893257  26.35116709 34.45121867  8.24132371 21.94649839
 16.41816416 22.75616193 30.26291085 22.8418245  14.08864276 42.41266764
 12.49020915 21.72968056 20.50090298 12.76441284  0.95508468 36.20048043
 18.36147312 35.12214578 13.21168337 19.01540413 13.10578255 37.96150988
 13.44434931  3.94293935 16.37883771 30.01810724 20.50455763 18.3548562
 29.21004178 18.54017068 27.1937077  16.70273628 20.99642982 24.48666442
  8.1064437  16.96903457 22.68005256 10.10346679 27.43912041 24.2919576
 19.94299566 18.62552699 29.23593571 21.74558697 31.7497255  27.50108467
 21.80595209 25.03711764 18.17255838 19.5080104  39.73919539 20.64669522
 24.73544501  8.01806299 25.97674213 20.32184597  5.86425889 16.88369125
 38.65010857]
岭回归-均方误差为:
 25.616624620150485
4.4 分类算法-逻辑回归与二分类
逻辑回归(Logistic Regression)是机器学习中的一种分类模型,逻辑回归是一种分类算法,虽然名字中带有回归,但是它与回归之间有一定的联系。由于算法的简单和高效,在实际中应用非常广泛。
4.4.1 逻辑回归的应用场景
广告点击率 是否会被点击
是否为垃圾邮件
是否患病
是否为金融诈骗
是否为虚假账号
正例 / 反例
4.4.2 逻辑回归的原理
注意: 线型回归的输出就是逻辑回归的输入
输入
h ( w ) = w 1 x 1 + w 2 x 2 + w 3 x 3 + … … + w n x n + b h(w) = w_1x_1 + w_2x_2 + w_3x_3 + …… + w_nx_n + b h(w)=w1x1+w2x2+w3x3+……+wnxn+b
激活函数
sigmoid函数
g ( θ T x ) = 1 1 + e − T x g(\theta^Tx) = \frac{1}{1+e^{-Tx}} g(θTx)=1+e−Tx1
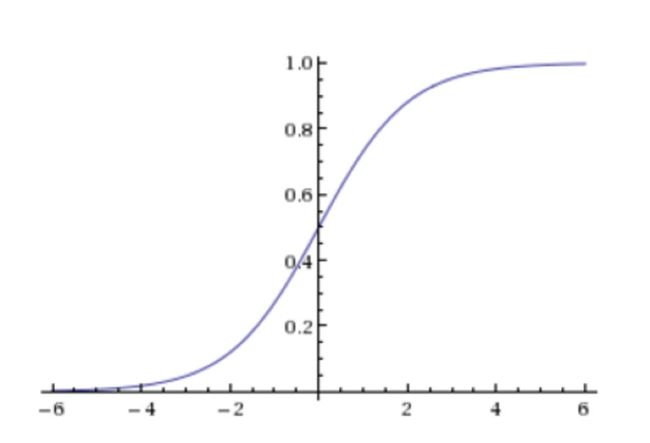
回归的结果输入到sigmoid函数当中
输出结果:[0, 1]区间中的一个概率值,默认为0.5为阈值
假设函数/线性模型
1 1 + e − ( w 1 x 1 + w 2 x 2 + w 3 x 3 + … … + w n x n + b ) \frac{1}{1 + e^{-(w_1x_1 + w_2x_2 + w_3x_3 + …… + w_nx_n + b)}} 1+e−(w1x1+w2x2+w3x3+……+wnxn+b)1
损失函数
线性回归:(y_predict - y_true)平方和/总数
但逻辑回归的真实值/预测值:是否属于某个类别
对数似然损失
cost ( h θ ( x ) , y ) = { − log ( h θ ( x ) ) if y = 1 − log ( 1 − h θ ( x ) ) if y = 0 \operatorname{cost}\left(h_{\theta}(x), y\right)= \begin{cases}-\log \left(h_{\theta}(x)\right) & \text { if } \mathrm{y}=1 \\ -\log \left(1-h_{\theta}(x)\right) & \text { if } \mathrm{y}=0\end{cases} cost(hθ(x),y)={ −log(hθ(x))−log(1−hθ(x)) if y=1 if y=0


分情况讨论,对应的损失函数值:
当y=1时,我们希望h (x)值越⼤越好
当y=0时,我们希望h (x)值越⼩越好
综合完整损失函数
cost ( h θ ( x ) , y ) = ∑ i = 1 m − y i log ( h θ ( x ) ) − ( 1 − y i ) log ( 1 − h θ ( x ) ) \operatorname{cost}\left(h_{\theta}(x), y\right)=\sum_{i=1}^{m}-y_{i} \log \left(h_{\theta}(x)\right)-\left(1-y_{i}\right) \log \left(1-h_{\theta}(x)\right) cost(hθ(x),y)=i=1∑m−yilog(hθ(x))−(1−yi)log(1−hθ(x))
设置阈值为0.6

优化损失:梯度下降的方式
API
sklearn.linear_model.LogisticRegression(solver=‘liblinear’, penalty=‘l2’, C = 1.0)
- solver:优化求解方式(默认开源的liblinear库实现,内部使用了坐标轴下降法来迭代优化损失函数)
- sag:根据数据集自动选择,随机平均梯度下降
- penalty:正则化的种类
- C:正则化力度
默认将类别数量少的当做正例
注意: LogisticRegression方法相当于 SGDClassifier(loss=“log”, penalty=" ")
SGDClassifier实现了一个普通的随机梯度下降学习,也支持平均随机梯度下降法(ASGD),可以通过设置average=True。而使用LogisticRegression(实现了SAG)
4.4.4 案例:癌症分类预测-良/恶性乳腺癌肿瘤预测
默认将类别数量少的当做正例
恶性 - 正例
流程分析:
1)获取数据
读取的时候加上names
2)数据处理
处理缺失值
3)数据集划分
4)特征工程:
无量纲化处理-标准化
5)逻辑回归预估器
6)模型评估
真的患癌症的,能够被检查出来的概率 - 召回率
示例
import pandas as pd
import numpy as np
# 1.读取数据
path = "breast-cancer-wisconsin.data"
column_name = ['Sample code number', 'Clump Thickness', 'Uniformity of Cell Size', 'Uniformity of Cell Shape',
               'Marginal Adhesion', 'Single Epithelial Cell Size', 'Bare Nuclei', 'Bland Chromatin',
               'Normal Nucleoli', 'Mitoses', 'Class']
data = pd.read_csv(path, names=column_name)
data
| Sample code number | Clump Thickness | Uniformity of Cell Size | Uniformity of Cell Shape | Marginal Adhesion | Single Epithelial Cell Size | Bare Nuclei | Bland Chromatin | Normal Nucleoli | Mitoses | Class | |
|---|---|---|---|---|---|---|---|---|---|---|---|
| 0 | 1000025 | 5 | 1 | 1 | 1 | 2 | 1 | 3 | 1 | 1 | 2 |
| 1 | 1002945 | 5 | 4 | 4 | 5 | 7 | 10 | 3 | 2 | 1 | 2 |
| 2 | 1015425 | 3 | 1 | 1 | 1 | 2 | 2 | 3 | 1 | 1 | 2 |
| 3 | 1016277 | 6 | 8 | 8 | 1 | 3 | 4 | 3 | 7 | 1 | 2 |
| 4 | 1017023 | 4 | 1 | 1 | 3 | 2 | 1 | 3 | 1 | 1 | 2 |
| ... | ... | ... | ... | ... | ... | ... | ... | ... | ... | ... | ... |
| 694 | 776715 | 3 | 1 | 1 | 1 | 3 | 2 | 1 | 1 | 1 | 2 |
| 695 | 841769 | 2 | 1 | 1 | 1 | 2 | 1 | 1 | 1 | 1 | 2 |
| 696 | 888820 | 5 | 10 | 10 | 3 | 7 | 3 | 8 | 10 | 2 | 4 |
| 697 | 897471 | 4 | 8 | 6 | 4 | 3 | 4 | 10 | 6 | 1 | 4 |
| 698 | 897471 | 4 | 8 | 8 | 5 | 4 | 5 | 10 | 4 | 1 | 4 |
699 rows × 11 columns
# 2.缺失值处理
# 1)替换->np.nan
data = data.replace(to_replace="?", value=np.nan)
# 2)删除缺失样本
data.dropna(inplace=True)
data.isnull().any() # 不存在缺失值
Sample code number             False
Clump Thickness                False
Uniformity of Cell Size        False
Uniformity of Cell Shape       False
Marginal Adhesion              False
Single Epithelial Cell Size    False
Bare Nuclei                    False
Bland Chromatin                False
Normal Nucleoli                False
Mitoses                        False
Class                          False
dtype: bool
# 3.划分数据集
from sklearn.model_selection import train_test_split
data.head()
| Sample code number | Clump Thickness | Uniformity of Cell Size | Uniformity of Cell Shape | Marginal Adhesion | Single Epithelial Cell Size | Bare Nuclei | Bland Chromatin | Normal Nucleoli | Mitoses | Class | |
|---|---|---|---|---|---|---|---|---|---|---|---|
| 0 | 1000025 | 5 | 1 | 1 | 1 | 2 | 1 | 3 | 1 | 1 | 2 |
| 1 | 1002945 | 5 | 4 | 4 | 5 | 7 | 10 | 3 | 2 | 1 | 2 |
| 2 | 1015425 | 3 | 1 | 1 | 1 | 2 | 2 | 3 | 1 | 1 | 2 |
| 3 | 1016277 | 6 | 8 | 8 | 1 | 3 | 4 | 3 | 7 | 1 | 2 |
| 4 | 1017023 | 4 | 1 | 1 | 3 | 2 | 1 | 3 | 1 | 1 | 2 |
# 筛选特征值和目标值
x = data.iloc[:, 1:-1]
y = data["Class"]
x.head()
| Clump Thickness | Uniformity of Cell Size | Uniformity of Cell Shape | Marginal Adhesion | Single Epithelial Cell Size | Bare Nuclei | Bland Chromatin | Normal Nucleoli | Mitoses | |
|---|---|---|---|---|---|---|---|---|---|
| 0 | 5 | 1 | 1 | 1 | 2 | 1 | 3 | 1 | 1 |
| 1 | 5 | 4 | 4 | 5 | 7 | 10 | 3 | 2 | 1 |
| 2 | 3 | 1 | 1 | 1 | 2 | 2 | 3 | 1 | 1 |
| 3 | 6 | 8 | 8 | 1 | 3 | 4 | 3 | 7 | 1 |
| 4 | 4 | 1 | 1 | 3 | 2 | 1 | 3 | 1 | 1 |
y
0      2
1      2
2      2
3      2
4      2
      ..
694    2
695    2
696    4
697    4
698    4
Name: Class, Length: 683, dtype: int64
x_train, x_test, y_train, y_test = train_test_split(x, y)
x_train.head()
| Clump Thickness | Uniformity of Cell Size | Uniformity of Cell Shape | Marginal Adhesion | Single Epithelial Cell Size | Bare Nuclei | Bland Chromatin | Normal Nucleoli | Mitoses | |
|---|---|---|---|---|---|---|---|---|---|
| 532 | 1 | 1 | 1 | 1 | 1 | 1 | 3 | 1 | 1 |
| 469 | 1 | 1 | 2 | 1 | 2 | 1 | 2 | 1 | 1 |
| 301 | 1 | 1 | 1 | 1 | 2 | 1 | 3 | 1 | 1 |
| 143 | 1 | 1 | 1 | 1 | 2 | 5 | 1 | 1 | 1 |
| 265 | 5 | 1 | 4 | 1 | 2 | 1 | 3 | 2 | 1 |
# 4.标准化
from sklearn.preprocessing import StandardScaler
transfer = StandardScaler()
x_train = transfer.fit_transform(x_train)
x_test = transfer.transform(x_test)
x_train
array([[-1.23240478, -0.68322108, -0.72000745, ..., -0.1475997 ,
        -0.59521876, -0.33254996],
       [-1.23240478, -0.68322108, -0.37288521, ..., -0.56743885,
        -0.59521876, -0.33254996],
       [-1.23240478, -0.68322108, -0.72000745, ..., -0.1475997 ,
        -0.59521876, -0.33254996],
       ...,
       [-0.51168377, -0.68322108, -0.72000745, ..., -0.56743885,
        -0.59521876, -0.33254996],
       [-1.23240478, -0.68322108, -0.72000745, ..., -0.98727801,
        -0.59521876, -0.33254996],
       [ 0.20903725, -0.3513338 , -0.72000745, ..., -0.98727801,
        -0.59521876, -0.33254996]])
from sklearn.linear_model import LogisticRegression
# 5.预估器流程
estimator = LogisticRegression()
estimator.fit(x_train, y_train)
LogisticRegression()
# 逻辑回归的模型参数:回归系数和偏置
estimator.coef_
array([[1.45617183, 0.35742666, 1.01189168, 0.44139157, 0.14044299,
        1.13554588, 0.80854802, 0.64144112, 0.24517346]])
estimator.intercept_
array([-1.40471127])
# 6.模型评估
# 方法1:直接比对真实值和预测值
y_predict = estimator.predict(x_test)
print("y_predict:\n", y_predict)
print("比对真实值和预测值:\n", y_test == y_predict)

# 方法2:计算准确率
score = estimator.score(x_test, y_test)
print("准确率为:\n", score)
y_predict:
 [4 4 2 4 4 4 4 2 4 2 2 4 2 2 2 4 2 4 2 2 4 2 2 4 2 4 2 2 2 2 4 2 4 2 2 2 2
 4 4 4 4 2 2 2 2 2 2 2 4 2 4 2 4 4 4 4 4 2 2 2 4 4 2 2 4 2 2 2 2 2 4 2 2 2
 2 2 4 2 2 4 2 4 2 2 2 2 4 4 2 2 4 4 4 4 4 4 2 4 2 2 2 2 4 2 4 4 2 2 4 4 2
 4 2 2 4 4 2 2 2 2 4 2 2 2 4 4 2 2 2 2 2 4 4 4 4 2 4 2 2 2 2 2 4 2 2 2 4 2
 2 2 2 2 4 4 4 2 4 2 2 2 4 2 2 2 2 2 2 2 4 2 4]
比对真实值和预测值:
 201    True
124    True
682    True
221    True
200    True
       ...
168    True
639    True
440    True
364    True
284    True
Name: Class, Length: 171, dtype: bool
准确率为:
 0.9649122807017544
4.4.5 分类的评估方法
4.4.5.1 精确率与召回率
混淆矩阵
预测结果(Predicted Condition)与正确标记(True Condition)之间存在四种不同的组合,构成混淆矩阵(适用于多分类)
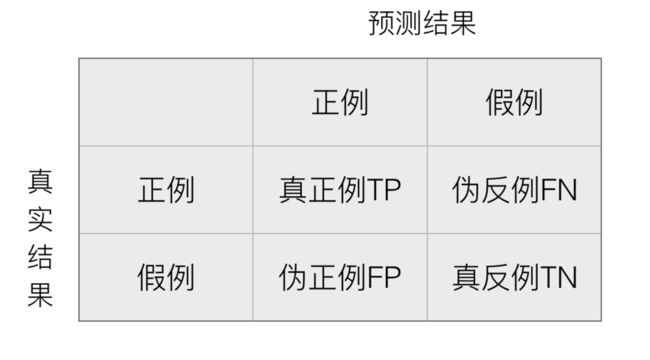
TP = True Possitive
FN = False Negative
精确率(Precision)与召回率(Recall)
例:工厂 质量检测 次品 召回率
4.4.5.2 F1-score
F1-score,精确率和召回率的调和平均数,最大为1,最小为0,反映了模型的稳健性
F 1 = 2 T P 2 T P + F N + F P = 2 ⋅ Precision ⋅ Recall Precision + Recall F 1=\frac{2 T P}{2 T P+F N+F P}=\frac{2 \cdot \text { Precision } \cdot \text { Recall }}{\text { Precision }+\text { Recall }} F1=2TP+FN+FP2TP= Precision + Recall 2⋅ Precision ⋅ Recall
API
klearn.metrics.classification_report(y_true, y_pred, labels=[], target_names=None )
分类评估报告
- y_true:真实目标值
- y_pred:估计器预测目标值
- labels:指定类别对应的数字
- target_names:目标类别名称
- return:每个类别精确率与召回率和F1-score
示例
查看精确率、召回率、F1-score
# 查看精确率、召回率、F1-score
from sklearn.metrics import classification_report
report = classification_report(y_test, y_predict, labels=[2, 4], target_names=["良性", "恶性"])
print(report)
              precision    recall  f1-score   support

          良性       0.97      0.97      0.97       104
          恶性       0.96      0.96      0.96        67

    accuracy                           0.96       171
   macro avg       0.96      0.96      0.96       171
weighted avg       0.96      0.96      0.96       171
但仍存在问题
例:
总共有100个人,如果99个样本癌症,1个样本非癌症 - 样本不均衡
不管怎样我全都预测正例(默认癌症为正例) - 不负责任的模型
此时:
准确率:99%
召回率:99/99 = 100%
精确率:99%
F1-score: 2*99%/ 199% = 99.497%
注意: 难以解决样本不均衡下的评估问题。样本不均衡时使用ROC曲线与AUC指标。
AUC:0.5
TPR = 100%
FPR = 1 / 1 = 100%
4.4.5.3 ROC曲线与AUC指标
TPR与FPR:
- TPR = TP / (TP + FN) - 召回率
所有真实类别为1的样本中,预测类别为1的比例 - FPR = FP / (FP + TN)
所有真实类别为0的样本中,预测类别为1的比例
ROC曲线的横轴就是FPRate,纵轴就是TPRate。
当二者相等时,表示的意义则是:对于不论真实类别是1还是0的样本,分类器预测为1的概率是相等的,此时AUC为0.5
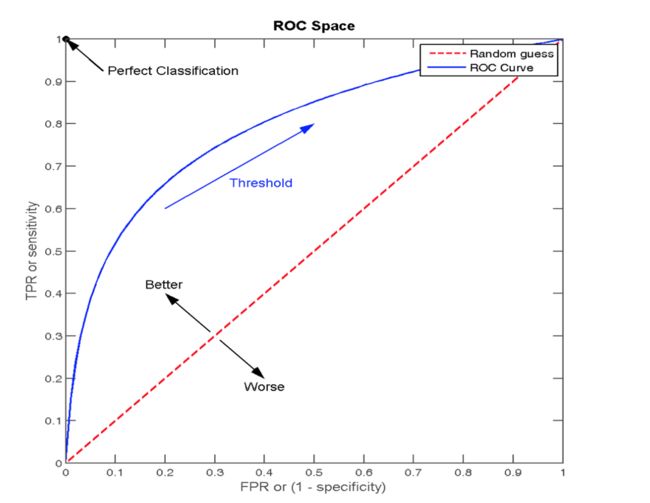
AUC的概率意义是随机取一对正负样本,正样本得分大于负样本的概率
AUC的最小值为0.5,最大值为1,取值越高越好
AUC=1,完美分类器,采用这个预测模型时,不管设定什么阈值都能得出完美预测。绝大多数预测的场合,不存在完美分类器。
0.5 最终AUC的范围在[0.5, 1]之间,并且越接近1越好 from sklearn.metrics import roc_auc_score AUC计算 注意: AUC只能用来评价二分类 import joblib 注意: 新版本的sklearn已经不包含jobliib.要使用的话直接import joblib 没有目标值 - 无监督学习 sklearn.cluster.KMeans(n_clusters=8,init=‘k-means++’) K - 超参数,可以调节超参数优化算法 k = 3 k-means对Instacart Market用户聚类(K=3) 10000 rows × 134 columns 轮廓系数 注: 对于每个点i 为已聚类数据中的样本 ,b_i 为i 到其它族群的所有样本的距离最小值,a_i 为i 到本身簇的距离平均值。最终计算出所有的样本点的轮廓系数平均值 分析过程(我们以一个蓝1点为例) 如果b_i>>a_i:趋近于1效果越好, 结论: sklearn.metrics.silhouette_score(X, labels) 模型评估-轮廓系数 特点分析:采用迭代式算法,直观易懂并且非常实用 缺点:容易收敛到局部最优解(多次聚类可以避免一下) 注意:聚类一般做在分类之前 应用场景:API
sklearn.metrics.roc_auc_score(y_true, y_score)
计算ROC曲线⾯积,即AUC值
y_true:每个样本的真实类别,必须为0(反例),1(正例)标记
y_score:预测得分,可以是正类的估计概率、置信值或者分类器⽅法的返回示例
# AUC计算
# y_true:每个样本的真实类别,必须为0(反例),1(正例)标记
# 将y_test转换为0 1
y_true = np.where(y_test >3, 1, 0)
y_predict_new = np.where(y_predict >3, 1, 0)
y_true
array([1, 1, 0, 1, 0, 1, 1, 0, 0, 0, 1, 0, 0, 0, 0, 1, 1, 0, 1, 0, 0, 1,
       0, 0, 0, 1, 1, 0, 0, 1, 0, 0, 0, 1, 0, 0, 1, 0, 1, 0, 0, 1, 0, 1,
       1, 0, 1, 1, 0, 0, 1, 1, 1, 0, 1, 0, 1, 0, 0, 1, 0, 1, 1, 0, 1, 0,
       1, 0, 0, 1, 0, 0, 0, 0, 1, 1, 1, 1, 1, 0, 1, 0, 1, 0, 0, 0, 1, 0,
       0, 0, 1, 1, 0, 0, 1, 0, 0, 0, 0, 1, 0, 1, 0, 0, 0, 1, 0, 0, 0, 1,
       1, 0, 0, 1, 0, 0, 0, 1, 1, 0, 1, 1, 0, 0, 1, 0, 1, 1, 0, 0, 0, 0,
       0, 0, 0, 1, 0, 1, 1, 0, 1, 1, 0, 1, 1, 0, 1, 0, 0, 0, 1, 0, 0, 0,
       1, 1, 0, 1, 0, 0, 1, 0, 1, 1, 1, 1, 0, 1, 0, 1, 0])
y_predict_new
array([1, 1, 0, 1, 0, 1, 1, 0, 0, 0, 1, 0, 0, 0, 0, 1, 1, 0, 1, 0, 0, 1,
       0, 0, 0, 1, 1, 0, 0, 1, 0, 0, 0, 0, 0, 0, 1, 1, 1, 0, 0, 1, 0, 1,
       1, 0, 1, 1, 0, 0, 0, 1, 1, 0, 1, 0, 1, 0, 0, 1, 0, 1, 1, 0, 1, 0,
       1, 0, 0, 1, 0, 0, 0, 0, 1, 1, 1, 1, 1, 0, 1, 0, 0, 0, 0, 0, 0, 0,
       0, 0, 1, 1, 0, 0, 1, 0, 0, 0, 0, 1, 0, 1, 0, 0, 0, 1, 0, 0, 0, 1,
       1, 0, 0, 0, 0, 0, 0, 1, 0, 0, 1, 1, 0, 0, 1, 0, 1, 1, 0, 0, 0, 0,
       0, 0, 0, 1, 0, 1, 1, 0, 1, 1, 0, 1, 1, 0, 1, 0, 0, 0, 1, 0, 0, 0,
       1, 1, 0, 1, 0, 0, 1, 0, 1, 1, 1, 1, 0, 1, 0, 1, 0])
from sklearn.metrics import roc_auc_score
roc_auc_score(y_true, y_predict)
0.9547916666666666
roc_auc_score(y_true, y_predict_new)
0.9547916666666666
y_true:必须为0(反例),1(正例)标记
y_score:此种应用场景,不需要化成0和1,结果一样AUC总结
AUC非常适合评价样本不平衡中的分类器性能4.5 模型保存和加载
API
示例
    # estimator = Ridge(alpha=0.5, max_iter=10000)
    # estimator.fit(x_train, y_train)
    # 保存模型
    joblib.dump(estimator, "../pkl/my_ridge.pkl")
    # 加载模型
    estimator = joblib.load("../pkl/my_ridge.pkl")
4.6 无监督学习-K-means算法
4.6.1 什么是无监督学习
4.6.2 无监督学习包含算法
4.6.3 K-means原理
4.6.4 K-means步骤
API
k-means聚类
4.6.5 案例:k-means对Instacart Market用户聚类
流程分析:
降维之后的数据
1)预估器流程
2)看结果
3)模型评估示例
# 1、获取数据
# 2、合并表
# 3、找到user_id和aisle之间的关系
# 4、PCA降维
import pandas as pd
# 1、获取数据
order_products = pd.read_csv("./instacart/order_products__prior.csv")
products = pd.read_csv("./instacart/products.csv")
orders = pd.read_csv("./instacart/orders.csv")
aisles = pd.read_csv("./instacart/aisles.csv")
# 2、合并表
# order_products__prior.csv:订单与商品信息

# 字段:order_id, product_id, add_to_cart_order, reordered
# products.csv:商品信息
# 字段:product_id, product_name, aisle_id, department_id
# orders.csv:用户的订单信息
# 字段:order_id,user_id,eval_set,order_number,….
# aisles.csv:商品所属具体物品类别
# 字段: aisle_id, aisle

# 1)合并aisles和products aisle和product_id
# 左表,右表,默认内连接,按"order_id"字段进行合并
tab1 = pd.merge(aisles, products, on=["aisle_id", "aisle_id"])
# 2)合并tab1和products on=product_id tab2:aisle_id
tab2 = pd.merge(tab1, order_products, on=["product_id", "product_id"])
# 3)合并tab2和aisles on=aisle_id tab3:user_id, aisle
tab3 = pd.merge(tab2, orders, on=["order_id", "order_id"])  # 总的大表
tab3.head()
aisle_id
aisle
product_id
product_name
department_id
order_id
add_to_cart_order
reordered
user_id
eval_set
order_number
order_dow
order_hour_of_day
days_since_prior_order
0
1
prepared soups salads
209
Italian Pasta Salad
20
94246
5
0
114082
prior
26
0
20
1.0
1
1
prepared soups salads
22853
Pesto Pasta Salad
20
94246
4
0
114082
prior
26
0
20
1.0
2
4
instant foods
12087
Chicken Flavor Ramen Noodle Soup
9
94246
15
0
114082
prior
26
0
20
1.0
3
4
instant foods
47570
Original Flavor Macaroni & Cheese Dinner
9
94246
14
1
114082
prior
26
0
20
1.0
4
13
prepared meals
10089
Dolmas
20
94246
25
0
114082
prior
26
0
20
1.0
# 3、找到user_id和aisle之间的关系
# 交叉表处理,把user_id和aisle进行分组
table = pd.crosstab(tab3["user_id"], tab3["aisle"])  # 将大表分组
data = table[:10000] # 表太大,取前10000项进行分析
data
aisle
air fresheners candles
asian foods
baby accessories
baby bath body care
baby food formula
bakery desserts
baking ingredients
baking supplies decor
beauty
beers coolers
...
spreads
tea
tofu meat alternatives
tortillas flat bread
trail mix snack mix
trash bags liners
vitamins supplements
water seltzer sparkling water
white wines
yogurt
user_id
1
0
0
0
0
0
0
0
0
0
0
...
1
0
0
0
0
0
0
0
0
1
2
0
3
0
0
0
0
2
0
0
0
...
3
1
1
0
0
0
0
2
0
42
3
0
0
0
0
0
0
0
0
0
0
...
4
1
0
0
0
0
0
2
0
0
4
0
0
0
0
0
0
0
0
0
0
...
0
0
0
1
0
0
0
1
0
0
5
0
2
0
0
0
0
0
0
0
0
...
0
0
0
0
0
0
0
0
0
3
...
...
...
...
...
...
...
...
...
...
...
...
...
...
...
...
...
...
...
...
...
...
9996
3
0
0
0
0
0
1
0
0
0
...
2
0
0
1
0
0
0
0
2
1
9997
0
0
0
0
0
0
2
0
0
0
...
0
0
0
0
0
0
0
0
0
8
9998
0
0
0
0
0
0
0
0
0
0
...
0
0
0
0
0
0
0
0
0
0
9999
0
0
0
0
0
0
0
0
0
0
...
1
0
0
0
0
0
0
0
0
0
10000
0
2
0
0
0
0
10
1
0
0
...
42
4
14
11
0
1
6
23
0
45
# 4、4、主成分分析(PCA)降维
from sklearn.decomposition import PCA
# 1)实例化一个转换器类
transfer = PCA(n_components=0.95)  # 减少至0.95的特征

# 2)调用fit_transform
data_new = transfer.fit_transform(data)
data_new.shape # 较之前134个特征,明显减少了很多
(10000, 42)
data_new
array([[-2.36456828e+01,  2.30028678e+00, -2.71706275e+00, ...,
         8.24685231e-01, -5.20365905e-01,  2.99847178e+00],
       [ 6.95477119e+00,  3.54966052e+01,  2.52655545e+00, ...,
        -1.15326520e+00, -1.37969318e+00, -1.07115466e-02],
       [-7.47792843e+00,  2.83147785e+00, -1.07306519e+01, ...,
        -3.55104796e-01,  3.85595697e-02,  1.92318882e+00],
       ...,
       [-2.86664024e+01, -1.26446961e+00, -1.14908062e+00, ...,
         1.13859569e-03,  4.14189764e-01,  4.46163585e-01],
       [-2.88378748e+01, -1.70490822e+00, -1.47059942e+00, ...,
        -1.62743887e-01,  6.72795951e-01,  9.64403654e-02],
       [ 2.10412407e+02, -3.51935647e+01,  1.33671987e+01, ...,
         1.46544596e+01,  1.56764794e+01,  1.67432890e+01]])
#预估器流程
from sklearn.cluster import KMeans
estimator = KMeans(n_clusters=3)
estimator.fit(data_new)
KMeans(n_clusters=3)
y_predict = estimator.predict(data_new)
y_predict[:300] # 查看前300个样本是属于哪个类别的
array([1, 1, 1, 1, 1, 1, 1, 1, 1, 1, 1, 1, 1, 1, 1, 1, 1, 1, 1, 1, 1, 1,
       1, 1, 1, 1, 0, 1, 1, 1, 1, 1, 1, 1, 0, 1, 0, 1, 1, 1, 1, 1, 1, 1,
       1, 1, 1, 1, 1, 0, 1, 1, 1, 0, 1, 1, 1, 1, 1, 1, 1, 1, 0, 1, 1, 1,
       1, 1, 1, 1, 0, 1, 1, 1, 0, 1, 1, 1, 1, 1, 1, 1, 1, 1, 1, 0, 1, 1,
       0, 1, 1, 1, 1, 1, 1, 1, 1, 1, 0, 1, 1, 1, 1, 1, 1, 1, 1, 1, 1, 0,
       1, 1, 1, 1, 1, 1, 1, 0, 1, 1, 1, 1, 1, 1, 1, 1, 1, 1, 1, 1, 1, 1,
       0, 1, 1, 1, 1, 1, 1, 2, 1, 0, 1, 1, 1, 0, 1, 1, 1, 1, 1, 0, 0, 0,
       0, 1, 1, 1, 1, 1, 0, 1, 1, 1, 1, 1, 1, 1, 1, 1, 1, 1, 0, 1, 1, 1,
       1, 1, 1, 0, 1, 1, 1, 1, 1, 1, 1, 1, 1, 1, 1, 1, 1, 1, 1, 1, 0, 1,
       1, 1, 1, 0, 1, 0, 1, 1, 1, 1, 1, 2, 1, 1, 1, 2, 1, 1, 1, 1, 0, 1,
       0, 1, 2, 1, 1, 1, 0, 1, 1, 1, 1, 2, 0, 0, 1, 0, 1, 1, 1, 1, 1, 1,
       0, 1, 1, 1, 1, 0, 1, 1, 1, 1, 1, 1, 1, 1, 1, 1, 1, 1, 1, 0, 1, 2,
       1, 1, 1, 1, 1, 1, 1, 1, 1, 1, 1, 1, 1, 0, 1, 0, 0, 1, 1, 0, 1, 1,
       1, 1, 2, 0, 1, 1, 1, 1, 0, 1, 1, 1, 1, 0])
4.6.6 Kmeans性能评估指标
s c i = b i − a i m a x ( b i , a i ) sc_i = \frac{b_i-a_i}{max(b_i,a_i)} sci=max(bi,ai)bi−ai
b_i<
轮廓系数的值是介于 [-1,1] ,
越趋近于1代表内聚度和分离度都相对较优。API
计算所有样本的平均轮廓系数
示例
# 模型评估-轮廓系数
from sklearn.metrics import silhouette_score
silhouette_score(X=data_new,labels=y_predict)
0.5396819903993839
4.6.7 K-means总结
没有目标值
分类回归和聚类总结


