【机器学习】Logistic回归详解(含源码)
作者:大拨鼠
注:本文相关练习用jupyter notebook完成,源文件可到公众号"大拨鼠Code"回复“机器学习”领取,题目及数据、文章的pdf版本都已打包在一起,如果对您有帮助,希望点个关注哦,万分感谢!
专栏持续更新中,欢迎订阅~
Linux
数据结构与算法
机器学习
Logistic回归
文章目录
-
- Logistic回归
-
- 逻辑函数
- 决策边界
- 代价函数
- 梯度下降求解
- 多元分类(一对多)
- 过拟合及解决
-
- 线性回归的正规化
- Logistic回归的正规化
- 例题源码
-
- 线性分类问题
-
- 偏导
- 建立分类器
- 决策边界
- 非线性分类问题
-
- 特征映射
- 正规化代价函数
- 正则化梯度
- 决策边界
logistic回归是一种广义线性回归(generalized linear model),因此与多重线性回归分析有很多相同之处。
逻辑函数
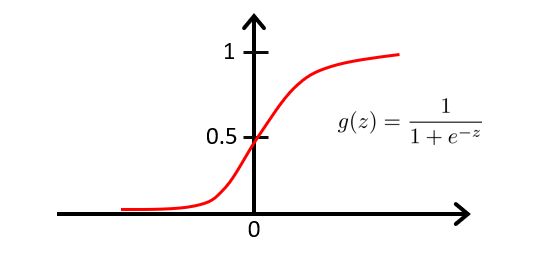
我们将逻辑函数(sigmoid函数)定义为:
g ( z ) = 1 1 + e − z g(z)=\frac{1}{1+e^{-z}} g(z)=1+e−z1
由于 z = θ T x z=\theta^Tx z=θTx也可以写为:
h θ ( x ) = 1 1 + e − θ T x h_{\theta}(x)=\frac{1}{1+e^{-\theta^{T}x}} hθ(x)=1+e−θTx1
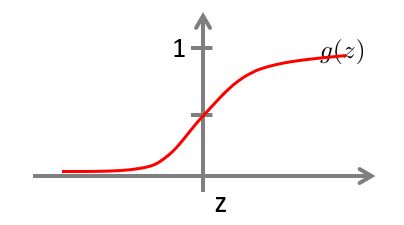
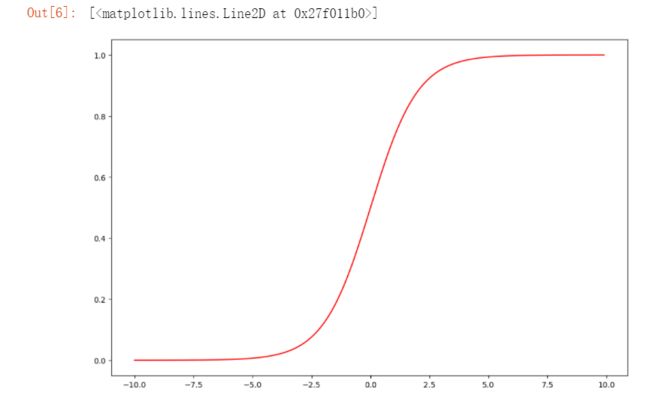
逻辑函数的图像如下:
当有了 h θ ( x ) = 1 1 + e − θ T x h_{\theta}(x)=\frac{1}{1+e^{-\theta^{T}x}} hθ(x)=1+e−θTx1这个函数后,我们要做的和前面线性回归时一样,就是用参数 θ \theta θ去拟合我们的数据。
由于逻辑函数处于 0 − 1 0-1 0−1之间,且预测结果只输出1或者0,所以当 h θ ( x ) h_{\theta}(x) hθ(x)为某个值时,这个值,代表的就是预测为1的概率,即当 h θ ( x ) = 0.7 h_{\theta}(x)=0.7 hθ(x)=0.7时,以下为 y = 1 y=1 y=1和 y = 0 y=0 y=0的概率。
P ( y = 1 ∣ x , θ ) = 0.7 P(y=1|x,\theta)=0.7 P(y=1∣x,θ)=0.7
P ( y = 0 ∣ x , θ ) = 1 − P ( y = 1 ∣ x , θ ) = 0.3 P(y=0|x,\theta)=1-P(y=1|x,\theta)=0.3 P(y=0∣x,θ)=1−P(y=1∣x,θ)=0.3
决策边界
我们现在来看看,逻辑函数什么时候会将 y y y预测为1,什么时候会预测为0
这时我们可以设定一个界限,例如我们设为0.5,则
h θ ( x ) ≥ 0.5 , y = 1 h_{\theta}(x)≥0.5,y=1 hθ(x)≥0.5,y=1
h θ ( x ) < 0.5 , y = 0 h_{\theta}(x)<0.5,y=0 hθ(x)<0.5,y=0
同时,又逻辑函数的图像可知:
当 z ≥ 0 时 , h θ ( x ) ≥ 0.5 当z≥0时,h_{\theta}(x)≥0.5 当z≥0时,hθ(x)≥0.5
当 z < 0 时 , h θ ( x ) < 0.5 当z<0时,h_{\theta}(x)<0.5 当z<0时,hθ(x)<0.5
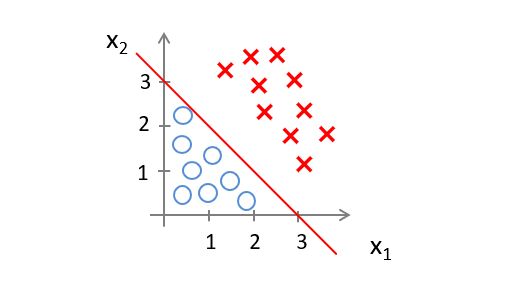
现在假设我们有如下图所示的训练集和假设函数
现在令 θ 0 = − 3 , θ 1 = 1 , θ 2 = 1 \theta_0=-3,\theta_1=1,\theta_2=1 θ0=−3,θ1=1,θ2=1
则若是 − 3 + x 1 + x 2 ≥ 0 -3+x_1+x_2≥0 −3+x1+x2≥0,则预测 y = 1 y=1 y=1
我们知道, − 3 + x 1 + x 2 ≥ 0 -3+x_1+x_2≥0 −3+x1+x2≥0在图上表示的区域可以用提条直线划分
则当数据落在直线右边区域时,预测 y = 1 y=1 y=1,落在左边则预测 y = 0 y=0 y=0.
我们称这条线为决策边界,当 θ \theta θ的值确定,我们的决策边界也随之确定。
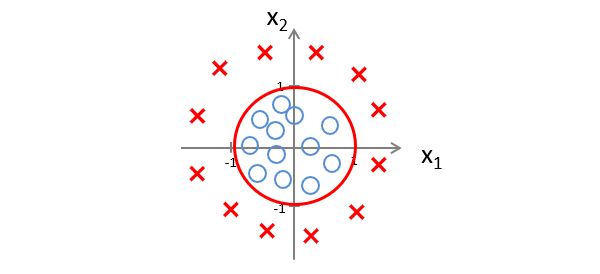
下面再看个例子
现在令 θ 0 = − 1 , θ 1 = 0 , θ 2 = 0 , θ 3 = 1 , θ 4 = 1 \theta_0=-1,\theta_1=0,\theta_2=0,\theta_3=1,\theta_4=1 θ0=−1,θ1=0,θ2=0,θ3=1,θ4=1
则若是 − 1 + x 1 2 + x 2 2 ≥ 0 -1+x_1^2+x_2^2≥0 −1+x12+x22≥0,则预测 y = 1 y=1 y=1
此时的决策边界就是一个以0为原点,以1为半径的圆,但数据落在圆外,则预测 y = 1 y=1 y=1
这里要在强调一下,我们不是用训练集去定义决策边界,而是用来拟合参数 θ \theta θ,当 θ \theta θ的值确定时,决策边界也就确定了。
代价函数
假设我们现在有n个特征值和m个训练样本的训练集
像之前线性回归一样,我们令 x 0 = 1 x_0=1 x0=1
我们假设函数:
h θ ( x ) = 1 1 + e − θ T x h_{\theta}(x)=\frac{1}{1+e^{-\theta^{T}x}} hθ(x)=1+e−θTx1
现在我们要讨论的是,当给定训练集时,该如何去拟合函数 θ \theta θ.
在线性回归中,我们用了代价函数 J ( θ ) = 1 m ∑ i = 1 m 1 2 ( h θ ( x ( i ) ) − y ( i ) ) 2 J(\theta)=\frac{1}{m}\sum^m_{i=1}\frac{1}{2}(h_{\theta}(x^{(i)})-y^{(i)})^2 J(θ)=m1∑i=1m21(hθ(x(i))−y(i))2
令 C o s t ( h θ ( x ( i ) ) , y ( i ) ) = 1 2 ( h θ ( x ( i ) ) − y ( i ) ) 2 Cost(h_{\theta}(x^{(i)}),y^{(i)})=\frac{1}{2}(h_{\theta}(x^{(i)})-y^{(i)})^2 Cost(hθ(x(i)),y(i))=21(hθ(x(i))−y(i))2
原式就变成了 J ( θ ) = 1 m ∑ i = 1 m C o s t ( h θ ( x ( i ) ) , y ( i ) ) J(\theta)=\frac{1}{m}\sum^m_{i=1}Cost(h_{\theta}(x^{(i)}),y^{(i)}) J(θ)=m1∑i=1mCost(hθ(x(i)),y(i))
对于逻辑函数 h θ ( x ) = 1 1 + e − θ T x h_{\theta}(x)=\frac{1}{1+e^{-\theta^{T}x}} hθ(x)=1+e−θTx1是一个比较复杂的函数,
那么它的代价函数是一个非凸函数,图像如下左图,有很多局部最优解,那么我们就不能确保用梯度下降法可以找到全局最优解,所以我们更希望代价函数如下右图
为了解决上面的问题,我们定义 C o s t Cost Cost函数如下
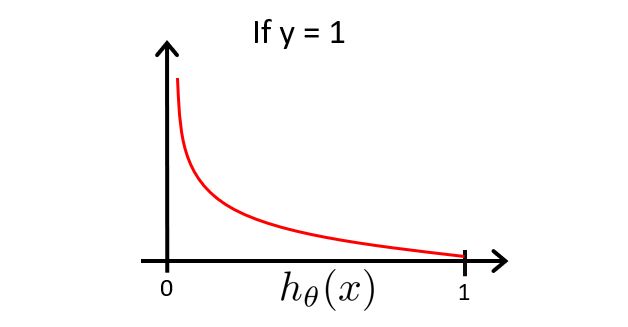
我们先来讨论 y = 1 y=1 y=1的情况
C o s t Cost Cost函数的图像为
由于该图像是在 y = 1 y=1 y=1的基础上绘制的,即 c o s t cost cost是越接近于0,则 y = 1 y=1 y=1的概率越大
由此我们知道,若 h θ ( x ) = 1 , 则 c o s t = 0 h_{\theta}(x)=1,则cost=0 hθ(x)=1,则cost=0,也就意味着 y = 1 y=1 y=1的概率为1,若 h θ ( x ) − > 0 , 则 c o s t − > ∞ h_{\theta}(x)->0,则cost->∞ hθ(x)−>0,则cost−>∞,也就意味着 y = 1 y=1 y=1的概率为0。
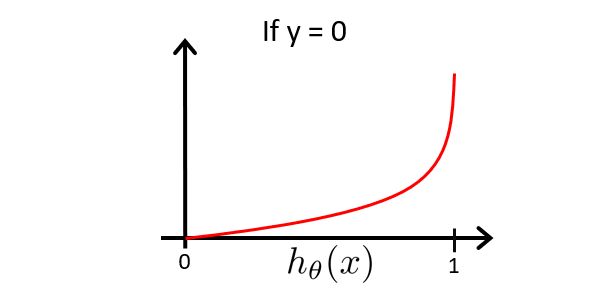
现在讨论 y = 0 y=0 y=0的情况
C o s t Cost Cost函数的图像为
由于该图像是在 y = 0 y=0 y=0的基础上绘制的,即 c o s t cost cost是越接近于0,则 y = y= y=的0概率越大
由此我们知道,若 h θ ( x ) = 0 , 则 c o s t = 0 h_{\theta}(x)=0,则cost=0 hθ(x)=0,则cost=0,也就意味着 y = 1 y=1 y=1的概率为0,若 h θ ( x ) − > 1 , 则 c o s t − > ∞ h_{\theta}(x)->1,则cost->∞ hθ(x)−>1,则cost−>∞,也就意味着 y = 0 y= 0 y=0的概率为0。
梯度下降求解
如下是我们的逻辑函数,在分类问题中, y y y的值总是等于0或1。
既然 y y y值总是等于0或1,那么我们可以尝试简化代价函数,将两个表达式合二为一,这更方便我们使用梯度下降。
由于当 y = 1 时 , C o s t ( h θ ( x ) , y ) = − l o g ( h θ ( x ) ) y=1时,Cost(h_{\theta}(x),y)=-log(h_{\theta}(x)) y=1时,Cost(hθ(x),y)=−log(hθ(x))
由于当 y = 0 时 , C o s t ( h θ ( x ) , y ) = − l o g ( 1 − h θ ( x ) ) y=0时,Cost(h_{\theta}(x),y)=-log(1-h_{\theta}(x)) y=0时,Cost(hθ(x),y)=−log(1−hθ(x))
故我们可以合并成
C o s t ( h θ ( x ) , y ) = − y l o g ( h θ ( x ) ) − ( 1 − y ) l o g ( 1 − h θ ( x ) ) Cost(h_{\theta}(x),y)=-ylog(h_{\theta}(x))-(1-y)log(1-h_{\theta}(x)) Cost(hθ(x),y)=−ylog(hθ(x))−(1−y)log(1−hθ(x))
这样我们就得到了Logistic 回归的代价函数如下
现在我们要做的就是找出让代价函数取得最小值的参数 θ \theta θ
和线性回归类似,我们利用梯度下降法,直到找到最小值
算出导数项 ∂ ∂ θ j J ( θ ) \frac{∂}{∂\theta_j}J(\theta) ∂θj∂J(θ),则
θ j : = θ j − α 1 m ∑ i = 1 m ( h θ ( x ( i ) ) − y ( i ) ) x j ( i ) \theta_j:=\theta_j-\alpha\frac{1}{m}\sum^m_{i=1}(h_{\theta}(x^{(i)})-y^{(i)})x^{(i)}_j θj:=θj−αm1i=1∑m(hθ(x(i))−y(i))xj(i)
多元分类(一对多)
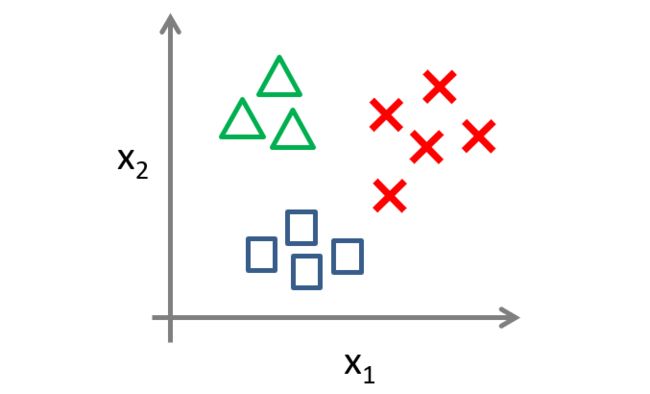
对于上图有三个类别的样本,我们应该如何进行分类?
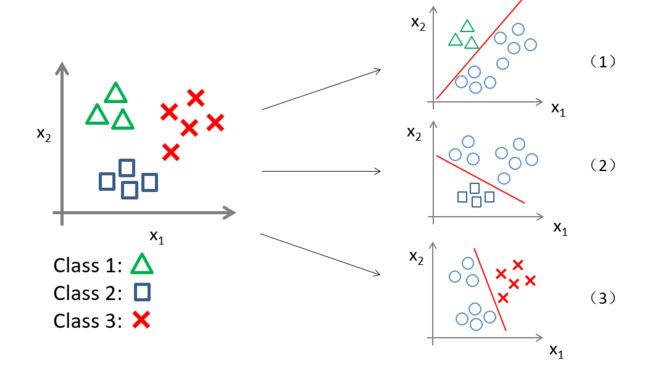
我们可以将这个多元分类转化为三个独立的二元分类问题。
先将三个类别分别假设为 y = 1 , y = 2 , y = 3 y=1,y=2,y=3 y=1,y=2,y=3
如图(1)我们先把正方形和红叉看成一类,从而转化为二元分类,那么第一个分类器就可以预测出 y = 1 y=1 y=1的概率,同理,图(2)和图(3)分别能预测出 y = 2 , y = 3 y=2,y=3 y=2,y=3的概率。
也就是说,在分析三元问题时,我们转化为三个二元分类器,每个分类器都针对其中一种情况进行训练。
过拟合及解决
一个假设在训练数据上能够获得比其他假设更好的拟合, 但是在训练数据外的数据集上却不能很好地拟合数据,此时认为这个假设出现了过拟合的现象。出现这种现象的主要原因是训练数据中存在噪音或者训练数据太少。
在一元线性回归问题中,我们可以选择在图上观察数据的分布特征从而选择合适的拟合函数,但在多元回归分析中,很难作图并观察数据分布特征。
解决方法:
- 通过人工或选择算法模型来舍弃一部分特征向量。
- 正规化:保留所有特征,但减小拟合参数 θ \theta θ,这种方法在我们有很多特征值且特征值都不能舍弃的情况下非常适用。
现在我们来修改一下代价函数,来实现减小参数 θ \theta θ.
λ \lambda λ称为正规化参数,用于控制两个目标之间的取舍
第一个目标就是使拟合参数更好地拟合我们的数据
第二个目标就是使拟合参数尽量小
线性回归的正规化
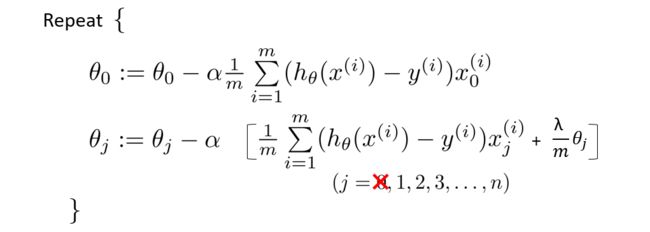
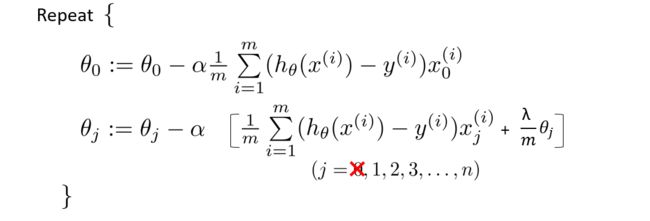
一般来说,我们只要对参数 θ 1 , . . . , θ n \theta_1,...,\theta_n θ1,...,θn做正规化,因此进行梯度下降时, θ 0 \theta_0 θ0要单独拿出来进行更新。
将更新 θ j \theta_j θj的项再转换一下,变为如下:
若使用正规方程,则变为
Logistic回归的正规化
例题源码
import numpy as np
import pandas as pd
import matplotlib.pyplot as plt
from sklearn.metrics import classification_report #生成报告
线性分类问题
#数据处理
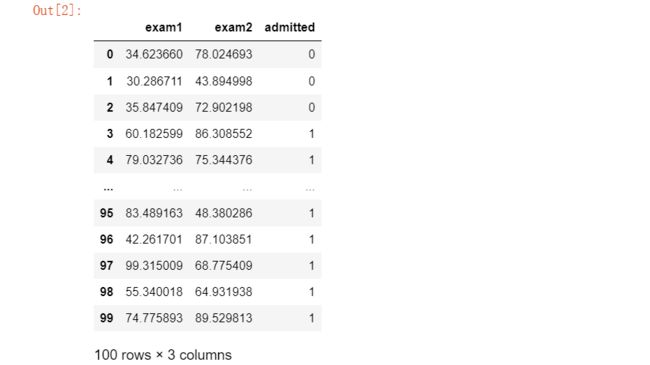
data=pd.read_csv('E:\\happy\\data\\Logistic_data\\ex2data1.txt',names=['exam1','exam2','admitted'])
data
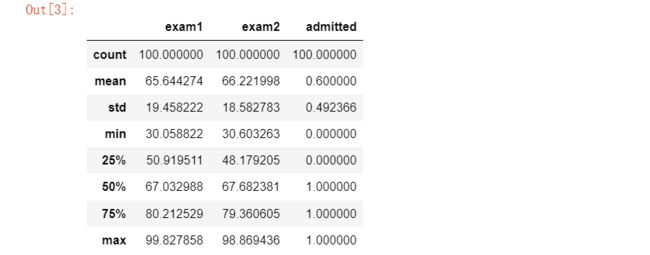
#先看看数据各个统计值
data.describe()
#绘制散点
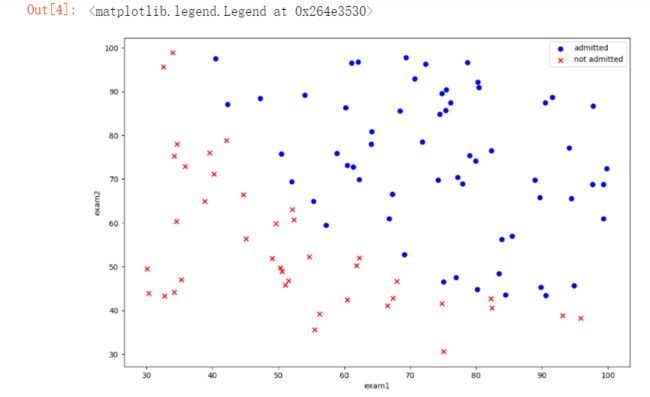
positive = data[data['admitted'].isin([1])]
negative = data[data['admitted'].isin([0])]

fig = plt.figure(figsize=(12,8), dpi=100)
plt.scatter(positive.exam1,positive.exam2,c='b',marker='o',label='admitted')
plt.scatter(negative.exam1,negative.exam2,c='r',marker='x',label='not admitted')
plt.xlabel("exam1")
plt.ylabel("exam2")
plt.legend()
#sigmoid函数
def sigmoid(z):
    return 1/(1 + np.exp(-z))
#绘图检查一下sigmoid函数定义是否正确
nums = np.arange(-10,10,step=0.1)

fig = plt.figure(figsize=(12,8), dpi=100)
plt.plot(nums, sigmoid(nums),'r')
J ( θ ) = 1 m ∑ i = 1 m [ − y ( i ) log ( h θ ( x ( i ) ) ) − ( 1 − y ( i ) ) log ( 1 − h θ ( x ( i ) ) ) ] J\left( \theta \right)=\frac{1}{m}\sum\limits_{i=1}^{m}{[-{{y}^{(i)}}\log \left( {{h}_{\theta }}\left( {{x}^{(i)}} \right) \right)-\left( 1-{{y}^{(i)}} \right)\log \left( 1-{{h}_{\theta }}\left( {{x}^{(i)}} \right) \right)]} J(θ)=m1i=1∑m[−y(i)log(hθ(x(i)))−(1−y(i))log(1−hθ(x(i)))]
#添加一列1
data.insert(0,'Ones',1)

#读取特征值和目标函数
cols = data.shape[1]  #得到矩阵列数
x_data = np.array(data.iloc[:, 0:cols-1])  #取不包含最后一列的所有数据,并转化为数组,不然不能进行下面的运算
y_data = np.array(data.iloc[:,cols-1:cols])     #取最后一列数据
theta = np.zeros(3)
def cost(theta,X,y):
    theta = np.matrix(theta)
    X = np.matrix(X)
    y = np.matrix(y)
    return np.mean(np.multiply(-y, np.log(sigmoid(X * theta.T))) - np.multiply((1 - y), 	np.log(1 - sigmoid(X * theta.T))))
偏导
∂ J ( θ ) ∂ θ j = 1 m ∑ i = 1 m ( h θ ( x ( i ) ) − y ( i ) ) x j ( i ) \frac{\partial J\left( \theta \right)}{\partial {{\theta }_{j}}}=\frac{1}{m}\sum\limits_{i=1}^{m}{({{h}_{\theta }}\left( {{x}^{(i)}} \right)-{{y}^{(i)}})x_{_{j}}^{(i)}} ∂θj∂J(θ)=m1i=1∑m(hθ(x(i))−y(i))xj(i)
转化为向量
1 m X T ( s i g m o i d ( X θ T ) − y ) \frac{1}{m} X^T( sigmoid(X\theta^T) - y ) m1XT(sigmoid(XθT)−y)
#求代价函数偏导
def gradient(theta, X, y):
    theta = np.matrix(theta)
    X = np.matrix(X)
    y = np.matrix(y)
    return  X.T * (sigmoid(X * theta.T) - y) / len(X)
#看看能否运行
gradient(theta ,x_data ,y_data)
现在用SciPy’s truncated newton(TNC)实现寻找最优参数。
import scipy.optimize as opt
res = opt.fmin_tnc(func=cost, x0=theta, fprime=gradient, args=(x_data, y_data))
res
![]()
cost(res[0], x_data, y_data)
![]()
建立分类器
当 h θ {{h}_{\theta }} hθ小于0.5时,预测 y=0 。
def predict(theta , X):
    theta = np.matrix(theta)
    X = np.matrix(X)
    prob = sigmoid(X * theta.T)
    return (prob >= 0.5).astype(int)
#预测一下,看看精确率
final_theta = res[0];
y_pred = predict(final_theta , x_data)
#生成报告
print(classification_report(y_data,y_pred))
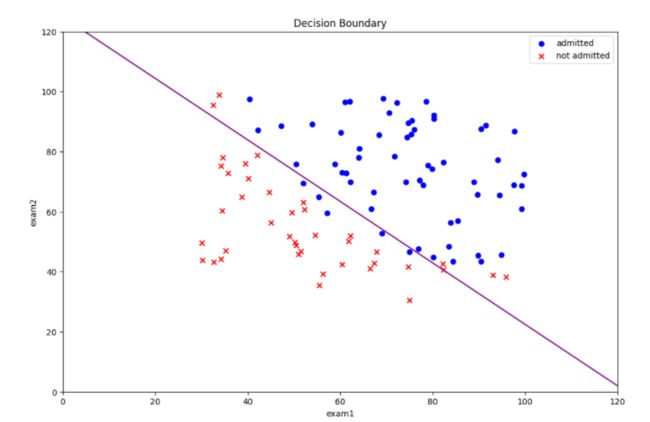
决策边界
coef = -(res[0] / res[0][2])   #决策边界方程系数
x = np.arange(130 ,step=0.1)
y = coef[1] * x + coef[0]
#画出决策边界
fig = plt.figure(figsize=(12,8), dpi=100)
plt.plot(x, y,'purple')
plt.scatter(positive.exam1,positive.exam2,c='b',marker='o',label='admitted')
plt.scatter(negative.exam1,negative.exam2,c='r',marker='x',label='not admitted')
plt.xlim(0,120)
plt.ylim(0,120)
plt.xlabel("exam1")
plt.ylabel("exam2")
plt.legend()
plt.title('Decision Boundary')
非线性分类问题
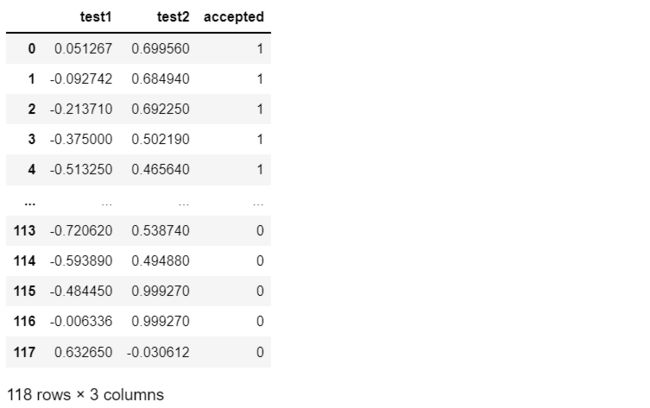
data2 = pd.read_csv('E:\\happy\\data\\Logistic_data\\ex2data2.txt',names=['test1', 'test2','accepted'])
data2
#绘制散点图
positive2 = data2[data2['accepted'].isin([1])]
negative2 = data2[data2['accepted'].isin([0])]

fig = plt.figure(figsize=(12,8), dpi=100)
plt.scatter(positive2['test1'], positive2['test2'], c='b',marker='o',label='accepted')
plt.scatter(negative2['test1'], negative2['test2'], c='r',marker='x',label='rejected')
plt.legend()
plt.xlabel('test1')
plt.ylabel('test2')
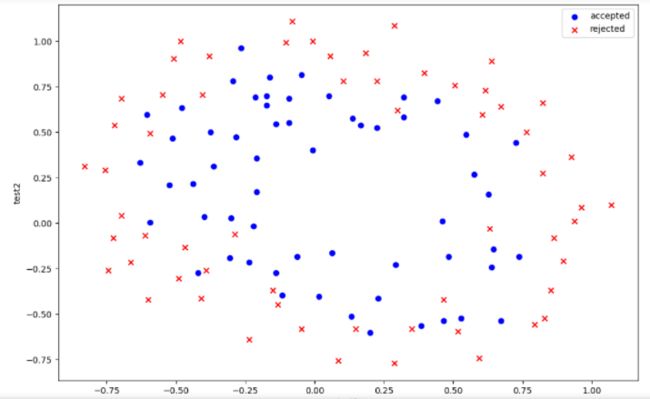
这些数据散点看起来是非线性的,不能简单地区分正负类,因此我们需要创建更多的项来使决策边界更好地对数据实现分类,这就需要用到特征映射,但这容易出现过拟合问题,因此我们还需要进行正规化代价函数.
特征映射
def feature_mapping(x, y, power, as_ndarray=False):
    data = {"f{}{}".format(i - p, p): np.power(x, i - p) * np.power(y, p)
                for i in np.arange(power + 1)
                for p in np.arange(i + 1)
            }

    if as_ndarray:
        return pd.DataFrame(data).values
    else:
        return pd.DataFrame(data)
x1 = np.array(data2.test1)
x2 = np.array(data2.test2)
正规化代价函数
J ( θ ) = 1 m ∑ i = 1 m [ − y ( i ) log ( h θ ( x ( i ) ) ) − ( 1 − y ( i ) ) log ( 1 − h θ ( x ( i ) ) ) ] + λ 2 m ∑ j = 1 n θ j 2 J\left( \theta \right)=\frac{1}{m}\sum\limits_{i=1}^{m}{[-{{y}^{(i)}}\log \left( {{h}_{\theta }}\left( {{x}^{(i)}} \right) \right)-\left( 1-{{y}^{(i)}} \right)\log \left( 1-{{h}_{\theta }}\left( {{x}^{(i)}} \right) \right)]}+\frac{\lambda }{2m}\sum\limits_{j=1}^{n}{\theta _{j}^{2}} J(θ)=m1i=1∑m[−y(i)log(hθ(x(i)))−(1−y(i))log(1−hθ(x(i)))]+2mλj=1∑nθj2
X = feature_mapping(x1, x2, power=6, as_ndarray=True)
cols = data2.shape[1]
y = np.array(data2.iloc[:,cols-1:cols])
theta = np.zeros(28)
def regularized_cost(theta, X, y, lamb = 1):
    '''正规项不包含theta_0'''
    theta_except_0 = theta[1:]
    reg = (lamb / (2 * len(X))) * np.sum(np.power(theta_except_0, 2))
    return cost(theta,X,y) + reg
正则化梯度
θ 0 : = θ 0 − a 1 m ∑ i = 1 m [ h θ ( x ( i ) ) − y ( i ) ] x 0 ( i ) {{\theta }_{0}}:={{\theta }_{0}}-a\frac{1}{m}\sum\limits_{i=1}^{m}{[{{h}_{\theta }}\left( {{x}^{(i)}} \right)-{{y}^{(i)}}]x_{_{0}}^{(i)}} θ0:=θ0−am1i=1∑m[hθ(x(i))−y(i)]x0(i)
θ j : = θ j − a 1 m ∑ i = 1 m [ h θ ( x ( i ) ) − y ( i ) ] x j ( i ) + λ m θ j {{\theta }_{j}}:={{\theta }_{j}}-a\frac{1}{m}\sum\limits_{i=1}^{m}{[{{h}_{\theta }}\left( {{x}^{(i)}} \right)-{{y}^{(i)}}]x_{j}^{(i)}}+\frac{\lambda }{m}{{\theta }_{j}} θj:=θj−am1i=1∑m[hθ(x(i))−y(i)]xj(i)+mλθj
def regularized_gradient(theta, X, y, lam=1):
    theta_except_0 = theta[1:]
    reg_theta = (lam / len(X)) * theta_except_0
    #将theta_0和theta_j(j≠0)两种情况拼接到一个数组中
    reg_term = np.concatenate([np.array([0]), reg_theta])
    reg_term = np.matrix(reg_term)
    return gradient(theta, X, y) + reg_term.T
regularized_gradient(theta, X, y, lam=1)
现在用SciPy’s truncated newton(TNC)实现寻找最优参数。
res2 = opt.fmin_tnc(func=regularized_cost, x0=theta, fprime=regularized_gradient, args=(X, y))
res2
#看看精确度
final_theta = res2[0]
y_pred = predict(final_theta, X)
print(classification_report(y, y_pred))
决策边界
#寻找决策边界
def find_decision_boundary(power, theta):
    t1 = np.linspace(-1, 1.5, 1000)
    t2 = np.linspace(-1, 1.5, 1000)

    cordinates = [(x, y) for x in t1 for y in t2]
    x_cord, y_cord = zip(*cordinates)
    mapped_cord = feature_mapping(x_cord, y_cord, power)

    inner_product = mapped_cord @ theta
    decision = mapped_cord[np.abs(inner_product) < 0.001]  #保留接近0的数据用于绘图

    return decision.f10, decision.f01
#画出据决策边界
power = 6
x, y = find_decision_boundary(power,final_theta)
fig = plt.figure(figsize=(12,8), dpi=100)
plt.scatter(positive2['test1'], positive2['test2'], c='b',marker='o',label='accepted')
plt.scatter(negative2['test1'], negative2['test2'], c='r',marker='x',label='rejected')
plt.scatter(x, y, c = 'purple')
plt.legend()
plt.xlabel('test1')
plt.ylabel('test2')
参考资料:
吴恩达机器学习系列课程
机器学习笔记
