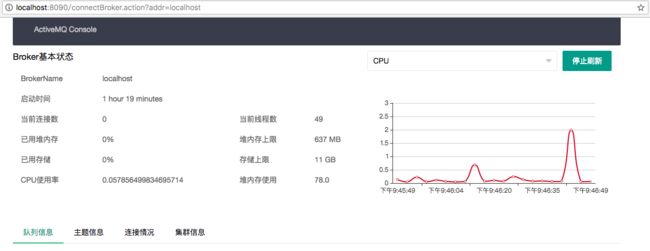
今天上午突然出现生产问题,由于使用bio模式,客户端在一个while(true)循环里不停执行connection.start()方法,导致MQ报出了异常:java.lang.OutOfMemoryError: unable to create new native thread。
应急处理完,要求我给出具体的原因分析,折腾了我一整天。但是也给了我一些灵感,MQ的监控页面需要有一个动态展示当前状态信息的地方。而且由于最好可以按需指定要展示哪些JMX的参数,所以扩展性要做的好一些。
折腾了一个小时,用EChart做出了一个动态展示的图表,前端使用AJAX和js的setInterval的方法来自动刷新表格,后端使用一个HashMap来保存字段在JMX中的ObjectName和Attribute。
匆匆忙忙写完,扩展性方面还可以继续提升,直接先上代码吧。
没使用单例,直接用一个静态类来保存JMX的ObjectName和Attribtue,JMX方法里其实还有其他的获取方式,我这里直接忽略了。
package com.springdemo.entity;

import javax.management.MalformedObjectNameException;
import javax.management.ObjectName;
import java.util.HashMap;

public class ChartEntity {
    public static HashMap> ATTR = new HashMap>();

    static String THREADING="java.lang:type=Threading";

    static String OPERATING="java.lang:type=OperatingSystem";

    static String MEMORY="java.lang:type=Memory";

    public static final String[][] NAME = {{"cpu",OPERATING,"ProcessCpuLoad"}
                                            ,{"thread",THREADING,"ThreadCount"}
                                            ,{"totalThread",THREADING,"TotalStartedThreadCount"}};

    public static void init() throws MalformedObjectNameException {
        for (int i=0;i getJmxMap(String objectName, String attr) throws MalformedObjectNameException {
        HashMap on = new HashMap<>();
        on.put("ObjectName",new ObjectName(objectName));
        on.put("Attribute",attr);
        return on;
    }
}
Broker类中添加上获取JMX数据的方法
    public Object getCharts(String type) throws MalformedObjectNameException, AttributeNotFoundException, MBeanException, ReflectionException, InstanceNotFoundException, IOException {
        if (ChartEntity.ATTR.containsKey(type)) {
            ObjectName on = (ObjectName) ChartEntity.ATTR.get(type).get("ObjectName");
            String attr = (String) ChartEntity.ATTR.get(type).get("Attribute");
            return mbsc.getAttribute(on,attr);
        } else {
            return 0;
        }
    }
在Controller中需要添加这样的类
    @RequestMapping(value="/charts")
    @ResponseBody
    public Object getCharts(@RequestParam(value = "type", required = false) String type) throws MalformedObjectNameException, InstanceNotFoundException, IOException, ReflectionException, AttributeNotFoundException, MBeanException {
        if (this.broker!=null) {
            return this.broker.getCharts(type);
        }else {
            return 0;
        }
    }
前端其实是添加一个select框,稍微用layui修饰了一下
最主要的就是js啦,使用jquery的ajax来刷新
    var bip=[[${broker.addr}]]

    window.onload=function(){
        getCharts('thread');
    }

    layui.use(['form'], function(){
        var form = layui.form;
        form.on('select(chartSelect)', function(data){
            getCharts(data.value);
        });
    });


    var myChart = echarts.init(document.getElementById('charts'));
    var data = [];
    var date = [];

    function addData(shift,types) {

        $.ajax({
            url:'/charts?type='+types,
            type:'GET',
            success:function(result){
                data.push(result);
                $("#"+types).html(result);
                d = new Date().toLocaleTimeString();
                date.push(d);
            }
        });
        if (date.length>=100) {
            if (shift) {
                date.shift();
                data.shift();
            };
        };
    }
    var int=null;
    function getCharts(types){
        if (null!=int){
            clearInterval(int);
            date=[];
            data=[];
        }
        int = setInterval(function () {
            if (bip != null){
                addData(true,types);
                myChart.setOption({
                    xAxis: {
                        type: 'category',
                        boundaryGap: true,
                        data: date
                    },
                    yAxis: {
                        boundaryGap: [0, '50%'],
                        type: 'value'
                    },
                    series: [
                        {
                            name:types,
                            type:'line',
                            smooth:true,
                            data: data
                        }
                    ]
                });
            }
        }, 3000);
    }
今日进展:使用JQuery替代vue重写了首页,完成echart动态图表展示。
